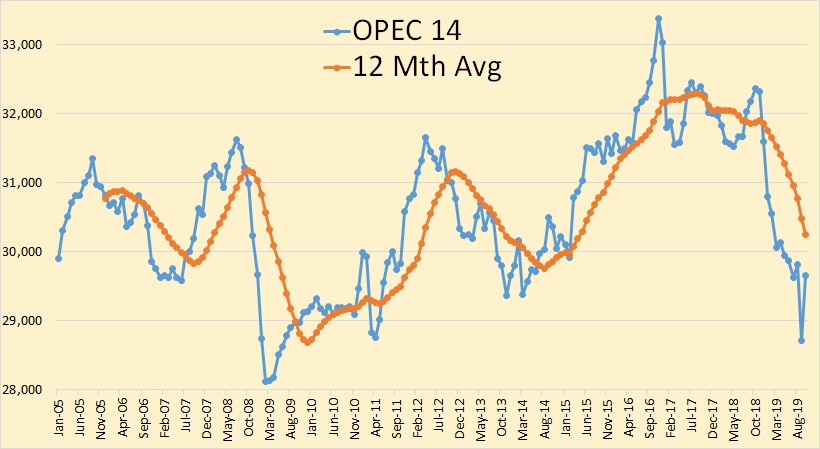
OPEC 14 bounced back from last month’s decline. And there were major revisions in the September data. Saudi Arabia’s September production was revised up 232,000 bpd, Nigeria’s production revised up by 96,000 bpd and OPEC 14 September production was revised up by 316,000 bpd.
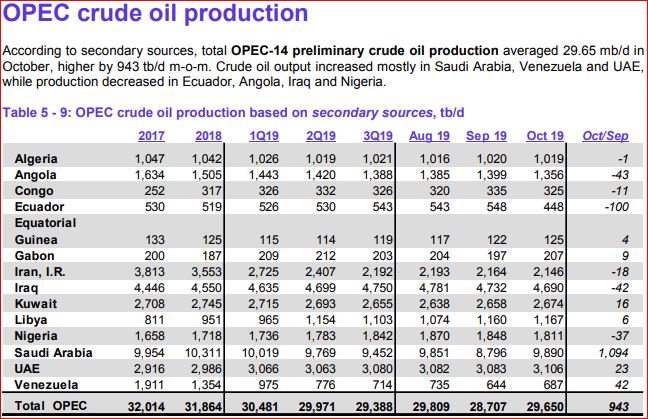
The big gainer in October was Saudi Arabia. Apparently they have fully recovered from the attack by Iran. The big loser was Ecuador who is leaving OPEC at the end of the year.
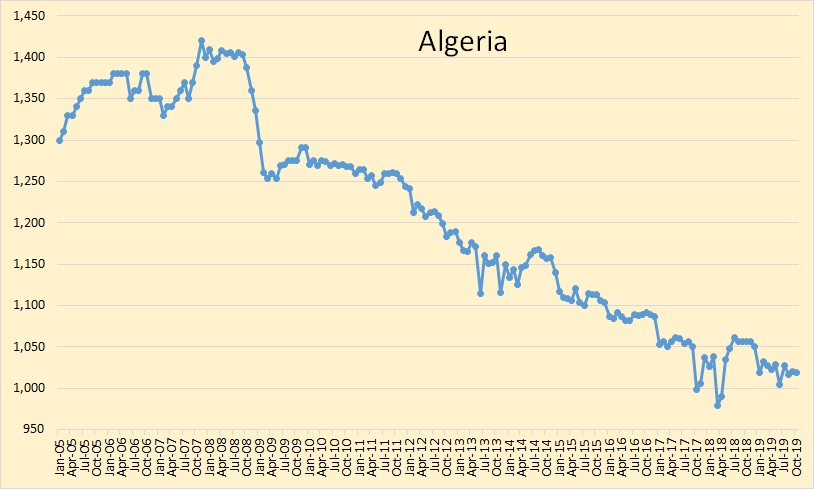
Nothing exciting is happening in Algeria.
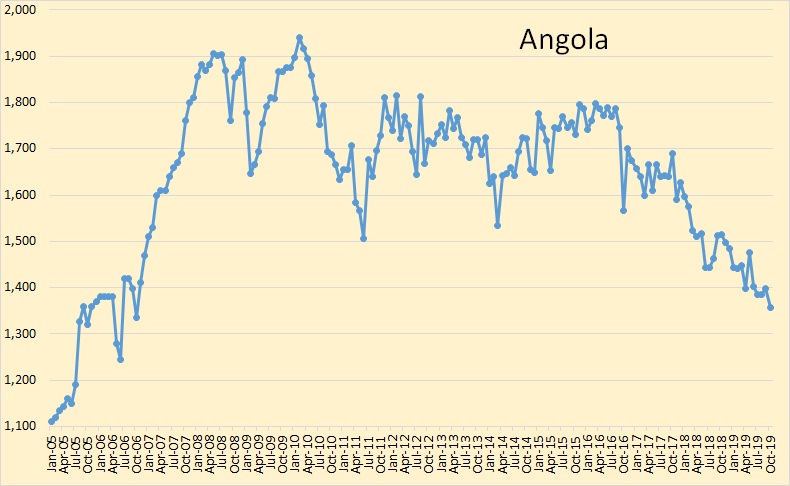
Angola is clearly in decline.
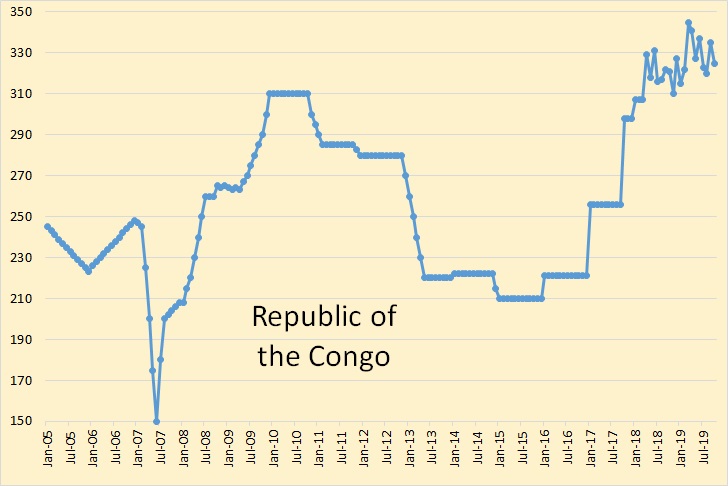
The Republic of the congo produced 325,000 bpd in October. Not important.
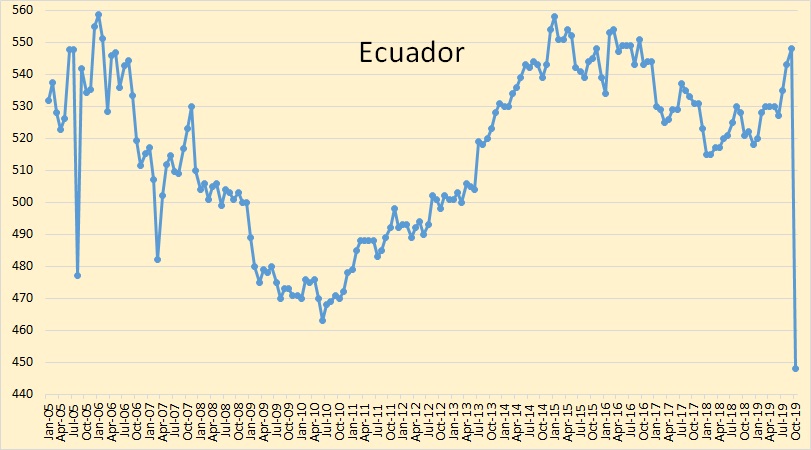
Ecuadorian crude oil production fell 100,000 bpd in October. No, it’s not a typo because direct communications said they fell 80,000 bpd.
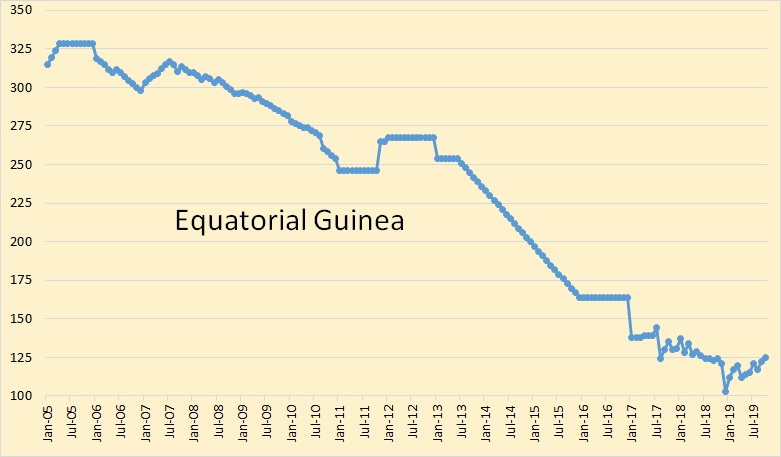
Equatorial Guinea is OPEC’s lowest producer.
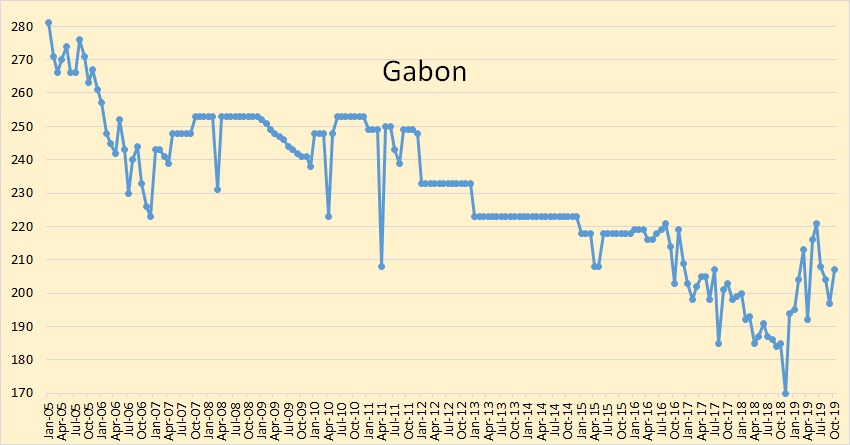
Gabon, another non-important OPEC contributor.
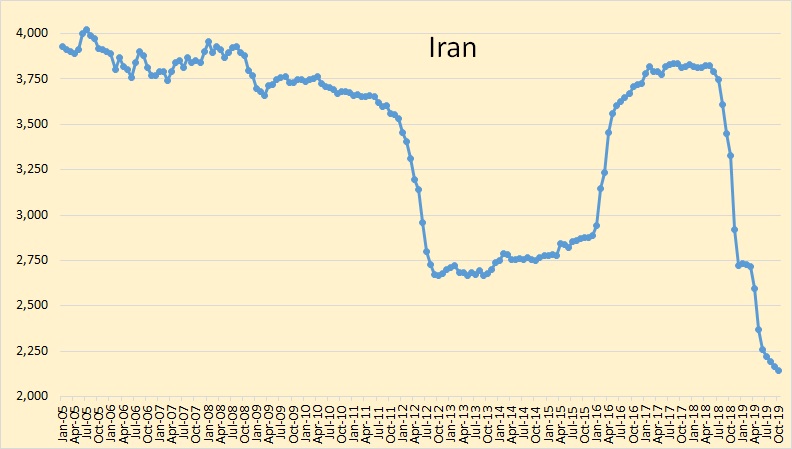
Sanctions are still biting hard in Iran.
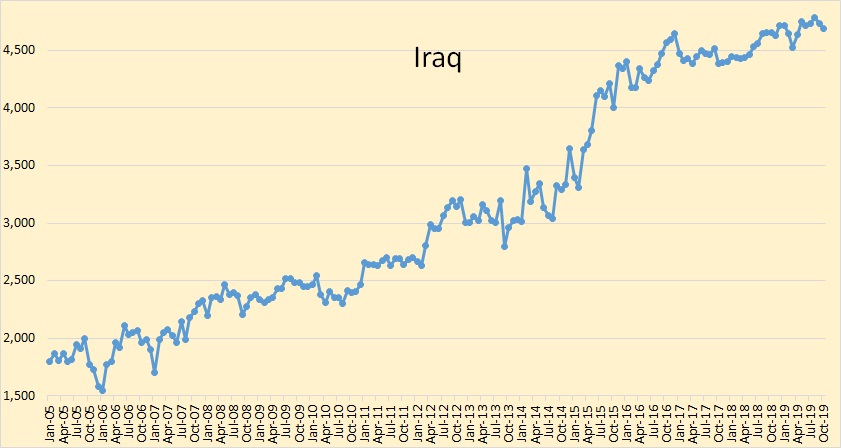
Iraq is still producing flat out.
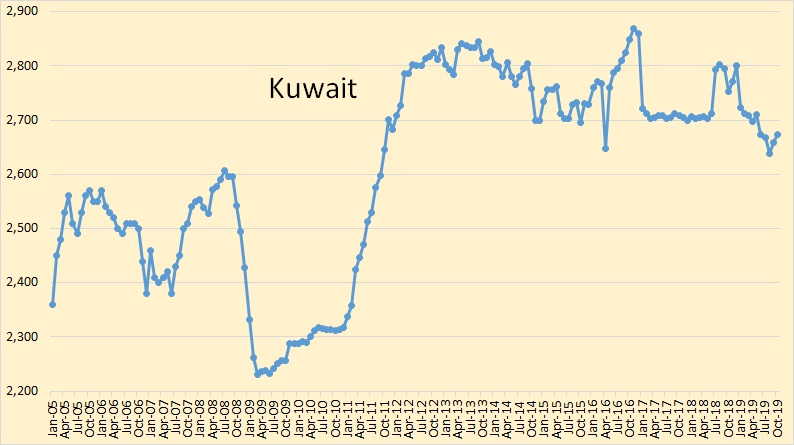
Kuwaiti production was up slightly in October.
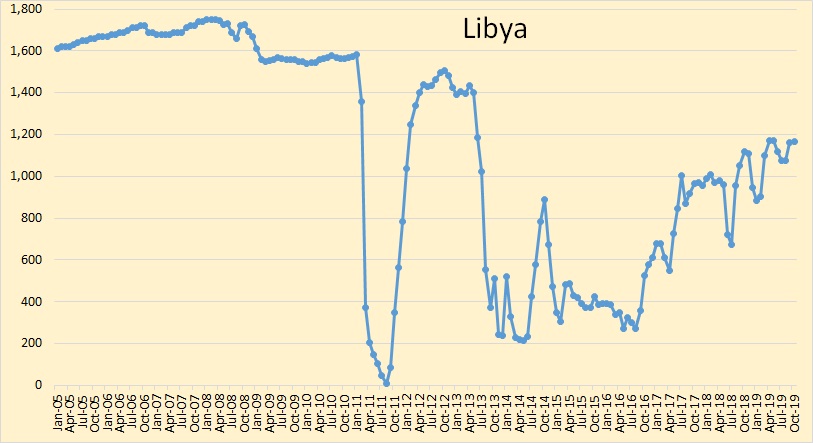
Libya is holding steady.
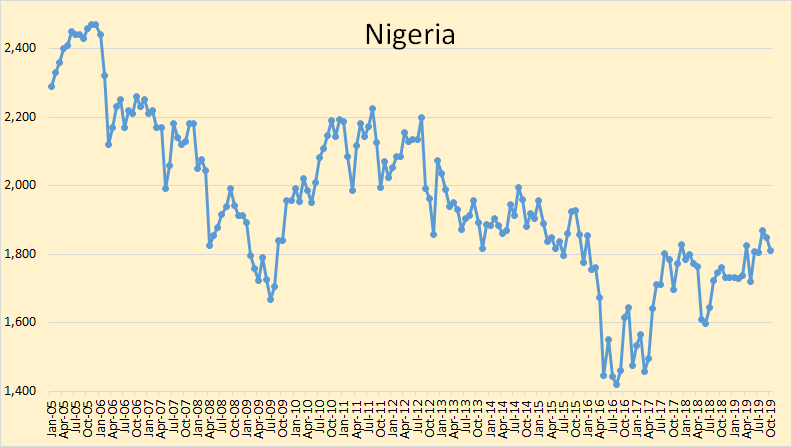
Nigeria was down slightly in October.
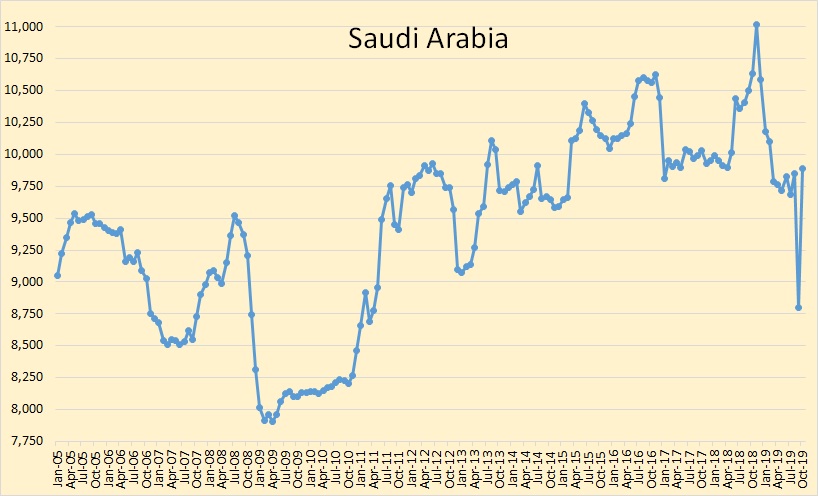
Saudi Arabian crude production has completely recovered from the Iranian attack. They were up 1,094,000 bpd in October. Plus their September production was revised upward by 316,000 bpd.
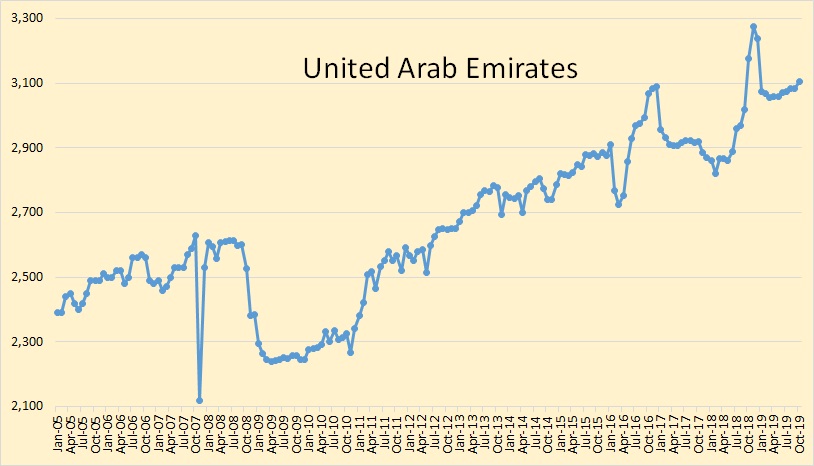
The UAE was up slightly in October.
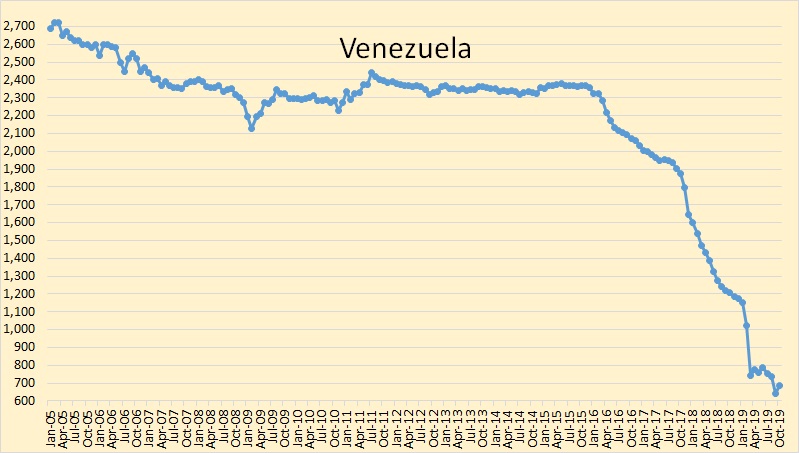
Venezuela’s decline seems to be petering out. I look for them to hold at this level unless Russia steps in and takes over.
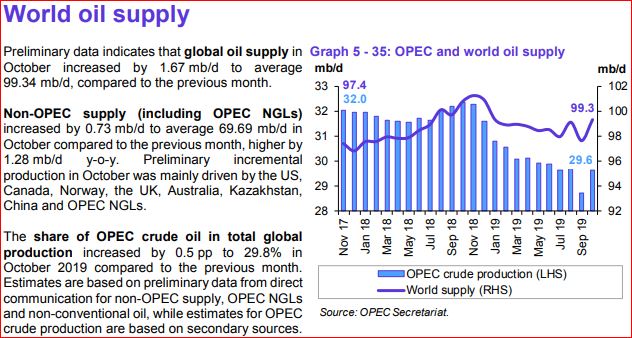
OPEC has World oil supply completely recovering from the huge decline in September.
The tables below were taken from OPEC’s World Oil Outlook to 2040 Executive Summary
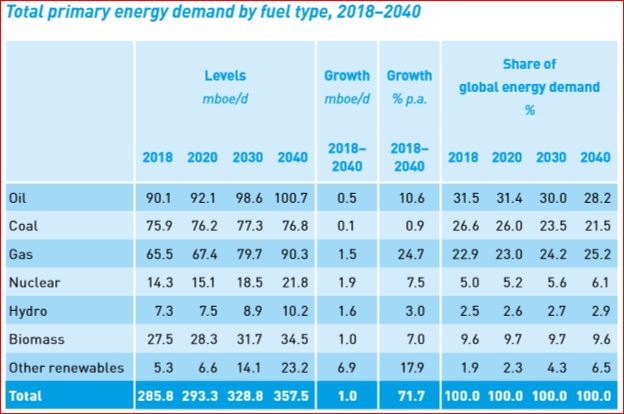
OPEC expects oil demand, and of course, production, to increase by 10.6 million barrels per day between 2018 and 2040. They expect coal to hold steady while gas increases quite dramatically. And, they expect “other renewables” to be 6.5 percent of total energy demand by 2040. I assume other renewables are wind and solar.
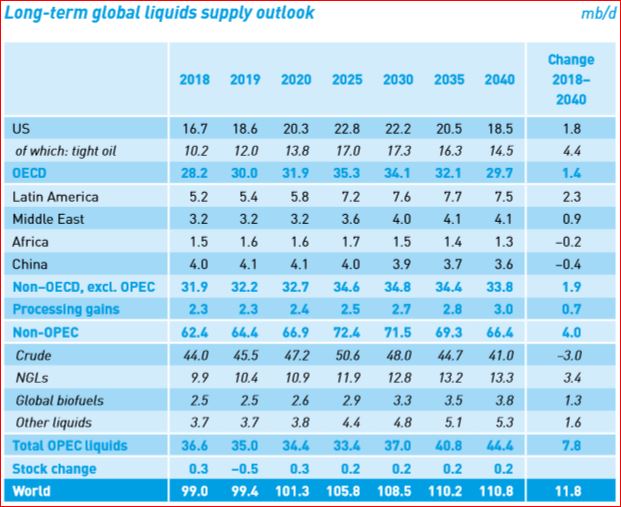
This chart is total liquids except where otherwise specified. Nevertheless, I think it wildly optimistic. They have Non-OPEC liquids increasing by 2 million barrels per day, 2019 over 2018. They have US tight oil increasing by 1.8 million barrels per day in 2019, to 12 million barrels per day and peaking at 17.3 Million bpd in 2030. (Those figures include unconventional NGLs.) However, they have US total liquids peaking in 2025 at 22.5 million barrels per day. They have Non-OPEC crude, as well as total liquids peaking around 2025.
Notice they have OPEC liquids declining by 3.2 million barrels per day between 2018 and 2025. Then they expect OPEC liquids to increase by 11 million barrels per day during the next 15 years.
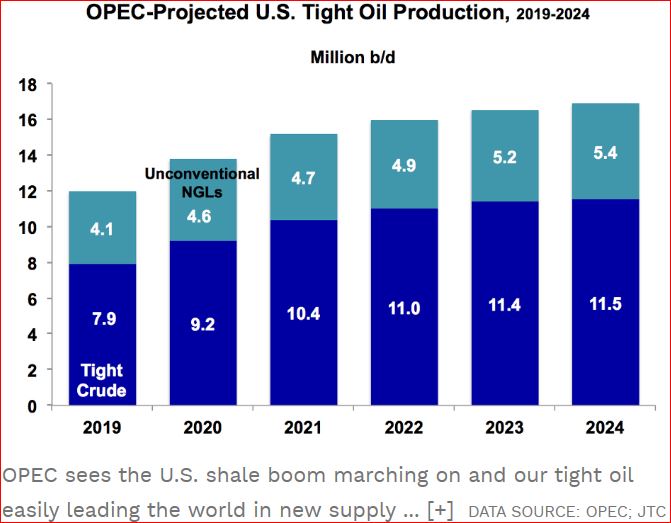
The chart above is from Forbes. The data was taken from OPEC’s World Oil Outlook to 2040.
Quote of the day from Resilience.OrgThe EIA anticipates that tight oil production will be 38% higher in 2050 than in 2018 and shale gas 81% higher, with tight oil providing nearly 70% of all US oil production over the next three decades and shale gas 74% of all gas produced over that same period.
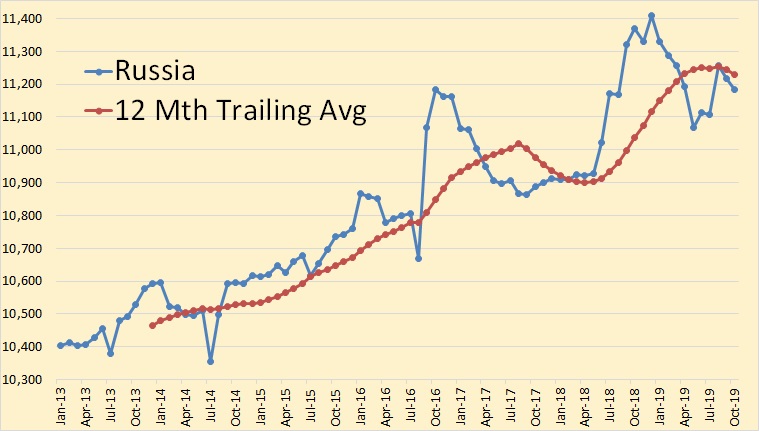
This is Russian production through October according to the Minister of Energy. Their report is in tons. I use 7.33 barrels per ton for conversion.
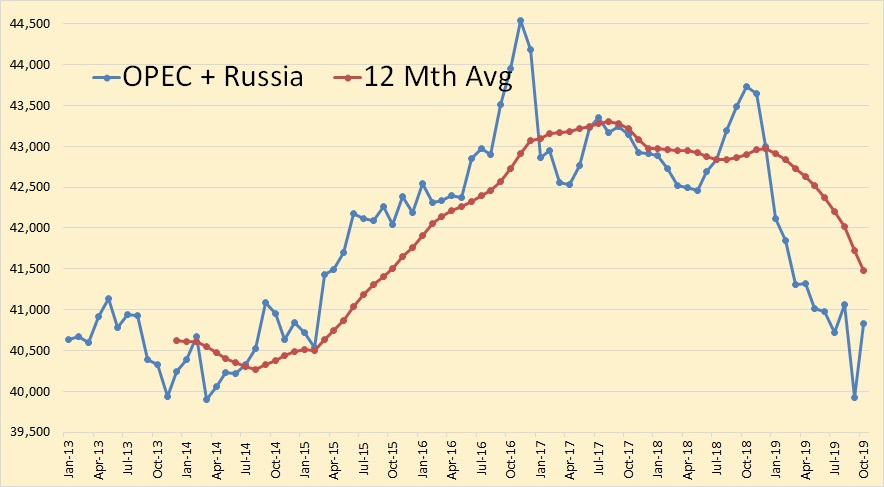
In December 2018, OPEC + Russia was 51% of world production. But that was not counting OPEC other liquids, NGL and Condensate. I am sure they are les than that today.
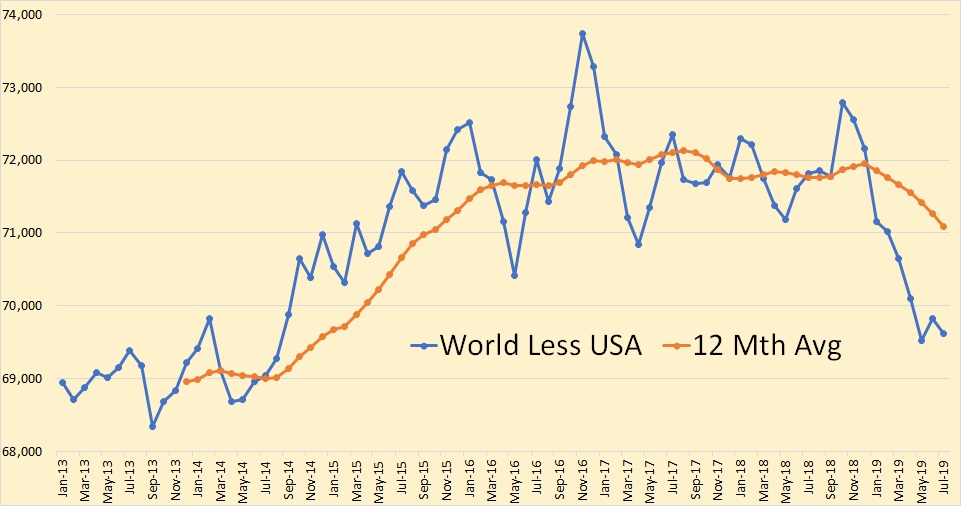
The above chart is through July 2019.
In November 2016 and October 2018, the two peaks, the World less USA was producing flat out. Yet the second peak is almost 1 million barrels per day below the first. I simply do not see the over 11 million barrels per day increase by 2040 that OPEC sees.
OPEC sees Non-OPEC production increasing, 2019 to 2040, by 2 million barrels per day. (After peaking around 2025) They see OPEC production increasing by 9.4 million barrels per day over that same period. And, they see OPEC, as well as the world, peaking well after 2040.
They are basically claiming that for any ncecssary increase in world oil production after 2025, the world will be completely at the mercy of OPEC.
Ron, check under the Nigeria chart for wrong name.
Thanks, fixed it.
Yergin has finally discovered US shale oil problems but oil demand peak comes to the rescue
https://www.bloomberg.com/news/articles/2019-11-10/aramco-ipo-prospectus-flags-peak-oil-demand-risk-in-20-years
Still not ready to call world peak? Who other than you Ron? Be brave. We’re fools to believe anything the Saudi Royals say.
ExxonMobil just abandoned Brazil pre salt. Shell gave up on Arctic long ago. Tight shale is dead in Vaca Muerta and Weald Basin, and soon to collapse here. It’s not windmills that are cutting OPEC production nor is it $60 to $70 Brent.
When US gets into decline then is obvious, also peak cannot be seen when it happens, it can be seen only in retrospective, you need at least 3-4 years of decline to say for sure that there was a peak otherwise it could be just a bump
Peak is obvious to those not swayed by industry/popular press or oil-exporter nation (OPEC et al) disinformation (OPEC et al). Domestic production among non-exporting nations may have been ginned up to placate poor citizenry? We don’t know. OPEC has cause to lie. A relatively few Saudi Royals own most of that country. They have no need to notify us, their oil market, or the other 32 million Saudi rabble. No private jet for them.
In the greater scheme of things (150 years of industrial production) 3-4 years is essentially right now. We’ve already used up two of those years. Or had production
actually peaked in Sept. 2017, Sept.2016? You can’t know for sure.
Nope, I have said 2018 has a 70% chance of being the peak. If Iran comes back in the next couple of years then that could move the peak to the point Iran becomes 100% back on line. Then that would become the peak.
But right now, unless Iran comes surging back, 2018 will, very likely, be the peak.
Thanks so much for the reminder. Yes, you have been brave and almost singular in your insistance that indeed world oil production peaked in 2018. That in spite of almost universal denial and shaming . . . this web site not excluded.
Peter,
So far the peak has been 2018. We will have to wait a few years to see if it is surpassed. If oil prices eventually rise as I expect by 2021, a new peak in World C+C output may be reached. Likely by 2022 at the latest.
I don’t see oil prices rising enough. Contrary to popular and often learned opinion, there are limits to which crude oil prices can rise. Nine years of +$80 oil (and specifically the run up to $150 oil) caused the Greatest Recession Ever. Not a bank failure, not a housing crash in Cincinnati. When this debt bubble collapses so to will oil prices. That’s peak.
Peter- “Nine years of +$80 oil (and specifically the run up to $150 oil) caused the Greatest Recession Ever”
Don’t know where you get your teaching on this, but I’d suggest you consider firing them.
Peter,
The Great Financial Crisis of 2008 had very little to do with high oil prices. In fact, the average Brent Oil Price from Jan 2011 to Dec 2014 was $117/b in 2017$, World real GDP growth at market exchange rates averaged about 3% per year over that period, very similar to the growth rate from 2015 to 2018 when Brent oil prices averaged about $55/b in 2017$.
Oil prices affect the World economy far less then you seem to assume.
Oil prices can rise to $90/b with little overall effect on the World economy. My best guess is that they will rise to $110/b at minimum by 2030, by 2040 or perhaps 2045 oil prices may begin to fall as the World transitions to electricity for land transport and demand for oil may fall below available supply at $110 per barrel.
Dennis
I think that the oil price was the trigger to the financial crisis. What set the scene was the US highly levered mortgages that were sold to people who could not afford them and were sold under false pretences. Sell the house a year from now and make $100,000. The high price of oil made driving more expensive and then they could not make their mortgage payments and then mortgage defaults began to mount on account of this. Then the whole house of cards collapsed. The movie “The Big Short” revealed all of this.
Ovi,
I don’t remember oil prices being a big part of that movie. Oil prices were a very minor part of the story, mostly it was a matter of poor regulation of financial markets.
One has to reconcile the fact that 2011 to 2014 had very high oil prices and relatively robust economic growth.
I would agree oil prices might have been the straw that broke the camels back, but anything could have caused the crisis when the bubble was ready to pop, could have been copper, corn, wheat, or prices in general. The high oil price could well have been coincidental and had very little to do with the crisis.
From my perspective it was a tiny part of the overall story.
Dennis
I did not mean to give the impression that oil was in the story. The oil drum had an article on the role of oil in the collapse.
https://oilprice.com/Finance/the-Economy/Oils-Role-in-the-Global-Economic-Crisis.html
Here is a quote from the article: “Direct impacts on discretionary spending. Between 2002 and 2008, average household expenditure on gasoline rose 120%, from $1,235 to $2,715, or by 2 percentage points of overall household expenditure (CES 2011).
Hello Ovi, hello Denis
I think oil was a bit more than a straw that broke the back, though it points basically in the right direction.
Before the crisis of 2007 high oil prices were a new phenomenon that summed to the already existing bubble. When recovery kicked in, QE papered over the high oil prices and basically made fracking possible. The result is a new bubble that is yet to burst.
Of course QE was and is not mentioned just to cushion and absorb high oil prices, but this effect was and is definitely factored in. We still have to see how all that plays out.
Whether the coming bubble-burst will be severe or not, IMO will define a lot where the peak has happened or is going to happen.
I think oil fields decline is faster than demand decline, So oil price will continue to rise till it reaches parity with e-fuels.
Parity with e-fuels? If you are talking about liquid fuels, fuels necessary for air flight, or huge diesel transport trucks, then there is no cheaper fuel than petroleum. If there were then they would be in heavy use today. There is a reason planes do not use corn ethanol, or why heavy transport truck do not use it exclusively.
I am talking beyond petroleum.I understand that nothing can match oil but when it is not enough then e-fuels ( Renewable Electricity based Fuels) has to fill in as there is no other choice.
efuels vs the black goo . It is like Mohd Ali vs Majed .
ROFL
https://www.eia.gov/dnav/pet/hist/LeafHandler.ashx?n=PET&s=WCRFPUS2&f=W
I see now from EIA Weekly the US production have reached 12.8 mbpd. EIA, Rystad exspect this growth will continue for decades. My question is, how is this increase possible in a period where Baker Hughes rigg count shows decline , frack spread shows decline for seceral months. ? Is the answer the significants decline in DUCS , perhaps some even where fracked but not put in production as lack of pipe line capacity ?. Is it the best DUCS thst is used first, guess they know some about quality of rock from the core samples.?
I guess there comes a time when the DUCs are nostely used , guess than they need to add significant cost each barrel from new wells that also are drilled, how will this impact capital spending disipline as Banks, Investors have implied in the shale plays. At last there might be a possibility that levels of DUCs reach a low level at the same time as billions of depth shall be payed back and I guess the banks want their money… very interesting time ahead 2020-2021, what if Rystad and EIA have under estimate the impact of capital and the requirement of a profittable shale Buisiness that not are built on depth funded growth…
Freddy,
At some point C+C consumption growth will outrun growth of C+C output, when that occurs, oil prices eventually rise, rig counts and frac spread counts will rise in response to higher oil prices (and higher profits) and eventually output rises and keeps oil prices in check (or oil prices decrease if output rises more than the level of desired consumption at any given price level.) The market has very poor visibility of World Stock levels for non-OECD nations where most of the consumption growth is occurring. The OPEC oil market report has a nice discussion of this problem near the beginning of the report see page v just before the table of contents.
The Drilling Madness Catching Up To the U.S. Shale Patch
In the top four U.S. Shale Oil Fields, production seems to be peaking while the new well profile continues in the same upward trend.
What took 20 months for 2017’s production to decline 2 million barrels, only took eight months in 2018. 2017’s production peaked in December-17 at 2,769,316 bopd then declined to 727,795 bopd by August 2019. However, 2018’s production peaked at 3,818,141 bopd in December-18 and declined to 1,828,641 bopd by August 2019.
Yes, Yes… Yes, the 2017 decline is 74% over 20 months and the 2018 decline is 52% in eight months. The numbers aren’t that much different than the typical individual well decline rates.
Yes… Yes… Yes, that is more than perfectly obvious. However, what isn’t perfectly obvious is that it is a much different story to analyze 100 wells that decline 52% over an eight month period versus 9,953 wells losing 2 million barrels per day in the same time frame.
Consequently, the real problem is the “Compounded Annual Decline Rate” when the years are stacked on top of each other. So, when the “sophisticated” energy analysts state that there is “NOTHING TO SEE HERE” because these wells are still declining in the same percentages, for some odd reason, they fail to realize that how many years can the shale industry add another 10,000+ wells????
Agreed, the shale industry could have gone on for decades by adding 500-1,000 wells per year. But, when the annual number must increase to 12,000 this year and 13-14,000 next year to grow production, so on and so forth, at some point, the “sophisticated” energy analysts have to realize that the exercise becomes grossly obnoxious.
Steve
https://srsroccoreport.com/the-u-s-shale-industry-hit-a-brick-wall-in-2019/
Steve, it just ain’t gonna happen. Not only is the rig count dropping like a rock, but fracking spreads are declining just as fast. And they ain’t coming back because they are being sold for scrap.
Frackers Scrap Idled Equipment Amid Shale Drilling Pullback Bold Mine.
(Bloomberg) — The downturn in shale drilling has been so steep and brisk that oilfield companies are taking the unprecedented step of scrapping entire fleets of fracking gear.
With almost half of U.S. fracking firepower expected to be sitting idle within weeks, shale specialists including Patterson-UTI Energy Inc. and RPC Inc. are retiring truck-mounted pumping units and other equipment used to shatter oil-soaked shale rock. Whereas in previous market slumps, frackers parked unused equipment to await a revival in demand, this time it’s different: Gear is being stripped down for parts or sold for scrap.
Ron,
I totally agree. When I stated that the shale industry could have gone on for decades, that was only if they drilled 500-1,000 total wells per year from the beginning, not all in one year.
So… the days are numbered for the Shale Industry.
Watch as the disintegration of the Great U.S. Shale Ponzi Scheme picks up speed over the next 1-2 years.
Steve
That’s the way any state oil company anywhere in the world would do shale – they would employ 50 rigs, 30 spreads and 10 access – pipeline / pad building teams( any numbers ) and grind year for year through their field – with nearly constant output.
The oil industry is not done by a long shot yet. But it requires a boom sentiment to take out more of the potential. It is backward thinking to believe low oil prices are going to be supported by production from the west only. There are several places alien to the “West” that have substantial potential in the Middle East, South America, Africa and Sentral Asia. And we have aboundant natural gas resources that can substitute for oil, when oil prices are high enough. But the arrogance of the west now as I see it, is going to bite back hard. We can not have the cake, eat the cake and make others pay for the cake at the same time. The people in charge in the US and EU can not accept the weakness the energy landscape dictates, and in my opinion we are going into a fullblown crisis pretty soon.
So to comment directly on your statement; higher oil prices over a sustained period of more than a few months will not only make shale resources economical outside the US. Other plays as well offshore or shelved for different reasons (often heavy oil inland) can be more relevant again. Also it will encourage more natural gas investments that especially would rely on LNG shipment. And promote wind, solar and geothermal energy where that is economical. Battery technology is extremely interesting to make work even better. Better recycling of battery raw material is something that should be sponsored by several states the way I see it. Once there is an agreement of the optimal scalable battery technology that is (is cobalt required?, the Glencore closure of mines in Congo kind of confused me.)
The summary is pretty easy. Oil is becoming more costly, but is not running out anytime soon. That requires a transition along with higher oil prices. Why all the propaganda to suggest otherwise? There is a lot of evidence in history to suggest that intervention into free market discovery of price is the second best option. The free market has been one of the cornerstones of prosperity for a long time, not at least because it promotes free trade. Unfortunately; not confident that many enough see it the same way.
The horizontal oil rig count was averaged about 385 rigs in the 12 months leading up to April 2017, over that 12 month period US tight oil output increased by 6%. There were too many rigs and frack crews operating in 2018 and US tight oil created an oversupply in the oil market. Now rig counts and frack crews are falling back to sustainable levels, this is typical of the booms and busts in the oil industry. The companies that have expanded their frack spreads to levels they believe are too high given current market conditions have decided to scrap older equipment, that is also not unusual.
Dennis, I think you miss the point entirely. Of course, your point is valid. What you are overlooking is the effect this will have on new shale production. Remember about six barrels of new oil must be produced to get one barrel increase over the previous production. The other five barrels go to replace legacy decline. Therefore if production declines by just one-sixth, then there is no increase in overall production whatsoever.
I see the decline in rig count, as well as the decline in crack spreads, leading to a decline in new production by at least one-sixth.
Ron,
The point you miss is that the legacy production change does not remain constant, just look at the historical data from the DPR to convince yourself of this fact. Chart below uses data from three different DPR reports (Sept 2015, Jan 2017 and Oct 2019).
As to the effect that fewer completions will have on output, I have modelled that, a decrease in Permian completions by 18% (from 495 new wells per month to 406 new wells per month), keeps US tight oil output flat at about 8 Mb/d from Aug 2020 to Jan 2023, this assumes the completion rate in the Permian basin remains at this level through Dec 2030.
It seems doubtful the completion rate would remain constant for such a long time, my expectation is that the completion rate will rise as oil prices are likely to rise in the future.
Flat output model with lower Permian completion rate (decrease from 495 to 406).
Dennis, I agree that Legacy decline will depend off how many new wells each year are set into production. But it is vital to see time have change , now the general rule is the new well that before was funded by borrowed money will not be possible to fund asthe capital marked for us shale and also other oil and gaz project is significant reduced. Now is it focus on invironmental friendly buisiness. Another issue is according to Q3 result most operators are burning cash and and not are able to see profit even they use DUCS that significant reduce cost. It means reality will soon be they get problem to pay their running cost and at least few new wells when wti is at the 50 usd range. It means when DUCs have been reduced to a certain level , dead DUCs or bad DUCs left more new wells need to be drilled to prevent US shale from declining in 2020. What Mark Papa have told is there will not be exspansion before WTI is above 75 usd . Than the shale buisiness will earn at least the best acre and the market will be overfload again that will lead to low price again for some time. In that way now and future the legacy decline will be related to the WTI price and US will become a swing producer .
Freddy,
I agree growth in tight oil output will be lower than it has been in the recent past, tight oil output might even decline a bit if the completion rate goes down enough, but my guess is that at some point oil supply becomes short, oil prices (brent price) go back to $80/b (peak price in 2018) and completion rate again increases (perhaps in the 2021 to 2022 time frame).
Much depends on the future price of oil, if you tell me that I can make a better guess at future output.
Seems nobody knows the answer to the future oil price question. Leaves us guessing.
Steve,
You are wrong, the number of new wells added can remain the same and output will still increase, in fact output remains constant if number of new wells added each month decreases by about 15%.
Scenario for US tight oil below assumes completion rate is constant at August 2019 rate through 2025.
The mistake most people make is to assume legacy production change will continually increase in magnitude. That is only true with an increasing completion rate as completion rate levels off (becomes constant) the legacy production change gradually gets smaller in magnitude (or absolute value).
Dennis,
In your imaginary world of charts, indeed, you may be correct. However, there is this little thing called DEBT that is also a problem. Not just with the Shale Industry, but also the massive amount that overhangs the entire global financial system.
There is no coincidence that the Fed is playing REPO MAN in the markets currently. Of course, some analysts will say, THERE IS NOTHING TO SEE HERE, so let’s move onto the next round of QE that isn’t QE.
At some point Dennis, you are going to have to pull yourself away from those CHARTS and take a GOOD LOOK at a world that is getting ready to fall off a cliff due to the popping of the massive DEBT & LEVERAGE BUBBLE.
Dennis… lastly, you remind me of the musicians on the Titanic playing their instruments to help calm the passengers. While you efforts are noble indeed, the Titanic still sank.
Steve
SRSrocco,
In terms of depletion analysis, the difference between now and way back when is that the public finally gets to work with actual data. The charts you are disparaging were only available in oil industry back rooms 20 years ago. The bottomline is that data is good, but feel free to correct how the lines are drawn. It’s nice for once to be able to connect the dots.
Debt and money is pure virtual – it’s only a tool to move manpower and equipment around.
Like the 5-year-plan of socialist countries, but much more fine tuned.
You have round about 200 million workers in the USA – they can only work once a day, no matter how many money you print. Money decides if they drill an oil well or serve a hamburger – or develop Eyephone 15.0 .
Problems with money supply disturb planning – let’s say too many fracking wells or too many houses in Texas build (when immo market runs rampart ). That’s why the market system is only better than socialism if it runs smooth, or can clean out a crisis and start over after some companies go the way of the Dodo. When this is prevented too long time, things go wrong.
Steve,
In your imaginary World of imminent financial crisis, everything looks bad.
I am just pointing out that the claim that more and more wells will be needed to increase output is likely to be wrong. I am not the only person who thinks this, experts like David Hughes and Art Berman also dispute your claims.
Perhaps if you say them often, people will take them as the truth.
I am not convinced.
Here is my “imaginary” Permian basin model, compared with EIA tight oil output data from January 2010 to Sept 2019. R squared for model vs data is 0.9994 which is pretty good considering the simplicity of the model.
IMO, The reason Dennis’s model works so well is that we know accurately how many wells are in operation at any time and we are making a very good estimate for an average depletion profile per well. The high correlation coefficient results from this knowledge (and how to do a convolution of course helps).
Nothing magical about this despite the fact that old hands in the oil industry claim it takes some other insider wisdom to do a proper analysis.
Standing on the shoulders of giants …
Dennis’ model is just applying the lessons learned from Mr Pukite and others.
Good data made easily available by Enno Peters at http://www.shaleprofile.com is also very important, both to estimate well profiles and to get completion rates.
Some of the “others” besides Mr. Pukite from whom I have learned much, prefer that I not refer to them by name.
Their comments appear below.
Thank you both. I continue to learn from your comments.
Yes, it’s an absolute miracle that the worldwide oil and gas industry was been able to function for over a century without two “statisticians,” one for Maine, the other from Minnesota, neither of whom has ever even seen a drilling rig in person, much less write a check to own working interest in a well…ever. The world owes you two a great deal of thanks for knowing exactly what the future will look like. I for one, feel much better.
Now, let us all hold hands and hope (dare I say pray, here on POB?) that the Energy Information Agency of the United States of America has predicted the price of oil precisely correct, to the nickel, 15 years out. In the meantime, feel free to tweak those models as may be necessary.
“Those who have knowledge, don’t predict. Those who predict don’t have knowledge.” Lao Tzu 6th century BC poet.
Compared to the EIA and IEA models, Dennis’ seem much more reasonable in their assumptions, especially after reading David Hughes latest critique of shale oil. He has also stated repeatedly his assumptions and that they are just as likely to be incorrect. If the most important resource in the world (oil) will be running out soon, having at least a good guess at what will happen at what price seems better to me than the cornucopian garbage from the EIA.
Stephen Hren,
Along with Mike not liking my charts, he doesn’t like my oil price assumptions or the TRR assumption.
Scenario below for Permian basin assumes low TRR (43 Gb) and low oil price ($60/b0) with a URR of roughly 19 Gb after economic assumptions are applied.
Doubtful Mr Shellman would approve, as we do not know the future. I agree we do not know that this scenario would be correct. It is one of an infinite number of possible futures.
Odds it or any other scenario of the future will be correct is very close to zero.
I say this all the time, many refuse to believe this is what I think.
Thanks Mike,
I agree nobody knows the future. I say this in nearly every comment I make. Yes the EIA also does not know prices, I use that as a reference scenario in some cases.
Those in the oil industry function just fine without input from me, I am simply trying to understand what might happen in the future based on a set of assumptions about what might occur.
No doubt you do the same in your business without any formal model, you base any decisions you make on a set of assumptions about what you believe the future will look like.
You strike me as a highly intelligent individual, my guess is you do not fly by the seat of your pants.
If we assume the price of WTI and natural gas remain at today’s level (or lower) for the foreseeable future, then the tight oil industry will need to cut back severely on the new well completion rate.
I think your analysis is excellent as in
https://www.oilystuffblog.com/single-post/Beware-the-Bearer-of-BOE
As you perhaps know, I always do my EUR estimates in barrels of oil.
Note that a scenario is a bit different from a prediction.
It is a what if exercise as in if A, B, and C are true in the future then oil output will look like D.
Every business plan requires assumptions about the future, it is in essence a scenario.
The Permian model up to Sept 2019 requires no future price prediction.
Does this mean that the gas they flare off is sometimes counted as part of “oil” production?
Not the way I count oil production which is C+C only, I don’t count natural gas or NGL as “oil”.
Paul Pukite wrote:
IMO, The reason Dennis’s model works so well is that we know accurately how many wells are in operation at any time and we are making a very good estimate for an average depletion profile per well.
What are your sources for all those well data and does that apply to the whole world?
What Dennis has done is to use actual data to tweak his model to reflect actual developments. Period and Basta!
In most of the world that would not be considered an achievement. What (the chart above) Dennis posted has no predictive power.
I took copies (for my HD) from what Dennis posted over at oilystuff.blog (later deleted by the owner, where Dennis did not understand the scope of the article), and Dennis’ well profiles do not line up with actual data.
So, what is it; if the real world does not align itself to some poor and incomplete model, is the real world wrong?
Mr. Pukite got one thing right; it is easy to predict the past!
Most universities have some ethical board.
Mr. Paul Pukite is the kind of person that when asked for documentation/references to support his claims, he goes quiet.
(In a real oil/gas company management by the standard operating procedure (SOP) always asks for documentation to support decisions/strategies and holding a Ph.D. (or some other degree) does not give a pass.)
A typical well profile has statistical properties, Rune. It’s really not that hard for applied math people to figure out.
Mr Likvern,
I tend to adjust the well profiles to reflect the data, just like you.
Yes there is no predictive power, I agree.
I do not know future completion rates, nor what future well profiles will be.
The models start with well profile data and completion rates up to the most recent data available. They also assume for “medium scenarios” that the USGS mean TRR estimates are correct, then a set of economic assumptions are applied that determine whether a new well gets completed. The net present value of future discounted net cash flow must equal the well cost at minimum for a well to be completed (annual discount rate set at 10%).
ERR for most oil price scenarios is roughly 75% to 80% of the TRR, for low price scenarios the ERR is close to 50% of the TRR and for high oil price scenarios ERR is roughly 95% of the TRR (this has been looked at most closely for the Permian basin).
For the well profiles presented at oily stuff the fit was from month 5 and later, for early months I simply use the actual average well data for the well profile, in fact I use actual data and the future output is based the modelled well profile (so if for the average 2017 well I have data for months 1 to 24, the actual average well profile data is used and the hyperbolic well profile fit to the first part of the data (month 5 to 24) is used for all months after month 24.
There is a lot of statistical variation in average well data month to month. The surprising thing is that the simple model works as well as it does, I was surprised the first time I saw your post on this at the oil drum, still seems amazing to me. You have done excellent work in my view.
The well data is from shaleprofile.com for the tight oil models, shaleprofile collects the data from state agencies in the US.
Dennis said:
That’s all there is to it. Yet I can’t figure out why this seems to fan the flames so much. If it was more difficult, would people get less riled up?
There is a phenomena whereby technical gurus act as if what they do is very difficult, so that they can maintain their air of mastery over the subject. I don’t think we take this approach and the evidence for that is plain to see.
Dennis,
Charts of possible future shale oil production tell a lot, but ignore the big picture. However I look at them with curiosity.
Climate change and crude oil depletion are only two of the many challenges to tackle. Provoking a flight of ideas like planting a thousand billion trees to lower atmospheric CO2 levels.
There are known and unknown connections between all of threatening issues. Certainly rising debt (government and consumer debt f.e.) will play a role in future oil production. Problems that pension funds (will) have because of zero or negative interest rates, at least in Europe, is another issue. Those rates, invented to boost the economy, will not change anytime soon.
My prediction is that all the, more or less, interconnected issues are increasingly difficult governable the next decades. Going out of control so to speak. Even now already in a rich country like Holland where the economy is doing well there are many issues: strikes of health care workers and teachers who demand more salary; farmers who have to reduce livestock or called on to quit completely because of nitrogen emissions and concentrations being too high in many parts of the country; building projects are halted because of the same reason while there is a shortage of houses in Holland. Meanwhile the maffia from different countries is buying houses to invest and for money laundering…and rent them at exorbitant prices. Examples of problems increasingly difficult to manage. And that in a country where almost everything seems to be ok. Problems in countries that are often in the international news are much bigger: high youth unemployment, low salary for most who have work to name two.
These two troubles are the reason that the detrimental effect of oilprices above 80-100 $/b must not be underestimated. Liquid fuels rise in price, but food also. Everything that you buy could rise in price, because to produce and transport products to the stores will cost more and that will lead to cost recovery if store owners want to keep the same profit margin. In other words: the world is drenched in petroleum distillates.
I hope your scenario of slow rising oilprices and transition to EV’s comes true the next decades. The percentage of crude oil used by all ICE cars is quite high, but not as high as some expect. Last month you was involved in the discussion regarding this point and we saw pass some calculations showing what happens when yearly an x amount of ICE cars is replaced by EV’s. In the meantime air traffic is foreseen to increase a lot the coming decades and plans are accordingly.
Steve,
I predict a peak in 2025. When do you expect the debt bubble to burst?
Seems you have expected this to occur any day for about 5 years.
Maybe you will be right at some point. 🙂
non-opec plus (vienna group) minus US output for past 10 years and centered 12 month average.
Someone above mentioned the Vaca Muerta is dead. There was a recent election in Argentina that brought in a new Administration whose policies for Argentina energy had not yet been defined and so I thought maybe the comment above has some information about that.
All I’ve seen is mention about a particular individual in the new Administration who is thought to have the inside track to be energy minister. He has put onto paper what the new Administration’s energy policy would be, and it focuses on the Vaca Muerta. The thinking is that there will be capital controls nationally and there will be a specific loophole in them for VM drilling.
There is a natural gas liquification ship offshore Argentina and a few days ago the first LNG shipment left that facility for Brazil. That gas came from the VM.
Interesting event has unfolded with the upheaval in Bolivia. Bolivia has been exporting gas to Argentina and Brazil and there is a long-term contract out to 2026 in place. But Bolivia has notified both customers that there may be disruptions in supply because of the upheaval. The new Administration has hinted that any disruption in supply terminates the long-term contract and they’re willing to do this because of progress in the VM.
Oddly relevant to this, the present Administration in Argentina has been a vocal leader among the anti Venezuela government drum beat. The new Administration is likely to be much more friendly towards the Venezuela Maduro government.
There is some hype out there, and there is actual money. Some company called Pan American Energy has floated about 120 million dollars worth of bonds at 5% for VM drilling. I wouldn’t care about this except the company is described as “BP-backed”. That is more attention-getting.
The present Administration projects 500K bpd in VM exports by 2023. blah blah
Ron,
Nice and interesting post as always, thanks.
Since no one has offered yet i will put on the thin foil hat and adress the Saudi Arabia back to normal levels.
How does the direct / secondary sources work for production guidance? Can it be excluded that Saudi simply uses a bit of stored oil to pamper production figures until they really get back?
I mean they certainly have incentive to get that incident forgotten as soon as possible considering the launch of the IPO and their problematic valuation.
Before we can actually know doesn’t it require that we check storage levels in the coming months, and also that customers are not receiving other grades of oil then normal?
Not necessary. Even when they don’t have the surplus capacity they claim – they have the infrastructure for producing more.
So they perhaps reroute half products to other facilities.
they have the infrastructure for producing more.
I don’t know that this is the case. Perhaps, perhaps not. At any rate there is just no way they had one million barrels per day of excess production capacity that they could have brought on line within the two weeks that it took them to restore production to previous levels.
I don’t think it’s production capacity, it’s processing capacity. They’ve blown up a processing plant – so reroute your pipelines to process parts of the oil in another plant sitting half idle because of declines of an older field.
Not that easy.
Two thirds of Saudi oil is stabilized at the Abqaiq Processing Facility. The remaining 1/3 at Ras Tanura.
Secondary sources just look at exports and reports of domestic consumption. Oil could very well come from storage tanks and reported as production.
Ok thanks,
So wait and see then, there were some reports of customers that had been asked to accept different grades i remember. Haven’t heard anything if that has changed.
Is there any good tracking of saudi storage could be really interesting coming months.
I guess we will have to take their word for it..
Major Shareholders To ExxonMobil: Cut Shale & Focus On Profitable Ventures
While Dennis enjoys providing future shale oil production charts for our viewing pleasure, here is a forecast I have for ExxonMobil’s major shareholders. At some point over the next 1-2 years, we are going to see a replay of the BHP Billiton’s escape from the clutches of the U.S. Shale Industry Ponzi Scheme. While BHP Billiton got off with only losing $20 billion, ExxonMobil might not be that lucky.
Here is some relevant data for ExxonMobil’s Major Shareholders to CHEW ON:
Q1-Q3 2019 U.S. Upstream Earnings = $468 million
Q1-Q3 2019 U.S. Upstream CAPEX = $8.8 billion
Q1-Q3 2019 U.S. Average Production = 639,000 bopd
Q1-Q3 2019 Non-U.S. Upstream Earnings = $7.8 billion
Q1-Q3 2019 Non-U.S. Upstream CAPEX = $8.6 billion
Q1-Q3 2019 Non-U.S. Average Production = 1,730,000 bopd
Clearly, anyone with a functioning BRAINSTEM should see that ExxonMobil’s U.S. Upstream Sector is a complete disaster. And, without ExxonMobil’s ability to rob Peter (Non-U.S.) to pay Paul (U.S.), Shale in the U.S. wouldn’t be a viable commercial project.
Furthermore, ExxonMobil had to borrow $7 billion of debt in August mostly to pay Dividends. Total Free Cash flow minus Dividends for Q1-Q3 2019 was a negative $5.2 billion.
Some POOR SLOB actually took a 30 year Senior Note from ExxonMobil that matures in 2049.
Good Grief.
Anyhow… we will still get more of the “NOTHING TO SEE HERE” mentality from the “sophisticated” energy analysts right up until the point the Shale Industry goes KAPUT.
Steve
Steve,
How did things look in 2018? Oil prices are likely to rise. I agree that tight oil output will peak, but you seem to be predicting a peak in 2020. Though you have not really made a specific prediction, just claimed it would go “kaput”. Care to clarify your position?
My best guess for US tight oil output in a scenario where oil prices follow the EIA’s AEO 2019 reference oil price scenario is below.
It does seem awfully odd that Exxon would pour so much money into shale but pass on Brazilian pre-salt. Not what I would have expected.
Perhaps Exxon feel they have enough exposure to deep water with their Guyana bonanza.
Good point.
IEA Nov 15 OMR just released
https://www.iea.org/oilmarketreport/
Non-OPEC output growth is set to increase from 1.8 mb/d this year to 2.3 mb/d in 2020.
Info Graphic of Global Oil Discoveries. Size does matter.
https://peakoil.com/geology/mapped-the-worlds-biggest-oil-discoveries-since-1868
Good picture.
That California oil has no business being there with millions of years of earthquakes cracking the cap rock.
https://www.bloomberg.com/news/articles/2019-11-15/why-even-saudi-aramco-is-now-talking-about-peak-oil-quicktake
Paragraph 2 of the Bloomberg article contradicts what many here are predicting regarding future oil supplies.
As for demand, that one is tougher for me because I live in a rural area that hasn’t taken to EV yet. Best I can tell in a county of 19,000, we had one EV in 2012, and added another last year. No public charging available here yet.
Per inside EV, four of the five highest months for EV sales were in 2018. June 2019 was the fifth, with data thru September.
IEA sees oil demand dramatically flattening in 2025, which isn’t all that far away. I need to read the specifics as to how they arrive at that.
I have read that the number of SUV on the road worldwide has increased from 35 million in 2010 to 200 million in 2018. So maybe if that trend changes, it will make a major difference?
SS for reasons unknown there has been no formal report of car sales for the month of October. That seems to include EVs. Such data typically releases the first week of the month. But not this month.
For September, August, and July global EV sales declined from the equivalent month of the previous year. That is three consecutive months. And we don’t have data on October.
All car sales declined for at least one of those months, but the amount of % decline was significantly less than the EV sales decline.
This can happen, btw. It’s a bit typical for a niche product. When sales fill the niche, and the niche wasn’t that big to begin with, the shark fin concept applies just as it does to oil.
I just did some IEA reading. They say they see about 125 million EV on the road by 2030, up from 3 million in 2018.
They also predict total vehicles on the road to increase from 1.2 billion in 2018 to 2 billion in 2035.
So, per IEA there will still be a substantial increase in the number of FF powered vehicles on the road between 2018 and 2035, it would appear.
So not sure how total liquids demand will peak at about 106 million given those predictions.
Shallow sand,
By 2030 EVs and plugin hybrids are likely to be 50% of new personal vehicle sales and by 2035 close to 100% under a more reasonable growth scenario. About 700 million of personal vehicles on the road my be EVs and plugins by 2035 and the 1.3 billion other vehicles will be older vehicles that are driven fewer miles. Also by 2035 Autonomous Vehicles may be approved and the prediction of 2 billion personal vehicles may be too many. With the possibility of robotaxis travelling 3 or four times as many miles as vehicles today, the number of vehicles needed may be cut down by a factor of 3 so perhaps there will be only 700 vehicles driven and perhaps 90% of those personal vehicles would be EVs and plugin hybrids.
The IEA’s prediction of the transition from oil to other forms of energy is exceedingly conservative.
In the Bloomberg piece they talk about “running out” of oil. That is so wrong, peak oil is about peak output, full stop.
Surely an oil producer can appreciate the fact that the oil resource is not unlimited as they deal with this fact every day. Wells peak and decline, as do fields, nations, regions, and the World.
In a sense one could pose the problem as follows:
Assume there is some maximum price M above which the oil price cannot go. At an oil price equal to M there is some maximum oil output P that is profitable to produce for World producers. Both M and P are unknown and P occurs at some unknown future time T.
That is all there really is to peak oil.
I just ain’t buying it. Everyone is talking about peak demand and saying we have enough oil for many decades. Peak supply is a non-issue while peak demand is something to really worry about. Bullshit! Peak supply will be here long before peak demand.
OPEC is predicting non-OPEC will peak in 2025. Is everyone buying that? If so, then who is buying their claim that OPEC will not peak before 2040? OPEC’s performance for the last 15 years has been lackluster. Their 12 month trailing average is now below where it was in 2005. Why does anyone now think they will be the savior of the world as far as oil supplies are concerned?
“Why does anyone now think they will be the savior of the world as far as oil supplies are concerned?”
Its more comforting then thinking about the alternative perhaps? (same goes for the peak demand bs)
Ron Wrote: “Peak supply will be here long before peak demand.”
Peak supply will just mean mandatory peak demand 🙂
We are way over due for a recession. When it does begin demand for Oil will likely be below supply for a considerable period. The 2008 recession took about 7 to 8 years for a quasi full recovery. The next recession will likely take just a long if not much longer.
The Oil crisis started around 2000 with oil prices increased from about $12\bbl to about $30\bbl, Since then the US has gone on overthrowing resource nations, either with direct occupation or indirectly.
Peak production is peak production.
What’s Warren know?
https://seekingalpha.com/news/3519874-berkshire-trims-well-fargo-buys-occidental-petroleum
Hey, after people become aware that oil production is peaking, or has peaked, oil prices will go sky-high. Oil companies will make huge profits. So perhaps Warren knows what he is doing.
Ron,
I agree peak supply arrives before peak demand, then as the World comes to the realization that only expensive to produce oil is available, prices will need to rise both to destroy demand and to entice oil companies to produce the high cost oil.
I expect a peak for World C+C output of 85 to 87 Mb/d from 2023 to 2027 and think Brent oil price reaches a minimum of $130/bo in 2019$ by Dec 2030.
Dennis,
Though I believe the peak will be prior to your estimation, I do not find it unreasonable. You may very well be correct.
Ron,
Thanks.
Note that my “medium” scenario assumes a World URR for C+C of 3200 Gb, a lower scenario (such as URR=3000 Gb for World C+C) would match your plateau scenario from 2018 to 2023(?) quite nicely, so your scenario is also reasonable and in my view might also prove to be correct.
In the past my scenarios have proven to be too conservative (low), so there is some significant chance that either of our scenarios could miss the mark on the low side. My guess is that there is only a 5% probability the World C+C URR will be more than 3500 Gb (my “high” scenario) and perhaps a 5% probability that World C+C URR will be less than my “low” scenario of 2900 Gb.
“Oil companies will make huge profits. So perhaps Warren knows what he is doing.”
Or gov’ts will start nationalizing energy companies to contain energy costs or control who gets it.
I have doubts that we will see oil prices go sky-high and remain there, as the high prices will cause a demand destruction and lead to a long term economic decline. Already we can see cracks as vehicle loans durations have continuely creep up, and loan deliquencies are rising again. The Consumer debt load is slowly becoming a burden and likely impact Oil demand.
At best currencies will devalue quicker as central banks start printing a lot of money and force more negative interest rates. Once People lose faith devaluaiton will accelerate as as in every country that printing currency to pay its bills.
“Or gov’ts will start nationalizing energy companies to contain energy costs or control who gets it.”
Says as Saudi Aramco is going through an IPO. Yet they are “paring back their ambitions” as investment interest has been tepid. Is this just one last chance for a grift ?
https://www.reuters.com/article/us-saudi-aramco-ipo-banks/aramco-ipo-banks-face-pared-payday-of-90-million-or-less-sources-idUSKBN1XT1PJ
I’m pretty sure Warren had nothing to do with this. He has a portfolio management team that control day-to-day maneuverings. This item was too small to be on his radar screen.
Berkshire faces the same problem that most mutual funds face. Variance capture of a reasonably large size portfolio is inevitably going to be of the market as a whole. Especially post 2009 when correlations are so high.
Everything goes up. Everything goes down. The tide and boats are very powerfully connected nowadays, even more so than when the saying first emerged.
EIA STEO forecasts US L48 (exclude GoM) crude oil peak at 10.87 mbd on October 2020.
https://www.eia.gov/outlooks/steo/data/browser/
EIA AEO 2019 Reference case US L48 onshore output. Peak in 2031 at 12.16 Mb/d.
Both graphs agree that after 2021 production looks relatively flat – apparently after that date, fracking can’t compensate for conventional decline anymore.
The AEO 2019 reference scenario has flat oil prices from 2019 to 2021 and perhaps they expect the completion rate in the tight oil plays to fall as a result and then recover after 2022 as oil prices rise.
Chart below has US wellhead price in 2018$/bo for AEO 2019 reference case.
“The only function of economic forecasting is to make astrology look respectable.”
– John Kenneth Galbraith
Hightrekker,
The reference oil price scenario is simply an assumption about the future, they also produce low oil price and high oil price scenarios.
Anybody who thinks any forecast of the future is accurate just is unfamiliar with statistics.
Number of future scenarios is infinite. Odds that any single scenario will be correct is zero. It really is that simple.
The point of the price scenario chart is to show that the price assumption might affect the oil output scenario (which also has zero chance of being realized.)
Oil price scenarios for Brent Crude for AEO 2019
For 3 price scenarios we have these L48 onshore output scenarios for AEO 2019
tight oil for AEO 2019 for low, high, and reference oil price scenarios.
Low price scenario has peak in 2021 at 8 Mb/d, reference scenario 10.3 Mb/d in 2031, and high price scenario 13 Mb/d in 2024.
As always, none of these scenarios is likely to be correct, but there might be a 90% probability that the future output path might be bounded by the low and high scenarios.
Dennis-
I’m on your side for most things.
US production hit a new all time high. They might reach 13 mb/d this year
https://www.eia.gov/dnav/pet/hist/LeafHandler.ashx?n=PET&s=WCRFPUS2&f=W
OPEC should be happy that US shale oil is slowing. The Nov EIA DPR was just released and EIA estimates that Dec 2019 production from new wells is 627 kbd, which is only 48 kbd greater than Dec 2019 legacy decline of 579 kbd.
https://www.eia.gov/petroleum/drilling/
Here is the corresponding forecast to Dec 2022.
I think that chart just might be spot on. Of course production will not be that smooth but it will very likely track the average. And I think it likely has the peak within a month or two.
I disagree with Ron on Tony’s chart, potentially it could be right in the short term if oil prices remain low and completion rate remains flat (or decreases). Longer term I expect tight oil output will rise.
The scenario below has the Permian completion rate flat through the end of 2020 and then increasing from late 2020 to late 2025, oil prices remain at $60/bo for Brent in 2018$ through 2023 and then rise to $70/bo by 2030 and remain at that level until 2050 then decline to $40/bo by 2071 and remain at that level to 2079 (end of scenario).
URR for tight oil in this low price scenario is 58 Gb, peak is 9.2 Mb/d in 2026, this would be about 10.1 Mb/d for the 7 DPR regions assuming non-tight C+C output remains at the 2018/2019 level (900 kb/d) in the 7 DPR regions.
Dennis, you have Permian production doubling between 2019 and 2026. I find that prediction outrageously optimistic. And I do not mean just wildly optimistic but outrageously optimistic.
Nuff said. That means I have nothing more to say on that subject.
Ron,
EIA estimate (tight oil production estimate by play) for Sept 2019 is 3811 kb/d for Permian basin tight oil. The scenario has Permian tight oil output increasing to 6800 kb/d by Sept 2026, so an average annual increase of 428 kb/d over 7 years. Over the previous 7 years the annual increase was 471 kb/d. The mean TRR estimate by the USGS is 74 Gb for the Permian basin, this scenario has a URR for the Permian of 34 Gb, about 46% of the mean TRR.
Many would consider this wildly pessimistic, but you favor hyperbole. 🙂
Do you believe oil prices are likely to remain at $70/b (in 2018$) or lower for Brent oil for the foreseeable future?
A more realistic scenario (such as AEO 2019 reference scenario) would result in a URR for the Permian basin of about 60 Gb, rather than the very conservative URR of 34 Gb presented above.
Deenis or Dennis?
mistyped Dennis
In Aug 2017 Permian tight oil output was 1862 kb/d and in Aug 2019 it was 3725 kb/d (2 times higher over a 24 month period.)
The average annual increase over those 2 years was 931.5 kb/d, the scenario I have outlined has output increasing at a rate that is only 428 kb/d per year or less than half the rate of increase of the past two years.
You may be correct that it is too optimistic for the oil price scenario presented (which in my view is unrealistically low.)
Scenario below has a lower maximum completion rate and in my view is probably too conservative, especially for a more reasonable oil price scenario. Reminder that the oil price scenario used has oil prices that remain at $70/b in 2018$ or lower from 2019 to 2079. URR for this scenario is 59 Gb of US tight oil output from 2010 to 2052.
Scenario referred to in comment above, click on image for larger view.
Dennis, does your model assume that future wells will produce the same amount of oil as current wells?
Frugal,
No I assume the average new well estimated ultimate recovery (EUR) decreases over time. For my medium case I use the USGS mean TRR estimate of 74 Gb with about 250,000 total wells completed to estimate the rate of decrease in EUR (depends on completion rate, more wells means faster decrease and vice versa).
newer scenario with flat completion rate of about 495 new wells per month over most of the scenario (straight line part of the curve) with rapid decrease in the completion rate at the tail end of the scenario. Decrease in EUR starts in Jan 2019 for this scenario, where the previous chart had the decrease start in Jan 2023 and had a completion rate that increases to 2026 and then declines after 2027.
So if I understand you correctly, your assumption is that the more wells we complete today, the worse the productivity will be of future wells. In other words, the more Tier 1 wells that are completed today, the fewer Tier 1 wells there will be left for future completions.
Frugal,
Pretty much. My thinking is that the distinction between tier 1 and tier 2 is some arbitrary average EUR target, in reality there is a statistical spread of new well EUR in any given area. Starting in the core area (tier 1) as the core area (aka sweet spot) runs out of room for new wells, the drilling will gradually move to areas farther from the core and the average new well EUR will gradually decrease.
Essentially there are a fixed number of spaces for wells and the better (more productive) spaces tend to be drilled first (or that is the aim).
Let’s assume there are 100,000 total wells that are drilled to get a TRR of 25 Gb and that 20,000 wells have been drilled when EUR starts to decrease. Let’s also assume for simplicity that the average EUR of all 20,000 wells drilled to date is 300 kb and that is also the current new well EUR.
To arrive at a TRR of 25 Gb in this scenario if we assume 300 new wells are drilled each month for 266 months and 200 wells in month 267 the final wells drilled would have an EUR that is 0.615713 of the EUR currently (300 kb).
in excel x=power(0.615713,1/80000) and for any month n after the decrease begins the cumulative wells completed minus 20000 would be y and the EUR for month n would be power(x,y) times 300. This will work pretty closely for a general case where new wells added each month gradually rises and then falls. It is just a simple approximation which may not reflect reality (which is likely to be far more complex).
Link to spreadsheet with example if you are more interested.
https://drive.google.com/file/d/1ttC5JnwQQ5yOiInBFQjCH7OUR110qWYg/view?usp=sharing
Dennis, thank you for your detailed reply. Now I understand your model better!
Frugal,
You’re welcome. The spreadsheet hopefully makes things clearer, though it is short on explanations.
Ron,
The latest shaleprofile blog for Permian is out. Looks like zero growth.
https://shaleprofile.com/2019/11/21/permian-update-through-august-2019/
We cannot tell yet if this is the peak, but I would say it supports your view.
Interesting. Enno has the Permian up 8,000 bpd between May and August. EIA’s DPR has the Permian up 136,973 bpd between May and August. That’s a difference of almost 129,000 barrels per day.
Typical.
Ron,
Read Enno’s post, he expects 3.7 to 3.8 Mb/d after revisions, let’s call it 3750 kb/d, May was 3526 kb/d so a difference of 224 kb/d from May to August 2019. The EIA’s tight oil production estimates by play (the only estimate worth paying attention to for tight oil data, except for shaleprofile, which is the best except most recent few months) has a difference of 167 kb/d from May 2019 to August 2019 (slightly less than the shale profile estimate.)
So DPR might be bad, but I have always ignored the DPR model.
Ron is quite skeptical of the Permian model. Below is a simple model that gives output from Oct 2019 to the future. Month 1 in the model is Oct 2019, it only runs for 129 months to June 2030. Beyond month 129 no new wells can be added, output after month 129 shows what would occur to output if no new wells were completed after June 2030.
Row 4 of the spreadsheet can be changed to any value desired to create alternative scenarios. The one in the file is my medium scenario with oil prices that reach $90/b by 2027 (in 2018$).
File at link below.
https://drive.google.com/file/d/1H6M2S5KLZJ8_nf1R4R2e3sp69x7KVWAk/view?usp=sharing
note that row 6 adjusts the number of wells to account for lower new well EUR that starts to occur in Jan 2019, so if the EUR has decreased to 95% of the Dec 2018 average new well EUR and 500 new wells are completed we adjust the wells to 500*0.95=475 wells (with the original EUR from Dec 2018). This was to make the spreadsheet simpler.
People can use the model to create outrageously pessimistic scenarios. 🙂
Oil rigs are falling, crack spreads are falling, but new wells will still be rising like a rocket. What am I missing here?
Oh, I forgot to mention, those retired crack spreads are being sold for scrap… whatever that means.
Ron,
As to rising like a rocket, the Permian completion rate rose from 188 in mid 2016 to 427 in mid 2018, so an average annual rate of increase in the completion rate of 119.5 wells per month. The scenario presented above has an average annual increase in the completion rate of 37 wells (an increase of about 3 wells per month, 232 wells over 75 months). This is a rate of increase that is 3 times lower than over the 2016 to 2018 period, so a very slow rocket. 🙂
Do you assert that oil prices will remain at $60/bo in 2018$ for Brent long term?
I have never heard you make such an assertion. What do you imagine might happen to horizontal oil rig and frac spread counts when oil prices rise to $80/bo (where they were in mid 2018)?
If one expects low oil prices long term the scenario would be different.
Let’s presume Brent oil prices remain low for the next 3 years and then gradually rise to $85/b by 2029 (in 2018$). In that case we might see something like the scenario below for Permian basin. As I suggested anyone can download the spreadsheet and create their own scenario. The number of possible future scenarios is infinite.
Tony,
The link below is to a spreadsheet for my model for US tight oil, you can play with the Permian part of the model (non-Permian is 4 separate models combined which I include as a row for “non-Permian” output assuming a medium oil price scenario where oil prices rise from $60/b to 90/b (in 2018$) from Oct 2019 to Jan 2027 and mean USGS TRR estimates where they exist (had to punt on Niobrara and other basins as there is little TRR info) along with economic assumptions on wells costs, royalty and taxes, LOE, and transport cost along with the oil price assumptions. A 10% annual discount rate is assumed and a discounted cash flow(DCF) analysis determines if a new well will be completed based on the assumed future oil prices (NPV>well cost). NPV is net present value based on DCF.
Note that the DPR estimate is roughly 935 kb/d higher than the tight oil production estimates by play (most recent 12 month differential) so you would need to add this amount to my model to make it comparable with yours.
https://drive.google.com/file/d/1JY-Ysy_uo17lN7HywJvil2x7YVN0VV7p/view?usp=sharing
I attempted to create a scenario similar to yours through 2022 and then assumed increasing oil prices would lead to higher completion rates in the Permian basin starting in October 2022.
Permian model completion rate on right axis of chart below (used in scenario presented above).
https://oilprice.com/Energy/Energy-General/The-Race-To-Develop-A-50-Billion-Barrel-Oilfield.amp.html
This is about the new Iranian oil field. The suggestion is China will develop it.
It’s just a mess to read such an article when it is not really clear what is recoverable oil and what is oil in place. Heavy oil gives around 20% recoverable oil out of oil in place, give or take with a lot of variables. And the Chinese are in a lot of conflicts I suspect when it comes to past development contracts and also oil imports (do I dare mention smuggling past sanctions?).
It’s a great fog around oil markets (EIA/IEA reports with ? marks, oil transportation a mess with sanctions and conflicting articles and the demand crises due to trade war wiggling every second week it seems primarily affecting only oil. It will be a win first and a loose therafter it seems. It would not be good for Trump’s property prices in the end probably. I see him as the main architect behind the anti oil sentiment at the moment. Together with the left wing climate change movement (sponsored by European countries) and OPEC+ just playing along until it breaks. And break it will; both oil markets and the economy in general.
Johan Sverdrup now produces above 300.000 boepd ahead of the new fast track schedule, this was in q3 presentations presented to happen by end of November – Equinor press release.
Perhaps 400K then before new year, and revising that 440 by mid summer.
Attention Kmart shoppers.
https://www.zerohedge.com/energy/billionaires-are-licking-their-chops-over-distressed-us-oil-and-gas-assets
The total number of DUCs for the 5 US shale oil regions has dropped below 7,000 in Oct 2019. However, oil production keeps increasing. This divergence hasn’t happened since Jan 2014. I’m assuming that oil companies are high grading the selection of DUCs and choosing tier 1 DUCs.
If it’s true that number of tier 1 DUCs is becoming smaller then tier 2 DUCs may have to be used which would add much less oil production. Perhaps it’s possible that some tier 2 DUCs are not economically viable until oil prices are higher. If this is the case then many DUCs may stay uncompleted for some time and oil production increases from these five regions could stall within a few months.
Does anyone know the split of DUCS into tiers 1, 2 and 3?
2019 Q3 Market Commentary
http://blog.gorozen.com/blog/declining-tier-1-acreage-and-slowing-us-shale-oil-production
Some quotes from this link
“Over the last five years, the E&P industry has shifted significantly away from drilling their less productive Tier 2 acreage in favor of drilling their more productive Tier 1 acreage. Since drilling a Tier 1 well is nearly 100% more productive than a Tier 2 well, the industry has created the illusion of ever-improving productivity growth by narrowing their focus to only their best prospects. If our research is correct, then future increases in shale drilling productivity will be more a function of continued “high-grading” and less a function of ever-changing drilling and completion techniques.”
“We concluded that both the Eagle Ford and Bakken shales were quickly running out of Tier 1 acreage and that production growth from these plays was set to significantly disappoint in the coming years. We also concluded that while the Permian basin had more remaining Tier 1 inventory than the other two, it would also begin to experience the first signs of exhaustion sooner than most people expected.”
“In our view, the next twelve months will be a critical test of the US oil shales. Our models
tell us the remaining inventory of prime Tier 1 drilling locations is much less than widely
believed.”
This Deloitte study differentiates between tier 1 and tier 2/3.
https://www2.deloitte.com/us/en/insights/industry/oil-and-gas/us-shale-revolution-playbook/introduction-shale-performance-productivity.html
The Deloitte chart below used well data from the Enverus Drillinginfo database.
https://www.enverus.com/industry/exploration-and-production/
Tony, you must be getting your data from the DPR? Their September data is off by a country mile.
Ron DPR includes North Dakota and Montana, we don’t really now what happened in Montana as their data is not as timely as North Dakota, of course nobody knows how long a country mile is so I suppose your statement is accurate. 🙂
Dennis, as far as the month to month change in the Bakken goes, we can safely ignore Montana. They were at 59 k/bpd in August, down from 102 k/bpd in September of 2006 and 69 k/bpd in April 2019. Montana is clearly in decline. Their change is, on average, about 1 k/bpd per month.
The EIA DPR has the Bakken up by 7,660 bpd in September. North Dakota says their Bakken production was down by 34,661 bpd in September. That’s a difference of 42,271 bpd. Montana, if there is any change at all, will likely also be down in September. So that EIA’s Bakken error could be 43 k/bpd instead of 42 k/bpd. But even if Montana is up 1 k/bpd, that still means Montana is pretty much a non-player here. Their input is not enough to make a difference worth mentioning.
I have no idea how many barrels represents a country mile either but I would guess that an error of 42,271 barrels per day is way, way over a country mile. I would guess about 5 country miles. 😉
Ron,
the most recent month’s estimates are often in error for EIA data, I ignore DPR and focus on tight oil production estimates by play. Also month to month changes are not really that important in my view. If we consider the 12 month change from Sept 2018 to Sept 2019, NDIC has Bakken up by 87 kb/d and EIA (tight oil production estimates by play) has Bakken up by 97 kb/d. So I would put the difference at 10 kb/d an error of about 0.7%. Country miles must be quite short in your neighborhood. 🙂
https://oilprice.com/Energy/Energy-General/This-Underdog-Could-Soon-Become-The-Worlds-Largest-Oil-Producer.html
Attached is the production info from this mornings EIA inventory report for the lower 48 states. Total US production is reported to be 12,800 kb/d, a new high, while the lower 48 is producing 12,300 kb/d, also a new high. Last week, the EIA indicated that they had to revise their weekly production data based on what was being reported in the STEO. We will have to wait for confirmation of the accuracy of this latest data till the monthly EIA data is released.
North Dakota has posted its September production data. Production is down by 34.6 kb/d from August to 1,389,211 b/d.
All North Dakota was down 37,200 barrels per day in September to 1,443,275 barrels per day. Not kb/d .. 😉
Ron
Thanks for the catch. The chart only shows Bakken production. As you note, your numbers are for all North Dakota.
Pretty sure past occasions like this involved weather. Not this time.
Shaleprofile has Bakken down 35.2kbd to 1,402,326 bd in Sep 2019
https://shaleprofile.com/2019/11/11/north-dakota-update-through-september-2019/
Tony
A few wells here, a few wells there???
The EIA’s Drilling Productivity Report has the Bakken up by 7,660 Barrels per day in September. That just shows how good their estimates are.
Ron, the tight oil production estimates by play also has Bakken output up by 8000 barrels per day or 8 kb/d, that includes output from both North Dakota and Montana. No estimates are perfect. If we account for Montana’s tight oil output (about 33 kb/d), the EIA had too low an estimate in August by about 20 kb/d and too high an estimate in Sept by about 13 kb/d. This is unsurprising.
XOM credit rating outlook was downgraded yesterday due to shale cash burn.
This downgrade is serious because Moody’s sends a strong message to all oil and gas investors to be cautious.
The company’s “high level of growth capital investments cannot be funded with operating cash flow and asset sales at projected levels given Exxon Mobil’s substantial dividend payout,” Moody’s says.
https://seekingalpha.com/news/3520796-exxons-credit-rating-outlook-cut-negative-moody-s
Putin highlights Barbaric Shale eco impact.
https://www.cnbc.com/2019/11/20/russias-putin-says-shale-oil-technologies-are-barbaric.html
Just an FYI. Russia’s male life expectancy is 64.7. Vladimir Putin is 67. I have no doubt they have a succession plan for a younger man who is similarly patriotic.
There have been studies attributing the 64.7 number to drinking. There have been others saying no, it’s something else unknown.
Female number is 76.
It’s not just health issues, there’s also an inordinate number of fatal accidents in Russia, especially on the highways.
2 men were steam cooked to death after their vehicle fell into a fissure caused by leaky pipes. Penza, Russia November 19, 2019
https://www.reddit.com/r/ANormalDayInRussia/comments/dyvxln/2_men_were_steam_cooked_to_death_after_their/
(not too gruesome, can’t see much)
Venezuela to back its petro crypto with 30M barrels of oil as opposed to 5B barrels planned earlier
The 30-million barrels figure is drastically down from 5 billion barrels announced at the time of the petro launch in February 2018. A Reuters special report late last year found that there is no proper infrastructure to get oil from those reserves.
Dennis,
In this comment you reference a graphic that shows USA LTO pushing just shy of 8 million a day right about now.
http://peakoilbarrel.com/opec-production-data-for-october-2019/#comment-691808
However, Enno has USA LTO at about 7 million a day as of July 2019.
https://shaleprofile.com/2019/11/04/us-update-through-july-2019/
I’m curious as to know where the approx almost 1 million/day difference is coming from; is it presumed growth in USA LTO production since July 2019, or is it an older forecast that’s now off by approx 14%?
Survivalist
The same question seems to apply to the difference between Shaleprofile and the DPR. Enno shows Permian August production to be 3,534,331 b/d while the DPR is claiming 4,527,700 b/d
I just remembered, the DPR includes conventional oil within the Permian.
Ovi,
EIA’s tight oil production estimates by play (page below)
https://www.eia.gov/petroleum/data.php
has Permian output in August at 3725 kb/d, the 190 kb/d difference comes from both incomplete data (less of a problem lately) and also because Enno’s data includes only output from horizontal tight oil wells, the EIA includes output from both horizontal and vertical wells which may account for the difference.
From the July 2019 Permian report
https://shaleprofile.com/2019/10/28/permian-update-through-july-2019/
These interactive presentations contain the latest oil & gas production data from all 23,382 horizontal wells in the Permian (Texas & New Mexico) that started producing from 2008/2009 onward, through July 2019.
Ovi,
From Enno’s post:
Preliminary data from the state agencies already has August production at a record high (see chart above). After revisions, especially for New Mexico, I expect that August production will be revised upward to about 3.7-3.8 million bo/d.
EIA estimates 3798 kb/d for Permian output in August 2019. Note that Enno also only includes output from horizontal oil wells, but EIA includes both horizontal and vertical wells.
In any case, the two estimates are about the same after the expected revisions at shale profile.
Enno does not include output from vertical tight oil wells. In July EIA had tight oil output at 7700 kb/d, if we look back to July 2018 the difference between shale profile and EIA is about 400 kb/d, shale profile also excludes Oklahoma, Ohio, and West Virginia. So the 400 kb/d difference in July 2017 and July 2018 is due to vertical well tight oil plus 3 states output that is not included. In addition the shaleprofile data gets revised higher for the most recent months as data becomes more complete.
Currently July 2018 tight oil is 6007 kb/d according to shaleprofile, but in Nov 2018 the July 2018 tight oil output was reported as 5592 kb/d, about 7% lower.
The best recent data for US tight oil output at link below
https://www.eia.gov/energyexplained/oil-and-petroleum-products/data/US-tight-oil-production.xlsx
New shale report released
https://ieefa.org/wp-content/uploads/2019/11/US-Fracking-Sector-Spills-More-Red-Ink-Again.pdf
Related chart
when the shale companies lost 1,26 billion USD in 3Q 2019 and they mostely used DUCS to keep growth in shale oil than it should be obvious they cant afford to drill many new wells when the DUCS that is still profittable are used if WTI continues in the 50 usd range.
The DUC usage can be an statistical artifact of a strong reduced production planning.
When a well is drilled, and the drilling paid, it’s silly not to frack it. Not fracking it only is recommended when during drilling something got horribly wrong – destroyed pipe, much worse rock than thought or oil price dropped to 20$.
A drilled well is in average 4 month long a DUC (number I read in the forum here) until it produces oil.
So when you complete 100 wells a month, you have 400 DUCs. When you consider to half this rate, you stop drilling now, but continue completing 4 months long finishing the old wells. In this time the DUC count will go from 400 to 200, since only 50 wells/month are drilled now.
That’s the phase we are in, my numbers are more drastic to show the effect. The declining DUC count shows the production decline in the future when drilling and finishing is again in phase.
The other way around (oil shoots up to 100$) you’ll see an increasing DUC count first, before production kicks in.
The below chart is the Texas corrected data supplied by Dean Fantizzini. I am not sure what it means. Perhaps Dennis can explain it. The last data point is September 2019.
If we look at the 12 month vintage data we get the following compared to EIA, the all data estimate does not give very reliable results especially for recent months and the “last month data vintage estimate” that Dr Fantazzini prefers is quite noisy bouncing far above and far below the EIA estimate from month to month.
Ron’s chart is for crude only, he should have used the oil + condensate sheet in Dr Fantazzini’s spreadsheet.
According the EIA weekly the oil production in US is now 12.8 mbpd and guess it suppose to reach 13 mbpd before year end. Most of this increase is from Shale. Lastest news related to economy in US shale..
https://www.rigzone.com/news/wire/lack_of_credit_is_latest_blow_to_shale_industry-22-nov-2019-160408-article/
Since Exxon is planning to sell assets wurth 25 bill usd they might borrow other some money as I can see they might neef…
According to the EIA’s Drilling Productivity Report total shale production, from all seven basins, was up 111,053 barrels per day in September. I am betting they were off by about 100,000 barrels per day. Are there any other bets? Anyone? Bueller? Bueller? Coyne? 😉
Permian ………… 85,573
Niobrara ………… 12,417
Haynesville ……….. 102
Eagle Ford …….. -3,775
Bakken ………….. 7,660
Appalachia …….. 4,031
Anadarko ………. 5,045
Sum ……………. 111,053
Ron,
I ignore the DPR, so perhaps you will be correct.
The EIA’s tight oil production estimates by play (page below), that was released in October (a new estimate may be released today) had Sept output at 7910 kb/d, 108 kb/d higher than August 2019 and 929 kb/d higher than Sept 2018, again month to month changes are of little interest to me. The 13 month trend is an annual rate of increase of 826 kb/d, that is what is important in my view.
https://www.eia.gov/petroleum/data.php
The trend for the past 8 months has been an annual rate of increase of 1090 kb/d for US tight oil output, about 90 kb/d increase each month on average over those 8 months (Feb 2019 to Sept 2019).
New tight oil estimates are out. First number is last months estimate and second is new estimate from Oct 2018 to Sept 2019 all in kb/d. For October the estimate is 8108 kb/d, this most recent month will likely be revised.
Oct, Nov
7219, 7226
7352, 7364
7247, 7250
7233, 7261
7362, 7394
7486, 7517
7537, 7595
7577, 7658
7704, 7758
7802, 7894
7910, 7964
Estimates at “tight oil production estimates by play” at page linked below
https://www.eia.gov/petroleum/data.php#crude
Chart for US tight oil and Permian tight oil.
Below is a chart that compares the production rate for the Permian for 2018 and 2019. A version of this chart was posted a few months back that showed the growth in Permian monthly production was close to 60 kb/d/mth. This latest chart, updated to October, shows how the growth has been increasing since July. While average increase since January is 72 kb/d/mth, the last four months starting in July have been increasing at a rate of 95 kb/d/mth, which is the same as all of 2019. I have seen articles which have stated that year end production in Texas does speed up.
What is perplexing though is the difference between the EIA Permian data and Enno’s Shale profile chart updated to August. I have pasted a small part of his chart in the lower right of the chart. It shows no growth since May. I understand there is a delay in reporting. Unfortunately I do not have an earlier version to see how much May may have increased.
Ovi,
Enno has archives at his blog. When May was first reported at shaleprofile for Permian it was 3340 kb/d.
https://shaleprofile.com/2019/08/29/permian-update-through-may-2019/
Now it is 3526 kb/d.
As I have pointed out, Enno says after revisions he expects Aug 2019 to be 3700 to 3800 kb/d, not that different from EIA’s estimate. Also remember that shale profile only reports horizontal well output.
Dennis
Thanks. Didn’t realize Enno had archives.
see right column of blog.
Exxon plans to increase their production from Permian to 1 mbpd within 2024.
Will be interested to follow with their ballance sheet, there might be some red inc…
https://www.upstreamonline.com/shale/exxonmobil-embraces-permians-potential/2-1-708001
My forecast/guess for 7 US shale regions production shows a peak in Jan 2021 and an inflection point in Sep 2018. This oil also includes some conventional oil. Oil production growth was higher before the inflection point. Growth has slowed mainly because production from higher producing wells has slowed. Some refer to this slowing as a reduction in available tier 1 acreage wells and possible the parent child effect.
Shaleprofile.com has data on higher producing wells if you selection “show production by” and choose “production level”. For July 2019 shaleprofile has 1,026 wells producing over 800 bd. Of these, 620 were in the Permian, 239 North Dakota, 154 Eagle Ford and 13 other. The next chart also shows Sep 2018 as an inflection point. I have also estimated no growth going forward by assuming a 7% future uplift to allow for new wells being added to shaleprofile for the month of Aug 2019. The 7% uplift was taken from one of Dennis Coyne’s posts.
This chart shows the sudden growth slowdown in Sep 2018 for large > 800bd shale oil wells.
Tony,
An alternative is to focus on the output of the average well.
https://shaleprofile.com/2019/11/04/us-update-through-july-2019/
From well quality tab we see average well has been increasing in productivity through 2018, in 2019 so far, the average well looks similar to 2018.
Dennis,
Here is monthly average for you. Permian shows some flattening since Dec 2018.
Tony,
Sorry I was not clear. By average, I mean the average output of all wells completed, you have chosen to focus only on high output wells, which is a small percentage of the overall wells completed.
Output is equal to average well output times the number of producing wells. For that reason I focus on the average well profile (see chart from shaleprofile.com). Though I actually do separate models for Permian, ND Bakken, Eagle Ford, Niobrara, and “other US tight oil”. Since Dec 2018, 88.5% of the increase in US tight oil has been from the Permian basin so I tend to focus on the Permian basin.
Tony,
Not really a big change in rate of growth based on EIA data (tight oil production estimates by play) for Jan 2017 to October 2019.
Tony ,thanks for this exelent graph. The situation in shale resent year have been a gradualy change from borrow funded growth to profit funded growth as capital market , loan market is almost closed and is getting wurst. The increase we have seen in 2019 is mostely do to the advantages and cost savings of DUCs that will come to an end at least the profittable once. In my mind if it not have been because Exxon, Chevron use of their capital base to ramp up production in Permian wich they have comments is highly profittable even WTI in the 50 usd range even there is no sign of that profit in their ballance sheet. The whole future shale production is in the hands of the majours as they still have asset to sell where the capital will be invested in more wells and infrastructure. Exxon alone plan to sell asset wurth 25 billion dollars , if this is done in 2020, 2021 and 10 billion usd are invested in permian, infrastructure how many wells could be added , and what production could be added? They have as goal to produce 1 mbpd within 4 years. Would this impact your graph?
As we often says from the past history you might predict the future. Do we have similar situation in the past , what happened? Yes , there are. For some years ago Statoil now Equinor invested huge amount in EF , this was important to assure they could also take part in the shale revolution. I have read they invested 1 billion dollar and after a long prosess they finaly manage to sell it for about 1/3 of what it was bought, adding the losses and investment the losses are more than 1,5 bill. usd. If Exxon fails and are not able to earn money in US shale that will be dramatical and impact your graph, another issue is if Exxon admit shale is far from profittable and only get wurst as the best rock sourse is drilled Chevron might follow. The depth of Exxon has already been degraded, it means interest cost is increaseing as a result of this risk. EIA ,Rystad believes in the majours plan , but I believe the world should prepare for a plan B to prevent an future oil crizes.
What do mean by this Freddy?
“the world should prepare for a plan B to prevent an future oil crizes.” [crisis-American spelling]
Hickory, Freddy’s posts are full of typos. We know this. Give him a break! [on the spelling]. Good question though 🙂
No disrespect intended on that spelling, just a friendly ‘heads up’.
Hickory, sorry for the spelling . I mean if the majours shoild fail in develop a profittable shale buisiness and offshore production have only add something like 1 barrel each 5 used , still declining most fields than simply the only that could add the deflict is Saudi but how much they could add is not certain. You might than have a period where demand is much higher than supply. Very high prices, slow down in world economy. I understand there is sweet spots, Tiere 1 , 2 , 3 grades and perhaps 4. There might be some higher break even prices as the best acres will be used. A plan B should prevent oil price to go above a certen limit to prevent collaps in world economy related to collaps in US shale that might last 6 months or the time it takes to drill new wells when the buisiness become profitable WTI 75 usd acc. to Mark Papa.
Hi Feddy.
Unless I’m mistaken, I don’t believe there is any organized plan B.
China has a plan B.
They call it ‘ Belt and Road Initiative’
Best long term planners of the world- Gives them a direct land route to Iran and Iraq for armored convoy bringing oil by land back to China, and industrial/military ports along the sea routes.
https://chinapower.csis.org/china-belt-and-road-initiative/
https://peakoil.com/forums/viewtopic.php?p=1434369#p1434369
Interesting discussion at PeakOil.com about the potential of the Bazhenov Formation in Russia and Vaca Muerta in Argentina.
Would love some people here to chime in on the chances of these becoming productive.
Rockdoc probably has this right, the economics may not be favorable in Russia or Argentina for the reasons he gives.
Argentina is political problems. But they’re big political problems. If it is valuable enough in price/demand, it can be made to work. There is high confidence it is a big resource. How big is up for debate, but billions of barrels in any case.
Russia has political, financial and logistical problems. Nothing about the American fracking model (which isn’t profitable, mind) works there. The government wants a huge cut, corruption is rampant, the local capital markets can’t raise the money, the country is under sanctions. Who is doing the work in the middle of nowhere? Russia doesn’t have cross-country ground logisitics like the USA or Canada.
If the Russian government had been in a different direction about opening up the country and resources, okay, maybe, lets find out how big this thing is. But they’ve been doing everything possible to relive Cold War autarky.
Gazprom-neft projected shale output from Bazhenov by 2025, and did the projection in Feb 2018.
They projected significant output in 2022-2023, in July of this year. Several wells are already flowing.
Watcher,
Natural gas or crude?
Crude. Two separate articles, second updating previous projection.
Found this on Bazhenov
https://www.reuters.com/article/us-russia-oil-shale-gazpromneft/gazprom-neft-says-bazhenov-shale-oil-output-to-reach-viability-by-2022-2023-idUSKCN1TI0MQ
Looks like 2025 before significant output. The resource is large supposedly about 285 Gb, if oil prices are high enough some of it might be extracted, difficult to guess as costs and taxes are quite high in Russia and corruption is pretty severe, when conventional resources are exhausted then the unconventional oil may be produced, though at some point demand may fall and they will be competing with cheap middle east reserves, much of this resource will remain in the ground, much like a large part of the oil sands resource.
View: Opec+ is on track to hibernate
US oil production growth is slowing. “We are likely to see sharp revisions of non-Opec supply going into 2020, particularly from shale basins in the US,” Opec Secretary-General Mohammad Barkindo said at the Abu Dhabi International Petroleum Exhibition and Conference earlier this month.
I disagree. The second US shale boom may be coming to an end, but that doesn’t mean supply forecasts will be slashed.
That last line is from the article, not from me. 😉 But that is the big debate, both on this blog and around the world. Is the US shale boom about to come to an end or will it go onward and upward for several more years? There is no doubt whatsoever that the shale boom is slowing down. The only question is when will it turn flat then down? I believe it will be sometime in 2020. And I feel extremely confident with that prediction.
And if I am wrong, sometime in early 2021, I will on this blog, say “I wus wrong!” Well, that is if I am still alive. I will be 82 by then. 🙁
Ron,
You will make it to 100 no doubt. Or that is my hope, the 2020 prediction will only be correct if Brent oil price (centered 12 month average) remains at $62/bo or less in 2018$ from now until 2030, in my opinion. If the completion rate in the Permian basin remains at present level (about 495 horizontal oil completions per month) from Oct 2019 to June 2030, we get the scenario below which peaks in 2023.
In my view this scenario is highly unlikely because oil prices are likely to rise and the Permian completion rate will increase.
Forgot chart
If Permian completion rate rises from 2023 to late 2025 by 2 wells per month from 495 to 560 new wells per month, the peak date moves to 2025, peak output is 8735 kb/d for this very conservative scenario, I am skeptical that output would be this low in a scenario where Brent oil prices rise to $80/bo in 2018$ by 2025, the Permian completion rate is likely to rise to at least 700 new wells per month under a reasonable oil price scenario.
The scenario with maximum completion rate of 560 completions per month in Permian basin in chart below.
Alternative scenario with Permian completion rate increasing from 495 to 550 wells per month over 28 months and then from 550 to 730 wells per month over 45 months, peak at 8895 kb/d in 2029.
I suspect that if there is a shortfall of oil available for export [signaled by significantly higher prices] at anytime in the 2020’s,
That China will simple tell the world that it is an eager customer for Iranian oil.
In fact, a preferred customer who will even guarantee safe transit of tankers.
For those who aren’t real big on their history learning, the last time the USA set up an oil embargo blockade against an Asian country with military capability, it encountered a rude awakening called ‘Pearl Harbor’.
Heaven”s sake please do not leave before TSHTF . We need you to guide us thru the S*&&. Too many guides with rose colored glasses who don’t have a f****** idea what is coming our way . Take care and be well . By the way I have a friend with me from Scotland sitting next to me . His name is ^ Johnie Walker^ ;-).
Ron
I agree with your prediction and a key cause for shale oil slowdown is lack of funding.
https://www.worldoil.com/news/2019/11/22/reduced-access-to-credit-making-life-harder-for-shale-operators
Ron, sadly, I am going to have to disagree with you on your call for US shale to begin to decline in 2020. The latest frac spread count is down to 338. As I previously predicted, based on declining frac spreads, I still believe we will see lower 48 onshore production begin to decline in November, 2019. Such decline to be reported with the monthly reports released around 1/31/2020. While the recent bump in weekly info doesn’t help my case, everyone knows weekly EIA info is sketchy. Lower 48 onshore to begin to decline before 2020.
Dc longhorn,
For shale oil to decline now would mean that the red line would have to drop below blue line in chart below. It could happen now. However if monthly legacy decline keeps growing shale oil could peak in 3 months.
Hi Tony, That red line shows some pretty large variations up and down. Frac spreads at the end of June were 456, they fell to 395 by the end of August, and are 338 now.
If you take the drop of 61 spreads to end of August then: 61/456*650=87
Would 87 off your red line bring it under the blue? Looks pretty close to me and spreads keep dropping. You can make a good argument for 2020 but I’m sticking with November, 2019.
Any peak will be temporary. Do you guys expect oil prices will remain low forever? 🙂
If Oil prices never rise above today’s level, you might be correct.
I am highly skeptical of such an oil price scenario.
In short, 2023 to 2027 will be the ultimate peak for US tight oil output. I doubt 2019 or 2020 will be anything but a temporary peak, if you guys are correct short term.
Hi Dennis, as long as rig counts and frac spreads keep dwindling I think supply will continue to decline (after lags). Rig counts and frac spreads will increase after prices go up, or if Wall Street spreads more helicopter money on the patch.
dclonghorn,
I agree.
Dennis,
The dollar index is building support for it’s next leg move up. It’s ok if you don’t believe me just hide somewhere an watch. Price of oil outside the US will absolutely gut economies outside the US in the short to midterm. Oil can stay at today’s prices and still be 30% more expensive to people living outside the US. Keep your eye on the Euro. It’s likely to fall below parity with the dollar over next 5 years. A good 30% devalue against the dollar making price of oil 30% more expensive in dollar terms to anybody that shares the Euro as a currency. Last time i checked Europe as a whole uses a lot of oil. Well shit what if your right and oil goes to $100+ on top of a 30% devalue of the Euro over next 5 years?
I’ll answer that question for you. Europe will have to devalue their currency even further making oil even more expensive or else they blow up. Your going to see some real fucking demand destruction outside US over next 5 years. Which will ultimately result in $50-$60 oil.
Peak now or 5 years from now is meaningless. Countries all around the globe will start falling one by one from here on out. Go out and enjoy life while things are still relatively good where you are.
HHH,
I expect oil to go to about $90/b, if your 30% devalue scenario is correct that would be the equivalent about $117/b at today’s exchange rates, yes there will be some demand destruction, that will be necessary when we get to the peak. Note that my medium scenario has Brent oil prices rising to $90/b in 2018$ by 2027.
Also a devalue of the Euro would tend to increase their exports and reduce their imports which would be stimulative for the European economy.
Any peak will be temporary. Do you guys expect oil prices will remain low forever?
Dennis, the ultimate peak will not be about prices, it will be about the amount of oil left in the ground that can be economically recovered. Of course, high prices will increase that amount, but as the supply dwindles, the price must rise just to get the remainder out of the ground.
The bottom line, peak oil will be about peak supply, not the price of oil at the peak, or as we descend the peak.
Ron,
The price affects how much oil is recoverable, ceteris paribus, lower prices would tend to result in a lower peak output. I am not claiming there will not be a peak, but a claim that prices will have no effect on output is false in my opinion.
dclonghorn,
87 off red line brings it under blue, 50 off also brings it just under the blue.
Here’s a chart for you which would strengthen your prediction of shale oil production slowing now. The chart represents the top 5 counties in the Permian: Loving, Midland, Lea, Reeves and Eddy. These counties represent almost 60% of Permian shale oil production. The chart is from shaleprofile.com
These 5 counties peaked at 2.1 mbd in May 2019. What’s interesting is the sharp drop in well production from big wells > 800bd. In May these big wells produced 0.5 mbd and this dropped to 0.4 mbd in August, a 25% drop. It seems that many of these large wells have fallen down into the next category of 400-800 bd as shown in orange.
I assume that the decline from the May peak is because Permian sweet spots are reducing in number and well spacing is too close.
I appreciate that shaleprofile.com will gather more well data and production will increase but that May 2019 peak could remain.
Here’s another chart representing the top 4 counties in the Eagle Ford: Dimmit, La Salle, Dewitt and Karnes. These counties represent just over 60% of Eagle Ford shale oil production. The chart is from shaleprofile.com
These 4 counties peaked at 0.9 mbd in Dec 2018. What’s interesting is the sharp drop in well production from big wells > 800bd. In Dec 2018 these big wells produced 173 kbd and this dropped to 142 kbd in July, an 18% drop. It seems that many of these large wells have fallen down into the next categories of 400-800 bd and 200-400 bd as shown in orang and green respectively.
I assume that the decline from the Dec peak is because Eagle Ford sweet spots are reducing in number and well spacing is too close.
I appreciate that shaleprofile.com will gather more well data and production will increase but that Dec 2018 peak could remain.
Same chart for North Dakota top two counties of McKenzie and Mountrail, representing almost 60% of North Dakota shale oil production, with Oct 2018 peak. Chart from shaleprofile.com
Hey, what these charts are telling us is just obvious. That is the sweet spots are getting a lot less sweet. The rigs and crack spreads are moving out into territory that is not so rich.
Soooooo…. It just doesn’t matter what the price of oil goes to. Higher prices will not create more or sweeter sweet spots. Shale oil in the US is either now declining or soon will be.
So just get used to it.
Ron
More wells can be completed to offset falling productivity as long as oil prices rise.
My models assume new well productivity starts to decrease in Jan 2019.
So far average new well productivity shows no evidence of decrease through 2018, too early to judge 2019.
In my opinion it is best to look at all the data. We might be getting close to productivity decrease, not clear we have reached that point in Permian other basins might be there.
Eagle Ford looks like average well productivity reached it’s peak in 2017, Niobrara also may have peaked in average well productivity in 2017, but Bakken and Permian so far have held steady with 2019 looking similar to 2018 so far with 2018 as the clear peak year. In the Permian Basin, when normalized for lateral length productivity has been steady since 2016 according to Enno Peters, whose analysis tends to be spot on, in my opinion.
The last 5 months of your chart are subject to heavy revision. August will be up considerably but not as much as indicated. September will be revised down… a lot. No one knows what the numbers for October, November, and December will be.
We have tight oil data for Oct from EIA.
See tight oil production estimates by play at crude page at EIA.
https://www.eia.gov/petroleum/data.php
Ron, sadly, I am going to have to disagree with you on your call for US shale to begin to decline in 2020.
Yes, I agree. The peak could be late 2019 but I picked 2020 just to be on the safe side.
“Chesapeake’s series of bond sales that it then undertook included, in January 2018, $1.25 billion of senior unsecured convertible notes with a coupon of 5.5%, due in September 2026. It issued those bonds at a discount, but by July 2018, a few months before Phase 2 of the oil bust set in, the bonds were trading at 103 cents on the dollar. On Friday, the last trade was at 45 cents on the dollar, giving these bonds a yield of over 21% (via TRACE, FINRA’s Trade Reporting and Compliance Engine):“
45 cents on the dollar? That’s what investors think of the outlook for shale oil industry
https://wolfstreet.com/2019/11/23/fracking-blows-up-again-phase-2-of-the-great-american-shale-oil-gas-bust/
Tony,
Chesapeake primarily is a shale gas producer.
CHK q 3 2019 production was 24% oil. This compares to PXD at 61% oil, WLL at 65% oil, CLR at 60% oil and EOG at 58% oil, for example.
The percentage is BOPD divided by BOEPD.
Thanks shallow sand.
I imagine much of Chesapeake’s “oil” is condensate.
So when an outfit like Chesapeake goes broke and shuts up shop, if nobody else wants to buy their assets, what keeps their wells running? Do they just turn off the taps and walk away?
This question has been covered here before. Do a search on plug and abandon, though my personal history with search on this site is not good.
Moody’s has CHK at Caa1. Do a search on Moodys and maybe find my explanation of Moodys nomenclature.
If the system needs oil to flow, and money is in the way of it flowing, then it will flow. Money is never going to be allowed to starve billions.
Factoid: 4th largest oil importer in the world — tiny S. Korea.
Most of what they own is likely able to be operated profitably by smaller companies assuming there is little to no debt attached to the assets. So some of the assets will be sold.
However, what will likely happen is there will be a Chapter 11 reorganization. Equity will be wiped out, preferred will be wiped out, most De͏b͏t will be wiped out and converted to equity in the new company. Read up on companies such as Linn, Legacy Reaerves, Breitburn, Sandridge, Halcon etc.
SS , you are correct to the methodology of chapter 11 reorganisation . The problem is that even after reorganisation they still keep on loosing money . The problem is that the basic business model is flawed . Even XOM is not able to make any money on it’s shale operations as pointed out by Steve d angelo . So you can wipe the slate clean but to no benefit . The issue is simple ,it costs more to produce then what it can sell for . They can tell lies ,technology improvements, long laterals ,multipad drilling ,daddy wells and baby wells and other BS,the fact remains ,shale is a money loosing business .
But after wiping the slate clean, you can attract new investors to donate you fresh money to continue. Pension fonds and rendite starved investors are eager to throw away more money. At least this worked until now in shale business.
No. Bankruptcy does not mean shutting down the company. Usually it means something like this:
The old shares are canceled, so share holders lose the most. The company does not have money to pay creditors, so new shares are issued and the creditors become share holders. About 5% of the new shares are reserved for the original share holders, so they lose about 95%. The company now has wells and no debt so it goes to the financial markets and asks for more money. Frequently upper management does very well because they receive a bunch of new shares to give them “incentive” to do better next time. Some companies have already gone through chapter 22 = 2 * chapter 11.
See http://www.houstonchronicle.com/business/article/Even-in-bankruptcy-oil-bosses-are-promised-riches-11093366.php.
Along on the still declining rigs, Primary Vision frac spread took another weekly 2% hit from 345 to 338,
until now, Primarys in September expected stop of the decline didn’t happen so far.
Lowest level since End of March 2017, 30% down from 2018 top.
St. half 2020 “recognizable” growth will be tough to achieve with this trends, IMHO.
https://twitter.com/PrimaryVision/status/1198000799575683074
Looks like the thing I think:
They frac their many predrilled wells they drilled during the growth boom. After this, they cancel the contracts with the fracking companies and go to much reduced activity – like they communicated to the investors the last few quartals.
So as long as DUC count and rigs are going down, growth will be reduced and eventually we will see a small decline.
This is not peak shale in my opinion – a high enough oil price for 6+ months will bring hot money back. Scrapped spreads and rigs have to be reordered, so it takes some time to go again full throttle boom (and next bust).
Now it really takes some poor planning to sell crack spreads for the amount of scrap metal they contain then buy new spreads at millions of dollars each.
I really believe most CEOs are smarter than that. They have the data and know what they are doing. Or at least that’s my opinion.
Ron
If the new frack equipment is more efficient and less prone to breaking down then companies may choose to upgrade. Old equipment often becomes obsolete.
I think “if” is reaching a little too far in this case.
Media splash of a big oil and gas discovery southwest Pakistan.
Pakistan’s oil company has run to the podium to deny it.
Curious.
The MER was posted today with US production up to October. The September EIA 914 for US production comes out on Friday and is usually fairly close to the September MER estimate. The MER’s September growth is estimated to be 75 kb/d while October is up by 150 kb/d. I have added the STEO estimate for the L48 up to December. Initial growth estimates for 2019 indicate a growth rate of close to 1/2 of 2018.
New posts
http://peakoilbarrel.com/open-thread-non-petroleum-november-25-2019/
http://peakoilbarrel.com/permian-basin-bakken-three-forks-and-eagle-ford-net-volume/
Thoughts on production impact of surge in UAE, Iraq & Libya rig counts surge