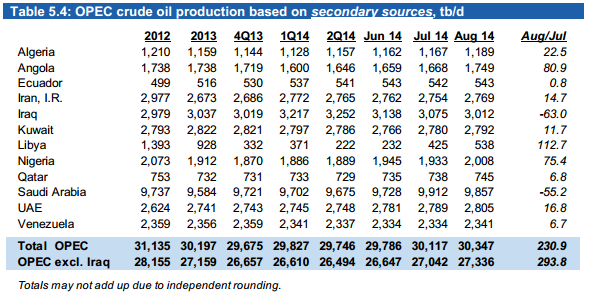
The latest OPEC Monthly Oil Market Report is out with OPEC production numbers for August 2014. OPEC production was up 230,000 barrels per day but that was after July had been revised upward by 210,000 barrels per day. So OPEC production was up 430,000 bpd from what they reported last month.
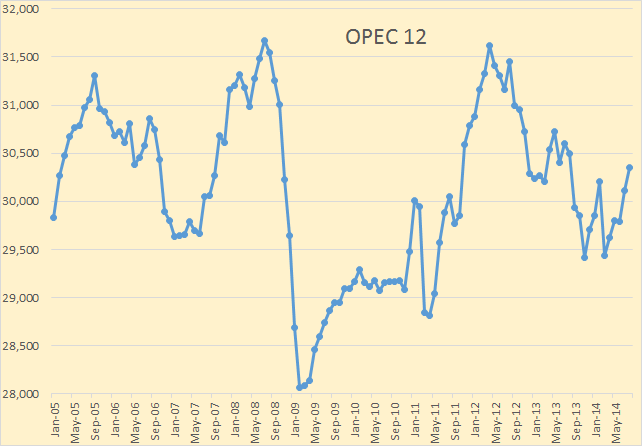
OPEC crude only production now stands at 30, 347,000 barrels per day, a one year high.

Saudi Arabia’s production dropped 55,000 bpd in August but that was after their July production had been revised upward by 99,000 bpd.
The OPEC MOMR publishes two sets of data. One, the one I, and most everyone else uses, is from what they call “secondary sources”.
And for about one year now they have been publishing a second set of production numbers based on “direct communication”. That is they pick up the phone, call each OPEC producer and ask them how much they produced last month.
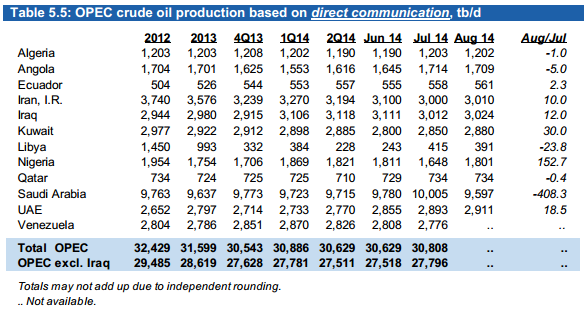
The data is usually pretty close except for Venezuela and Iran. Venezuela always reports about 450,000 bpd more than their secondary sources reports. This has been the rule ever since Chavez fired all the striking workers. He wanted to show that the firing did not affect production. Iran, for awhile after sanctions, reported about one million bpd more than the secondary sources but lately they have closed that gap to about .25 million bpd.
But the big shocking difference this month was from Saudi Arabia.
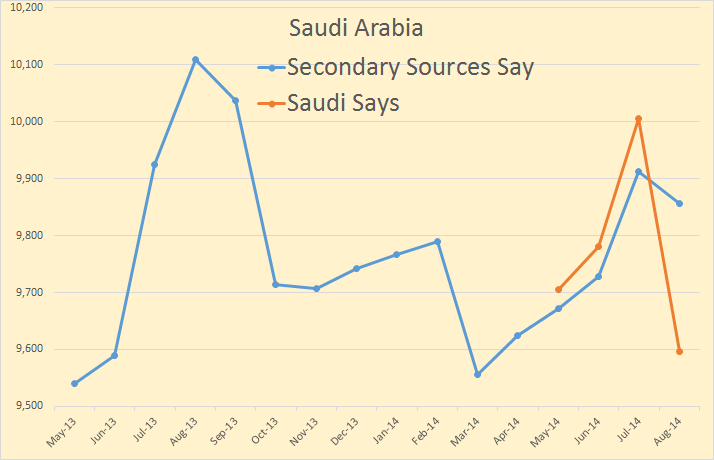
I haven’t been collecting the “direct communication” data so I don’t have it before May. But Saudi says their production was down 408,000 bpd in August while “secondary sources” say it was down only55,000 bpd. Of course those “secondary sources” are subject to revision.
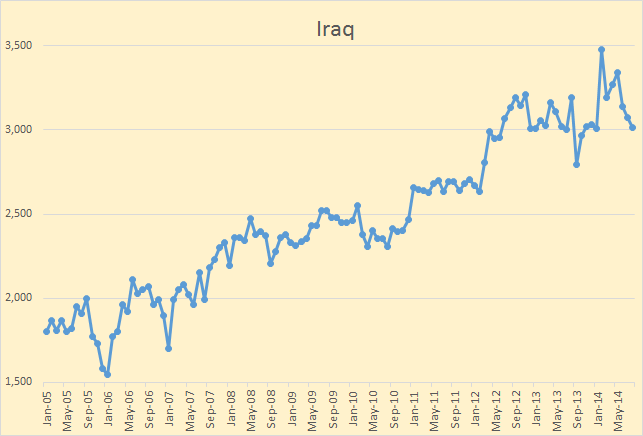
Other than Saudi Arabia, the only other OPEC country to show a decline in August was Iraq, down 63,000 bpd.
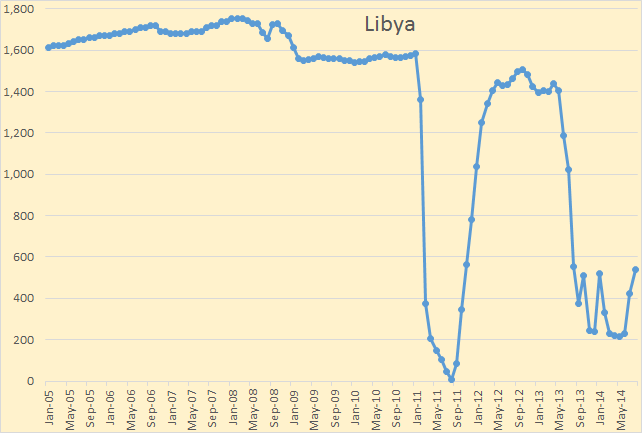
The Big gainers were Libya, up 113,000 bpd,
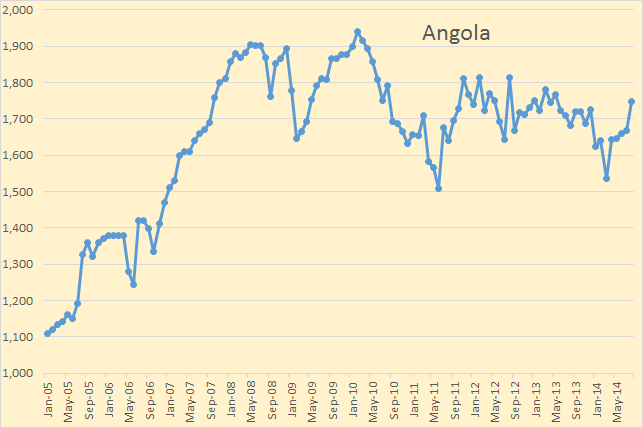
Angola, up 81,000 bpd and…
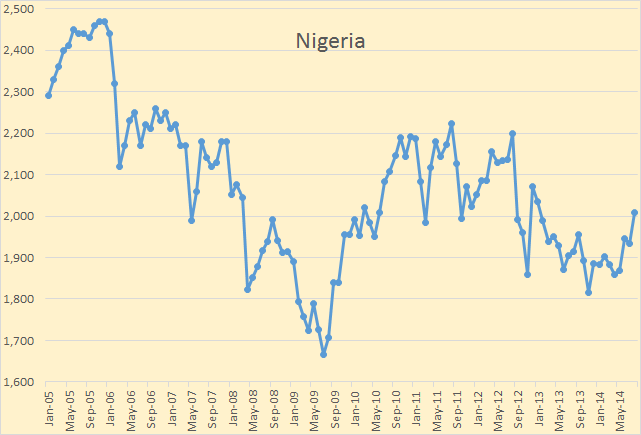
Nigeria, up 75,000 bpd.
Other OPEC news.
The OPEC Basket Price has been falling for almost three months now and currently stands at $95.93 a barrel.
OPEC expects Non-OPEC supply to grow by 1.58 million barrels per day this year and grow by another 1.24 million barrels per day next year. That’s 2.82 million barrels per day over the two year period. I think this is mostly based on the observation of how fast US shale oil production has increased during the first six months of 2014. They expect it to continue through next year. Anyway the IEA has pretty much the same idea.
And from the IEA: Highlights of the latest OMR
- Global oil demand growth for 2014 and 2015 has been curbed to 0.9 mb/d and 1.2 mb/d, respectively, to reach 93.8 mb/d in 2015. A pronounced slowdown in demand growth in 2Q14 and a weaker outlook for Europe and China underpin the downward revisions.
- Global supply was down 400 kb/d in August, to 92.9 mb/d, on lower non-OPEC production. Compared with a year ago, global supply was 810 kb/d higher, with an increase in non-OPEC of 1.2 mb/d more than offsetting a 370 kb/d OPEC decline. Non-OPEC supply is set to expand by 1.6 mb/d in 2014, and 1.3 mb/d in 2015, to reach 57.6 mb/d.
- OPEC production fell by 130 kb/d in August to 30.31 mb/d as a steady recovery in Libya failed to offset lower supply from Saudi Arabia and Iraq. The ‘call on OPEC crude and stock change’ was lowered by 200 kb/d for 4Q14 to 30.6 mb/d and 300 kb/d for 2015 to 29.6 mb/d on a weaker demand outlook and robust non-OPEC supply growth.
The page OPEC Charts has been updated with charts for all 12 OPEC countries through August 2014.
We better HOPE tight oil production keeps on going up fast so as to postpone the pain a little longer.
In the meantime I personally believe that efficiency gains are coming faster than most people think. I hardly ever see a really old big American car on the road any more and only a couple of my neighbors still drive eighties and early nineties vintage full size pickups on a regular basis. There are still plenty of old hot rods and so called muscle cars and pony cars around but they are driven very little. I don’t know a soul anymore who drives one except for an occasional pleasure drive. Too valuable.
A new Corvette can get right at thirty mpg on a trip. Ditto the old cars poor people are now driving. A neighbor just bought a 2001 Chevy Impala and is getting well over twenty mpg on local mountain roads and thirty on the open road.Such cars are now readily available for well under three thousand bucks in pretty decent mechanical condition but maybe a bit shabby looking.There are plenty of Ford Escorts that will get thirty locally and thirty five on the open road, with a lot of life left in them, for under two thousand bucks.
You can’t buy an oil furnace locally anymore without waiting a week for one to be shipped here. Nobody keeps one in his local warehouse anymore. It’s all heat pumps now.The people who still commute a long way are driving cars that do even better without exception among my acquaintances.
Old folks with a few bucks are moving out of town to the boonies around here and younger folks are moving into the houses they vacate closer to work. This is so far a minor trend but overall nationwide it might add up to a lot of gasoline saved if it grows.
Gasoline is not yet expensive enough to encourage much if any carpooling here but that may be mostly due to the fact that most employers are relatively small and not many people have a good opportunity to carpool given their addresses and their varied destinations and schedules etc.
IF the backside of the Hubbert Curve is not too steep Old Man Business as Usual might outlast OFM.
Efficiency gains are great (and needed) but work best in a no- or de-growth environment. Design a product that uses 25% less, but sell two of them, and your net is +50%. Jevon’s paradox http://theenergycollective.com/michaelgiberson/91026/efficiency-conservation-and-inescapable-jevons-paradox Then there’s the embedded energy and typically higher cost of the more efficient product. The greenest product is the one that isn’t built.
I believe in the Jevons Paradox but I think it only applies over the long term for the most part and in relation to most commodities.
In some cases it would apply more or less immediately. If the price of shrimp or ribeye were to fall by half, or if my net income were to double suddenly I would eat a lot more shrimp and ribeye- probably more than twice as much.
But if gasoline were to fall by half I would not use anywhere close to twice as much in the short term because in order to take advantage of it I would need either a lot more leisure time or I would have to sell my old vehicles and buy new ones that use even more gasoline than the old ones. In my own case I could afford to drive my old full size 4×4 farm truck more often but not twice as often or twice as far.
By the time Jevon’s Paradox comes into play in respect to oil I think the effects of it will be lost in the noise of other factors that depress demand for oil.Not very many people in my estimation are going to drive a lot more if the price of oil goes down or the efficiency of automobiles goes up short term. Most people with money enough to drive a whole lot more seem to be too busy already to drive a whole lot more– if they drive at all– and people at the bottom of the heap these days can’t afford to drive period.
I am already driving a compact thirty mpg plus car due to gasoline prices doubling since the last time I owned a full sized car.
Jevon’s Paradox did not result in me buying more gasoline because I was able to buy a car that is twice as fuel efficient.
Ditto the primary truck- it’s a compact too and burns half as much as the last older full size two wheel drive truck we owned which had a monster v8 and would climb hairpin curves going up mountains in high gear. But ten mpg was about as much as you could expect.
A doubling of fuel efficiency has allowed me to drive about the same mileage per fuel dollar but I am actually using considerably LESS gasoline than formerly due to driving much less these days. My own personal example does not prove my argument of course but it does illustrate it.
Our elderly full size four by four is only driven on days the roads are icy or when I have a full size load to haul.Lots of months insurance for it is more than gasoline.
But you are right at least a good part of the time… The greenest product of all is often the one that never gets built and sold.
“Not very many people in my estimation are going to drive a lot more if the price of oil goes down or the efficiency of automobiles goes up short term.”
Well, maybe not in North America or Europe where people drive a lot already. But oil consumption is increasing outside the OECD countries where it is flat or falling. Falling oil prices would definitely increase oil consumption a lot more in these countries.
I am sure gasoline consumption would rise a lot faster in developing countries if it were cheaper. No question.
But most developing countries do not yet have automobiles by the millions and highways suitable for them by the thousands of miles.
Nevertheless I think you are dead on and even without cheaper gasoline developing countries are going to continue to increase oil consumption fast at current prices.
However I expect this trend to slow dramatically soon due to my expecting oil (and gasoline ) prices rising dramatically in the next few years.
I agree, Jevon’s Paradox only applies when cost is a serious constraint to consumption. For example, I do not believe that LED lighting will lead to much brighter indoor lighting in homes, retail and offices in America. It will lead to brighter outdoor lighting in many cases, because cost is more likely to be a constraint. I doubt it will in Las Vegas though, because Las Vegas has gotten a lot darker in recent years as faux Olde World architecture has replaced garish neon signs.
Another example: I drove to Genua with my daughter last Easter. It’s a port in the insanely rugged Italian province Liguria. The Alps just fall into the Mediterranean here. The autostrada is high bridges and tunnels almost continuously from the Swiss border. I noticed that the government is replacing the tunnel lighting step by step with LEDs, from the looks of it just following the regular schedule for bulb replacement. I am pretty confident the Jevon’s Paradox will not kick in this case, and efficiency will lead to lower consumption.
Down here, the council is trumpeting that they have replaced over 11,000 street lights with more efficient ones. In most cases that means LED. They have been busy, this week, replacing the fancy, old style ones in the plaza with LED versions ready for the Fiestas Patrimonial. The local Sorianna supermarket has also upgraded to LED though I haven’t taken a look at Wally Mart. Overall the lighting is much better while using a fraction of the power.
NAOM
Old Farmer – “A doubling of fuel efficiency has allowed me to drive about the same mileage per fuel dollar but I am actually using considerably LESS gasoline than formerly due to driving much less these days.” Your experience squares with the U.S. as a whole spending billions more for less imported oil. As efficient as we are, we’re still drawing down the reserves.
Old farmer, you are right that people adapt when circumstances change. On monday may petrol/gas car will be converted to run on LPG (propane). Here in Northern Europe where petrol prices are 2-2,5 times higher than in the US there is one loophole and that is propane which costs less than half per litre or gallon. Conversion costs a lot of money but with my annual driving distance the investment is returned in about 15-18 months, from then on money will be saved on each filling. Where else can I have returns like that? I also look upon it as a kind of insurance against higher oil prices that probably are just around the corner. Still very few people do this, so the price of oil is not painful enough yet, at least here.
Here in northern California, I’ve been busy converting rural mountain schools from oil-fired boiler systems that burn $4/gallon oil and are 50% net efficiency to propane-fired furnace or boiler systems that burn $1.25/gallon LPG (when purchased by the truck-load) and have 95% net efficiency. These rural areas are beyond natural gas service lines. Propane in bulk is a heck of a bargain in $/BTU compared to oil and for heating equipment, is easier to handle, cleaner, and there are a lot more equipment out there that burn it ( basically, all natural-gas-fired equipment is available in LPG configurations).
On top of that, if they are also installing air conditioning and have low electric rates, we have been installing heat pump outdoor units instead of cooling-only units, which allows them to use the even less-expensive electricity for heat during mild heating conditions (above 35 degrees F).
$100 oil and the “gentle” hand of the marketplace IS slowly pushing the world to make less oil-consuming decisions. The question is whether the hand will continue to be “gentle” or will start giving some forceful slaps.
Hey everybody!
As I see it the real question is if we can adapt fast enough to keep Old Man Business as Usual out of the funeral home.
I am afraid we will not although I do believe it might be technically possible to actually manage the transition to much higher oil prices which are surely on the way.
I have personally set aside an older full size four by four to convert her to a wood gasifier if the shit hits the fan before I am personally recycled.
Most likely gasoline will be available at some price for as long as I can hope to live but it may be pretty damned expensive and rationed at times, maybe all the time.
If any of my old cyber buddies want to get involved in converting a vehicle or other hard core doomer adaptations I can be contacted directly at oldfarmermac at gmail dot com.
I’m still hoping an eco-modernist approach may work to make a soft landing transition. It’s kinda my business, so I kinda have to be an optimist;)
If not, fuel may be the easy part when the SHTF. It’s the brake and power steering fluids, transmission and engine oil, various bearings, seals, rings, tires, plugs, points or electronic parts, and other spare parts that would be really tough….I’ll be happy to just keep a basic single-speed bike rolling.
At some point it may well be impossible to get even a bicycle tire.
But my guess is that it will be possible to keep an older American made Ford or Chevy truck running for a pretty long time in terms of fluids and spare parts. Once the shit hits the fan for real – and it will sooner or later- there will be thousands of trucks sitting around good for nothing except salvaging spares and metal to put to other uses.
At any rate my old truck need not be kept running forever. It only needs to run as long as I do. The one I will convert is about as bullet proof as was ever built and has a granny gear four by four drive system and huge ground clearance.
The road to town can be expected to have some ruts and potholes that will stop most vehicles – but not one of this sort.
If it won’t go nothing but a log skidder will.
IF it ever comes to it I will hook on a hay wagon and pick up people all the way there and back. A ride will cost a bushel of oak chips or a pound of butter or a pound of walnut meats or maybe just a smile if the rider is a ”hot young blossom” courtesy of Mr Twain.
One set of tires will outlast me making the trip once or twice a month.
One thing that most people fail to realize about a potential collapse is that there simply are not going to be enough horses and mules etc to even think about providing motive power for transport.The handful that don’t wind up on the table will be priceless.
Beyond that they will have to be fed every day when used only occasionally.
Old trucks consume nothing at all except a few square feet of shed space when you are not using them.
I would need such a truck only a hundred miles a month for essential travel other than during harvest season when it would be needed a thousand miles a month to deliver to town.
In twenty years it would get only twenty five or thirty thousand miles.By the time it is needed , if it is ever needed,I won’t last that long myself.
The odds that some gasoline and diesel will be available for essential work more or less indefinitely seem to be very high like ninety nine to one or better to me with one possible exception.
WWIII could mean the end of oil refining and distribution for a long time.
In that case society goes mad max. Forting up will be the order of the day for years.
I guess SA is reporting much lower production than the independent monitors in an attempt to buoy the market. Brent has just fallen through $97 on the London exchange, and this has got to be hurting their budget. SA knows that the oil market is as much driven by fear and rumour as any other, and most traders simply follow the trend and react to MSM headlines.
They will probably cut production in the coming months, but they need the market to react now.
SA knows that the oil market is as much driven by fear and rumour as any other, and most traders simply follow the trend and react to MSM headlines.
Traders do watch the headlines but they trade paper barrels. Buyers and sellers of real oil set the long term trend and the true price of oil, not the speculators. That is the futures market is responsible for short term swings in the market but only supply and demand set the long term trend. No matter how far the futures market swings it always comes back to what supply and demand dictates.
World oil demand is falling because of the state of the world economy.
They will probably cut production in the coming months, but they need the market to react now.
If that be the case then they were not successful. The OPEC basket price dropped $1.06 overnight, after the release of those numbers.
Oil at $92.87.
And Saudi says they will cut production to bring it back to $100.
Saudi Arabia slashes oil output to defend $100 price
”That is the futures market is responsible for short term swings in the market but only supply and demand set the long term trend. No matter how far the futures market swings it always comes back to what supply and demand dictates.”
Truer words were never said nor printed.
They should be carved in stone in reverse bas relief and the stone used as a club to imprint them on the skulls of anybody who believes otherwise.
(note to the literal minded reader THIS IS SARCASM.)
https://news.vice.com/article/the-end-of-fracking-is-closer-than-you-think
But Hughes’s analysis indicates that this rapid increase in domestic production will quickly decline.
“Companies always drill their best locations first,” he said. “Once you’ve run out of locations in the sweet spots, you’re forced to lower and lower quality rock. The wells don’t get any cheaper, however. They still cost the same, it’s just that you have to drill more of them to offset that fuel decline.”
Hughes explained that more than 80 percent of the nation’s shale oil comes from just two plays, the Bakken field in North Dakota and Montana and the Eagle Ford in Texas. He estimates that production in those regions will recede back to 2012 levels in 2019. Overall production across the nation’s shale oil fields will peak in 2017.
In just the Bakken, Hughes calculates that 1,400 new wells are needed per year to offset current production decline, which right now is 45 percent of current production rates of about a million barrels per day, or 450,000 barrels per day each year.
“You need 1,400 $8 million wells to keep production flat, and they’re drilling more than that — they’re drilling 2,000 wells per year,” he explained. “So production in the Bakken will continue to go up. But it’s because at the moment they’re continuing to drill the sweet spots.”
In just the Bakken, Hughes calculates that 1,400 new wells are needed per year to offset current production decline,…
I believe Hughes is way off with this number. The EIA says the current Bakken wells are declining by 73,000 barrels per day per month. If we assume 400 barrels per day per new well per year then it would take 2,190 new wells per year or 182 per month just to keep production flat.
But that number inreases every month. For every 1,000 barrels per month of increased production 2.5 more wells per month will be needed to keep production flat.
I expect the rate of increase in Bakken production to greatly decrease next year and peak late in 2015 or early 2016. There will be little if any plateau. Production will start to drop almost immediately after peak.
Right now it is a toss up which will peak first, the Bakken or Eagle Ford. I am betting it will be Eagle Ford.
The EIA productivity report showed 73% of the new Bakken capacity and 79% of Eagle Ford went to covering the decline. Is there time series data available for these percentages?
No but if you download the Excel spreadsheet you can work one up. I will see what I can do. The spreadsheet does not give the production from new wells before the decline but perhaps from the decline number we can figure it out.
I’m reasonably handy with charts, but I don’T know what Excel sheet you mean.
Okay, go here:
Drilling Productivity Report Then click on:
Report data (aggregated by region) There is a little Excel sign before the words “Report Data” but I cannot reproduce that.
Anyway there are seven pages to that one spreadsheet, one for each producing region.
This is what I came up with. The data comes from the Excel sheet. It refers to Bakken oil. The “Net new ratio” is calculated in two steps. First I multiply Rig count by Production per rig to get New production (I suppose). Then and add that to Legacy production change (a negative number) to get Net new production. Then I divide Net new production by New production to get the Net new ratio. The values are shown on the right side.
The Net new ratio has been holding steady since the beginning of 2013 because production per rig increased nearly 70% since then. This data is from the same source.
Your math there assumes those 400 bpd goes to 0 in a year. 1400 or so seems about right for a 70% or so decline in year 1.
Wells are getting cheaper. I’ve seen many companies going from a $9-12mill/well figure down to $7-9mill over the past couple years. I’m sure there is a decay to this, but they are getting better at pulling oil out of wells for less.
Finally, I feel the argument that 80% (or whatever) figure for shale oil (or gas) comes from two (or whatever) plays and therefore the end is near for shale is wrong. To use a sport analogy, just because Michael Jordan scored 30-40% of point for the Bulls in his heyday (sorry, haven’t followed basketball in a while) doesn’t mean that without him they would have gone 0-82 without him. No, the resources (whether salary cap or drilling rigs) will go to a less world-class play(er), production or performance would slip some, but it wouldn’t be all over. After the Bakken is played out, they will move probably even more resources to the Permian, and maybe the Niobara gets more action. When the Marcellus gets tapped out, they will start going back to the Barnett and maybe cross the border into the Utica Shale.
Your math there assumes those 400 bpd goes to 0 in a year.
I have no idea how you came to that conclusion. My math made no such assumption.
Are you kidding with the basketball analogy? That makes no sense and is not remotely related to the fact that the majority of shale oil comes from two plays. Every location in the US has been searched for shale oil and gas. About seven gas locations were found but only two with very much oil. That does not include the Permian which is mostly conventional oil. Of course all the others have “some oil” but the barrels per day per well was not enough to show a profit. Of course they can, like you say, just drill them all for oil. But i’ll bet they have no desire to keep losing investors money, or borrowed money they are paying junk bond rates on.
Of course all the gas places do produce some oil but only the Bakken and Eagle Ford are showing big increases in production. The Permian is increasing also.
They thought they had another big one in the California Monterey Shale but that turned out to be a dud.
I misread/misunderstood you comment on the wells. The 2000 wells a year does seem more in line with what’s needed.
I’m not sure what you don’t get about the analogy. The best rates of return are in the Eagle Ford and Bakken right now. That’s why “80%” of shale oil production is there. They are the industry stars. Not including the Permian ignores the huge changes happening there, along with the 5-6 (depending on definitions) shale plays there. I doubt it’s even “mostly” conventional anymore. The production has doubled in that basin since 2010. The 80% figure from the Vice article obviously completely ignores the Permian plays.
The point is, as the returns drop on the Bakken and Eagle Ford, the resources used to drill there will migrate to the other plays. Like one of the 6 in the Permian. Maybe the Niobara. The Illinois Basin may come into play. Will the production per well decline and the costs increase? Probably, at least initially, but it’s not going to be a step change in overall oil production. Those presenting the oil shale industry in the US as being Bakken, then Eagle Ford, then we’re done are doing the same as looking at a sports team, seeing that their two stars are going to retire in two-four years, and run game simulations as if the team won’t draft new players and slowly work them up to replace the stars.
No, they will not migrate to other plays because they will not need to do that. They are already there! They are punching holes all over all the other plays. They are getting lots of gas but very little oil.
Don’t you think these guys know what they are doing? If there were more oil there they would be producing it.
Or, in other words, the finite sum of discrete sources of oil that peak and decline will show a perpetual rate of increase in production.
Those of us who subscribe to the “Finite Earth Theory” believe that the finite sum of discrete sources of oil that peak and decline will also peak and decline.
No Ron,
Hughes is correct. The 73,000 b/d is legacy decline when 250 wells are added per month. The legacy decline is lower when there are only 117 new wells added each month, which you are not accounting for.
No Dennis,
The 73,000 barrels legacy decline would be there even if no new wells were added. The legacy decline has absolutely nothing to do with how many new wells are added. That is the decline from all the old wells.
The point is, new wells must produce 73,000 barrels per month just to break even. If it took 180 wells to produce that then all wells over 180 would be increasing production. But if only 160 new wells were completed that month then production would decline.
I am assuming that 180 is the correct number required to break even. It might be less or more. But the point is you must have enough new wells to produce 73,000 barrels per day just to break even.
Really Dennis, it’s not that complicated.
Hi Ron,
The fact that Hughes gets about the same result as I do gives me confidence that it is more complicated than you realize.
The legacy decline rate is not a fixed number. Just because the EIA estimates a 73 kb/d legacy decline in a particular month does not mean it will always be that level.
The EIA estimated about 200 to 225 wells were added in July and August and these wells were the biggest contributor to legacy decline in September because decline rates are highest in the first few months.
What do you think would happen to legacy decline rate if the wells added in July and August was only 110 wells each month? So as the rate that new wells are added decreases the legacy decline rate will decrease as well.
It really is not very complicated, on that we agree.
The legacy decline rate is not a fixed number. Just because the EIA estimates a 73 kb/d legacy decline in a particular month does not mean it will always be that level.
Jeeesuz, did I ever even hint that the legacy decline was a fixed number? The rate is pretty constant, varying only a little but the actual number goes up with production and will go down when production starts to decline. The rate, according to the EIA, is currently about 6.3% in the Bakken and about 8% in Eagle Ford.
The EIA estimated about 200 to 225 wells were added in July and August and these wells were the biggest contributor to legacy decline in September because decline rates are highest in the first few months.
I would really like to know where the EIA gave that estimate. I cannot find that number anywhere.
Anyway, in September the wells drilled in July and August will be old wells. September legacy decline will include wells drilled in every previous month, including July and August. Certainly the wells drilled in the previous two months will be part of it but so will all wells drilled in the previous two years.
Again, the legacy decline, for any given month, has nothing to do with the number of wells drilled in that particular month.
Here is what the EIA says was the legacy decline rate for the last several months.
       Bakken	Eagle Ford
Jul-13	6.25%	7.96%
Aug-13	6.03%	7.96%
Sep-13	5.92%	8.08%
Oct-13	5.93%	8.13%
Nov-13	6.00%	8.47%
Dec-13	5.94%	8.53%
Jan-14	6.39%	8.25%
Feb-14	6.40%	8.30%
Mar-14	6.38%	8.19%
Apr-14	6.38%	8.22%
May-14	6.39%	7.93%
Jun-14	6.38%	7.93%
Jul-14	6.36%	7.93%
Aug-14	6.36%	7.93%
Sep-14	6.37%	7.93%
Oct-14	6.37%	7.90%
The actual decline number, in barrels per day, will be the percent indicated on table of total production from all old wells regardless of what prodution is. So as production increases the legacy decline will increase. And the number of wells required to keep production flat will increase as production increases.
For instane, if 1,250,000 barrels per day were to be produced on September 1st and the legacy decline rate was 6.37% per month, then the actual legacy decline in September would be 79,625 barrels per day. That would means new wells would need to add 79,625 barrels per day for production to stay flat at 1,250,000 barrels per day. Of course that level of production is a little high but I am just giving an example.
Hi Ron,
The legacy decline rate will decrease as more wells are added. Using a well profile based on NDIC data with an EUR of 350 kb and decreasing the number of wells added to 105 new wells per month over a 12 month period results in a decrease in the legacy decline such that the output is fairly level from 2014 to 2010. Chart below
The main point is that the legacy decline rate will decrease over time, especially if the rate that wells are added each month decreases.
Also the DPR said the Bakken new wells increased output by 100,000 barrels, if the average new well produces about 500 b/d in the first month (as indicated by Enno Peters data), then about 200 new wells would produce this 100,000 barrels.
If the rate that new wells are added falls to 105 wells per month (or 1260 new wells per year) by June 2015. the legacy decline rate will fall as indicated in the chart below. Note that the legacy decline rate is about 8.5% per month in June 2014 in this model.
It is sort of complicated. To do it with smooth functions it would work like this:
We need a function for initial output of new wells, say output(t). It seems to be increasing linearly fairly fast since 2007.
Then we need a function defining decline for a given well. I guess it would be something like output*e^-t, but I haven’t heard any consensus here.
Then we need a function that tells us how fast new wells are being drilled. This might be linear, and the slope could be the input to the model.
Then we need to apply the new well count for a given period to the output function to get gross increase.
Then it gets tricky: We need to apply the production decline function to the current population of wells to get the current decline. Shouldn’t be a problem if the new well function is linear.
“We need to apply the production decline function to the current population of wells to get the current decline.”
Utterly correct.
The problem is a redefinition is wriggling its way into the lexicon. “Decline rate” for a field suddenly become 1% for Russia’s primary field, because they include new infield drilling. The attempt is made to delineate infield from new fields brought online to stop the narrative of “decline rate” being quoted as a big number.
Presently existing wells need to be defined in the context of “presently”. If a new well is drilled during a month, but didn’t exist on day 1 of that month, it is NOT a presently existing well when computing the decline rate for that month.
We must guard against fuzzing up the definition, which never was an issue until well drilling was so numerous and fast.
Watcher,
Sorry but you’re confusing me here. By infield drilling do you mean infill drilling as in wells drilled between established producing wells in order to increase production from the reservoir? If so you may, in fact, be guilty of fuzzing up a definition — at least as I understand it. To me infield relates to baseball diamonds [yellow face]
I guess I have heard infield and infill used identically, and per your description.
The point is a Russian field (a collection of wells) has a decline rate. Then more wells are drilled inside that field to offset the decline rate. Then the resultant output from the field gets quoted, and if it’s less than last year the reduction is called “decline rate” and This Must Be Stopped lest the very fabric of the universe by torn.
The simplest estimation method is to divide the well lives into four quarters covering 1/2, 1/4, 1/8 and 1/16 of production.
So we say 1/2 the oil comes in the first six months, then another 1/4 in the next year, and another 1/8 in the next two years, and another 1/16 in the next two, and ignore the rest. If we calculate the well will produce a total of 4m barrels in its lifetime, we get 333K barrels/month the first 6 months, 83K barrels/month the next year, 21K barrels/month the next 2 years, and so on.
I know my numbers are wrong, but that’s not the point — the numbers can be tweaked to be realistic. The point is that by splitting production into tranches like this you can make the problem tractable, and by using shorter time periods when production is high you can minimize the error.
Also starting from the total oil volume expected to come out of well is mathematically much easier than messing with constantly shifting production rates.
But what to make of the EIA statistic production per rig? It has increased nearly fivefold for Bakken since 2007. I assume it is a reference to the initial well output. Does it mean the expected lifetime output of each well has increased 5x? Or does it mean the same oil is coming out 5x as fast? Or something in between?
It is puzzling, though in 2007 they were still doing a bit of vertical drilling and getting nothing.
I have ignored drill rig count since it became clear the big frack pump truck total was the more definitive parameter.
Wait, what? If legacy decline of already existing wells is 73K bpd at t=0, where 0 is the time of beginning of any new drilling, then obviously 73K bpd has no relationship to new wells.
If the number is 73K bpd, then at the end of the month of NO NEW DRILLING, output is down 73K bpd.
That number will reduce. No question about that. Decline rates for wells 2 years old are lower than decline rates for wells 1 year old — but those decline rates have no relationship to new wells drilled until a defined discrete time period passes in which new wells get to be included in the phrase “legacy decline”. That isn’t until that discrete period passes, which it has not at t=0.
This terminology must not be bastardized. Attempts are already underway to do it via new drilling. Don’t sign on.
I would guess that if the price remains thus, and/or continues to fall Russia will really start feeling the pinch.
Paulo
“I would guess that if the price remains thus, and/or continues to fall Russia will really start feeling the pinch.”
I’d guess a lot of producers will will (are) start feeling the pinch — not just Russian ones.
Rather too much talk around about how shale oil production costs put a floor under the price of oil.
Apocalypse doesn’t care about shale oil production. That price can go wherever it wants and wipe out the entire shale industry and Williston NoDak in just a handful of months.
There is no floor. There is no ceiling. It’s all redefined yardstick anyway via Scottish independence trashing the pound (which elevates the dollar, aka yardstick).
Hi Watcher,
It is hard to tell when you are serious and when you should be putting sarcasm tags on your comments.
Surely you understand that the price of oil cannot go much below the cost of producing it very long and that likewise it cannot in the short or medium term go above some certain price without demand destruction pushing the price down again pretty quickly.
The ability of governments and their banking arms to print money is not unlimited and in the case of oil it is not sufficient to subsidize oil prices to an unlimited extent or for an unlimited period of time…
Hard to raise the price of things not being bought.
It would seem that the global economy is an inherently unstable area between the price floor that will allow oil companies to keep us on the “Undulating Plateau” in actual crude oil production (45 and lower API gravity crude) and the price ceiling that causes demand to fall.
I think that we can loosely apply the aerodynamics “Coffin Corner” metaphor to the global economy and oil prices (at high altitudes, if a jet goes too fast they experience Mach Buffet, as they approach the speed of sound, which could result in structural failure; if they go too slow, they stall and fall out of the sky, which is what happened to Air France Flight 447, which fell 38,000′ in less than 4 minutes). At higher altitudes there is a decreasing margin between the Mach Buffet speed and the Stall Speed. I think that at close to its ceiling, the U2 only had about a five knot margin between the two speeds.
http://en.wikipedia.org/wiki/Coffin_corner_(aerodynamics)
No problem, just adapt the milkshake solution… >;-)
Applause for the constant <45 explicit specification whenever talking about the liquid good stuff. If that isn't repeated over and over again, it will get redefined to make some numbers somewhere look good.
BTW, stalls are less fatal than mach number transition in an aircraft not structurally designed for it. When you've felt the shockwave at 1.0, you'll know why.
Watcher,
Yeah, good luck on that one. Bitumen from the “oil sands” in the Alberta, Canada has an API gravity of around 8 °. We always used to call it Tar Sand but now, of course, its “oil”.
And, this year it was determined that, for the first time, Hispanics outnumber “white anglos” in the US public school system. Solution: redefine the word minority.
And, this year it was determined that, for the first time, Hispanics outnumber “white anglos” in the US public school system.
No, no, no, that cannot possibly be right. I was a little shocked to even read such a thing so I googled it. The only thing that came close was an article that said Hispanics now outnumber Anglos at Rio Rancho Public Schools. Rio Rancho is the third largest city in New Mexico. But even that was a mistake. A correction was made by the paper:
Correction: An earlier version of this story incorrectly reported that Hispanic students are now a majority at Rio Rancho Public Schools. In fact, Hispanic students have increased to 48 percent of the student population, but are not a majority.
Not even in New Mexico, perhaps the most Hispanic state in the union, do they have a majority in public schools.
Ron,
I may be wrong but my info came from BBC World News awhile back.
US SCHOOLS TO HAVE NON_WHITE MAJORITY
http://www.bbc.com/news/education-28937660
“White pupils in state schools in the United States are set to be in the minority for the first time when schools return for the new term. According to official forecasts, enrolments for the 2014-15 school year will mark the threshold when ethnic minorities become the majority.
This demographic shift has been driven by rising numbers of Hispanic pupils. Figures are gathered by the US Department of Education’s National Center for Education Statistics.It records the number of pupils in the state school system across the United States – and it publishes forecasts of enrolments in the years ahead.”
“…There have also been questions raised about the use in education of the term ethnic “minority”, when there is no longer a majority ethnic group within the school population.”
Regardless, I guess my point is/was that, as a society we tend to re-define as opposed to face problems. I think the word oil is a classic example. Bitumen, tar, condensate, etc., it’s all oil now.
You forgot “Natural Gas Liquids”. Bet you never thought of propane or ethane as oil.
And of course refinery gain is oil that doesn’t even exist. The US is the world’s largest producer of refinery gain – You even make refinery gain out of imported oil!
Doug, you said “Hispanics outnumber “white anglos”. That is simply not the case. In fact your article does not even maintain that “white anglos” are outnumbered by any other ethnic group. What it does say, if you read it correctly, is say that “all other ethnic groups combined outnumber whites in public schools. That would include Hispanics, Blacks, Asians, Middle Easterners and whomever. All of them combined outnumber whites in public schools.
The point of the article is that there is no majority ethnic group in public schools. That is no group has 50% or more of students in public schools. But I would bet you a lot of money that the “White” ethnic group, though less than 50%, still outnumbers any one other ethnic group. In fact that’s exactly what the article states.
It means that in autumn 2014 the proportion of white pupils is expected to have fallen marginally below 50% for the first time, with about 26% of pupils Hispanic and 15% black.
There are also smaller ethnic groups of Asian pupils, native Americans and Pacific Islanders. Fewer than 3% are identified as mixed race.
Still, 26% Hispanic is shocking. I would have never guessed that.
You’re right of course, I really should stop relying on bad memory (and poor reading skill). I apologize for wasting your time.
Report some years ago by the Univ of Calif system.
If university admission were granted on the basis of grades and SAT scores (substantially an IQ test), the student population would be 95% Asian, 3% White and 2% Hispanic and Black. And thus, quotas were born.
Except the Asian student with superior credentials who is denied admission has one helluva case of discrimination.
Ron, you may be technically correct but you betray your age.
When I was in medical school in Texas back in 2004-2005, even then I saw with my own eyes during the ob/gyn rotations, 66% or more of the babies born were of Mexican descent.
The data on immigration and births back it up. The United States is being colonized by Latin America!
Times do change.
I think that the key point is that in regard to actual global crude oil production (45 and lower API gravity crude oil) and Global Net Exports of oil (GNE), which are of course calculated in terms of total petroleum liquids (+ other liquids for EIA data base), demand has had to accommodate flat to declining supplies since 2005.
In other words, the price of oil has fluctuated, in an upward trend, in order to balance demand against post-2005 flat to declining global crude oil production* and GNE.
For example, Saudi net exports fell from 9.1 mbpd in 2005, when Brent averaged $55, to 8.7 mbpd in 2013 (EIA), when Brent averaged $109. This is in marked contrast to the 2.0 mbpd increase in Saudi net exports that we saw as Saudi net exports rose from 7.1 mbpd in 2002, when Brent averaged $25, to 9.1 mbpd in 2005, when Brent averaged $55.
*While we don’t have actual global crude oil production data (45 and lower API gravity crude), IMO the data we do have make an overwhelming case for flat to declining global crude oil production since 2005.
Where’s our cheap oil? I’ve always subscribed to the dictum that we can learn about the present and future by studying the past; what happened when oil became expensive before? Over 30 years ago we had an oil price spike, with prices peaking in February 1981 at $37/bbl before declining steadily for five years, going into a steep decline beginning in December 1986 when KSA turned on the taps to quash prices for good to teach its fellow OPEC members a lesson, or to hasten the downfall of the USSR if you believe that line of thinking.
The price surge was precipitated by the Iranian Revolution and outbreak of the Iran-Iraq war, as well as secondary events such as the hostage crisis and subsequent rescue attempt. Prices deflated due to huge increases in supply and buildout in storage for all that new oil, and an attendant crash in demand from the major consuming nations, most notably via increases in fuel economy in automobiles but also through fuel switching in power generation, moving away from oil to coal or natural gas.
For years now I’ve been charting the current recent price of oil and applying the pattern seen in the 80s to the price to see what the result would be. I’ve always used the Free on Board (FOB) price provided by the EIA as this series goes back into the 1970s. As can be seen we passed the equivalent of December 1986 some time ago, with no price crash bringing on another era of Happy Motoring like all this directional drilling is supposed to bring on. According to the EIA real prices at the 1980s bottomed out at what would be about $1.80 today.
9/9/2014 daily activity report, wells producing:
PRODUCING WELL COMPLETED:
#26069 – BURLINGTON RESOURCES OIL & GAS COMPANY LP, BIG JON 11-2MBH-ULW, LOT4 2-
151N-96W, MCKENZIE CO., 1704 BOPD, 504 BWPD – BAKKEN
#20100 – ENERPLUS RESOURCES USA CORPORATION, YELLOWBIRD 6A-1H, NWNE 6-149N-93W,
DUNN CO., 435 BOPD, 240 BWPD – BAKKEN
#25596 – HRC OPERATING, LLC, FORT BERTHOLD 147-94-2B-11-5H, SESW 35-148N-94W, DUNN
CO., 2706 BOPD, 1148 BWPD – BAKKEN
#25597 – HRC OPERATING, LLC, FORT BERTHOLD 147-94-2B-11-4H, SESW 35-148N-94W, DUNN
CO., 2750 BOPD, 2129 BWPD – BAKKEN
#26295 – HRC OPERATING, LLC, FORT BERTHOLD 148-94-35C-26-3H, SESW 35-148N-94W, DUNN
CO., 3569 BOPD, 2685 BWPD – BAKKEN
#26294 – HRC OPERATING, LLC, FORT BERTHOLD 148-94-35C-26-4H, SESW 35-148N-94W, DUNN
CO., 2567 BOPD, 2196 BWPD – BAKKEN
#26293 – HRC OPERATING, LLC, FORT BERTHOLD 148-94-35C-26-5H, SESW 35-148N-94W, DUNN
CO., 2769 BOPD, 1851 BWPD – BAKKEN
https://www.dmr.nd.gov/oilgas/daily/2014/dr090914.pdf
Looks like about 15,000 barrels per day for a total on those wells.
You’ll gain ground on the bpd output with wells with those numbers.
6 of those 7 in Dunn. Those BOPD numbers are the ultimate IP, as in Day 1. You should make note of them and check them on day 30. Some IP designations are 1st month, not 1st day.
Water cuts are 30-50% on day 1. That would also be interesting to see on day 30.
As far as the North Dakota daily reports are concerned, all the reported IPs in the “producing wells completed” category are 24 hours. Now I’m not entirely sure if they are the first 24 hours, but, in any case, they are determined very early on in a well’s life.
Here, you might like this. Emerald Oil, a pretty small-potatoes Bakken driller that mostly operates in the less-than-stellar acreage of southwest McKenzie County, actually puts, in investor presentations, graphs of the 24 hour and 30, 90, and 180 day production rates of their wells.
Keep in mind the scale is BOE/d, not bbl/d. Natural gas probably accounts for 15-25% of these totals. Also, in case this is hard to see, the full-size version is probably going to be at http://peakoilbarrel.com/wp-content/uploads/2014/09/emeraldoilwells0914.png.
Wes, this is fantastac! Thanks a million for posting it. Do you have a link to the entire document? The reason I ask is I would like to follow any future such postings.
And also thanks for the PeakOilBarrel uploads link. I had no idea there was a place where such graph uploads could be viewed full page.
The entire document is at this page, under “investor presentation.” Page 20 of the presentation has the actual data they used to make the bar charts.
Yes this is fantastic stuff.
My dispersive diffusion model of production predicts an extremely strong spike early on.
http://theoilconundrum.blogspot.com/2012/07/bakken-dispersive-diffusion-oil.html
Interesting to see what DC would think, because he applies a similar formulation.
http://2.bp.blogspot.com/-2RYus-CeYOc/T_YsxCMXOcI/AAAAAAAABQg/xCta6_cgtGc/s1600/bakken_mason_diffusional_model.png
Hi Web,
I no longer use the dispersive diffusion model because it is hard to explain, I simply use the actual data out to about 60 months then estimate with a hyperbolic with a b=1.1 and when the annual decline rate reaches about 9% I switch to a negative exponential with an annual decline rate of 9%/year. Not that simple but simpler than the hybrid hyperbolic/dispersive diffusion model which fits the data pretty well.
Oh I forgot. Thanks Wes, your contributions are excellent.
DC, Hyperbolic is not that different from the diffusional model. The diffusional model does have a physical basis, while the hyperbolic is tunable as a heuristic.
Hi Paul,
I agree that the diffusion model is better due to it’s physical nature.
The problem for me is that I don’t have access to the physical parameters for the Bakken wells and am essentially trading one heuristic for another. Each has three parameters and I am simply adjusting the three parameters to fit the data best.
The first 36 months or so the hyperbolic fits the data better, beyond that the diffusional model would probably be better, but then I would be fitting to separate curves to the data and splicing them together. Too much work so I use the simpler model with exponential decline in the tail. Possibly this is too optimistic, but it can be cut off when the well reaches 5 b/d. At that point the well is abandoned and output goes to zero.
stick to what you are doing, don’t fix something that is working.
Another point to keep in mind is that these numbers are for the average production rate over the specified time periods, i.e., the actual production on day 180 would be much lower than the average production over the first 180 days.
For example, for the Pirate #1 well, it averaged about 1000 BOE/d in the first 30 days and 500 BOE/day in the first 180 days. The total production over the first 180 days was 90,000 BOE, but 30,000 BOE (33%) of that was in the first 30 days. As noted above, the average production for the first 30 days was about 1000 BOE/d, and the average production over the next 150 days, after the first 30 days, was 400 BOE/d. The average production over the first 90 days was about 630 BOE/d, while the average production over the next 90 days was about 370 BOE/d.
As noted above, the monthly averages, for example average production from Day 150 to Day 180, and the 24 hour production rate on Day 180 would look far worse.
Ya, it would.
The tendency to talk averages comes from an industry where things happened slowly. Shale stuff happens fast. The only way to polish that up is with averages.
A car going 60 mph approaching a stop light that stops for that stop light has a quoted average velocity THAT MOMENT of 30 mph.
Yup good stuff.
Last Ronpost Ilambiquated and I dabbled in things geometric and estimated maximum possible oil in a 1/2 mile long fracking cylinder. You just mentioned % nat gas and of course there will be a % NGL so our maximum estimate has to reduce further because we didn’t adjust for pores thus occupied.
Another point is this area of SW MacKenzie, not being sweet spots, are posting 24 hr IPs roughly equivalent to the post above it mostly from Dunn. I guess we can evaluate Dunn as similarly non sweet spot.
Yo, Ron. These wells, per the avg numbers in the upper right hand quarter, are declining 12%/month.
In the first 6 months. That decline will slow.
And in fact most of that was the first 3 months. The second 3 months decline rate is 4ish%/mo.
I would disagree with the statement that these wells are from “less than stellar” portions of the Bakken. Below is the source of my data. It is the 35 wells that gave their total production “BOPD” in the category “Released from ‘tight hole’ or confidential status” and “Producing wells completed” for week ending Sept. 5.
All data is the first 24 hours of full production.
Bakken Permits and Completions
As you can see the Emerald Wells averaged 400 barrels per day more, during the first 24 hours of full production, than “All wells completed last week”. I would say that is a pretty good sweet spot.
Note: The wells have been sorted, highest producers to lowest producers.
Also Note: Many of the wells listed under: “Released from ‘tight hole’ or confidential status” do not list their BOPD. I do not know, but strongly suspect, these are the very low producers. The companies do not want investors to know how many of their wells are losers.
Upon closer inspection, you’re right. At present, Emerald appears to be concentrating on drilling wells in the best part of its acreage (no surprises there), which does appear to be relatively good stuff indeed.
12% decline per month in the first 6 months from sweet spots.
The mind boggles.
Significant question is a discussion with Dennis a few Ronposts ago, as regards the other end of the curve.
When almost dead, these things pump water. It fills an onsite tank. It pumps oil, and fills an onsite tank. You have to bring freshwater to the site every once in a while to flush the salt out of the pipes coming up. That water has to have biocide in it to keep bacteria out of the well. One presumes there is an electric bill there, too. And you pay royalty to the land owner and probably NoDak if the owner is NoDak. And you’re paying interest on the loan.
That’s truck trips. That’s cash.
Hard to believe these things are profitable at 5 bpd or maybe even 10 bpd — except for the $80,000 plug and abandon bill. The cheapest course is probably just claim to be flowing oil, don’t send any trucks for anything, and pay $5/year or whatever royalty. Takes a long time for that to exceed $80,000.
In fact, in that context, a falling oil price means lower royalty paid on imaginary oil. You can go longer without P&A.
Note that table is all 30+ frack stages. That . . . is recent data.
I am feeling sort of lonely posting some common sense stuff at Forbes online. The site pushes the cornucopian line relentlessly but so far they publish my down to earth comments about depletion and decline rates etc.
Some of you might considering registering and getting the peak side of the question a little better represented.
Canada Has Dutch Disease, Bank Of America Declares
The Huffington Post Canada | By Daniel Tencer, Posted: 09/10/2014 2:31 pm EDT
I don’t know about that, AWS. If our loonie was lower and we sold any more trees/logs overseas my area would look like a Marine flat top. Trucks are hauling steady and the logs are still going to China. Every mine is going flat out and new ones coming into development.
The only real sector toilet flushed is pulp and paper.
Imho we could do with a slowdown.
Paulo
I think in the end Paulo has the better argument. Canada is not a country heavily dependent on exporting manufactured goods.
With the loonie going up every coin in a Canadian pocket is worth more in imported goods from peanuts to pistachios.
We always hear only one side of the currency depreciation argument.
The upside is seldom ever mentioned.
Canadians who want to convert some of their money to a foreign currency will make out like bandits if the loonie keeps going up.
How many years has it been since anybody has heard the expression ” sound as a dollar”?
The curious fact that we only hear about the benefits of boogering a currency is all the indication I need to figure out that the benefits are exaggerated and accrue to big business which has the mouth pieces and media in it’s vest pocket.
Canada will have no trouble at all selling her natural resources so long as the world economy doesn’t collapse.
Request to interview federal scientist sparks 110 pages of government emails
DENE MOORE, THE CANADIAN PRESS, Published September 7, 2014 – 2:53pm
Don’t worry aws, Harper is on the way out next election. If polling indicates losing trend it is felt he will step down before writ is dropped. At least this is what I have read. Liberal minority….although if Layton was still alive the NDP might have got in?
Paulo
This is pathetic isn’t it?
It’s like I live in some kind of communist dictatorship where every word has to line up with the Politburo’s approved line.
Reality is out there Conservatives. Let the scientists describe it to us. If the facts get in the way of your policy preferences, then you need to do a better sales job, not whitewash the facts. Alternatively, you could deal with reality as it appears to actually be.
Sadly though, the Conservatives are infected with the idea that there’s some massive conspiracy to re-institute communism or something through global warming concerns. I have this personally from an aide to various ministers over the years who is a friend of mine. That’s what’s driving Conservatives to engage in such ridiculousness. This is the result of conspiracy theory mongering as best as I can tell. It’s kinda sad.
A couple from Izabella at FTAlphavile
Shale is not a ponzi, Part 2
Aug 29 15:39
The avoided energy factor
Izabella Kaminska | Sep 08 11:37
Watcher,
Watcher,
“The point is a Russian field (a collection of wells) has a decline rate. Then more wells are drilled inside that field to offset the decline rate. Then the resultant output from the field gets quoted, and if it’s less than last year the reduction is called “decline rate” and This Must Be Stopped lest the very fabric of the universe by torn.”
I agree 150% except don’t stop at Russian, its going on all over the world and the fabric of the universe is about to be ripped open right before your very eyes. So, we’ll just have to redefine “universe” and all will well again. Right?
Now that’s a clever idea. Redefine universe. I would prefer redefining the fabric. 1800 thread count for me.
Dear Ron,
On page 55, the graph “Russia’s quaterly production” confirms Russia had a maximum of production in 2013Q4 (could be the peak), then on the page 56 Russia is predicted to decrease in 2014.
Also, the increment of US production in 2015 is predicted to be much lower than in 2014. So US peak could be in 2016.
This is likely to confirm all your and other analyses.
Best regards,
Christophe
Chris, thanks a lot. It took me awhile to figure out which document you were talking about but it is the link I posted up top, the OPEC MOMR.
A headline item on Drudge (seems like some of us have been making these same points):
What We’re Afraid to Say About Ebola
http://www.nytimes.com/2014/09/12/opinion/what-were-afraid-to-say-about-ebola.html?emc=edit_tnt_20140911&nlid=745484&tntemail0=y&_r=1
By MICHAEL T. OSTERHOLMSEPT. 11, 2014
Michael T. Osterholm is the director of the Center for Infectious Disease Research and Policy at the University of Minnesota.
Buddy of mine posted in another blog something like this:
Cave researchers must be fully vaccinated against rabies. There are thousands of bats in the caves. The researchers are not bitten or scratched. The virus is so thick in the air that they get it by breathing.
Jeff,
Now that’s what I call scary stuff, really scary stuff. The interesting thing is that my doctor told me a few months ago that a world wide pandemic is not a possibility, not a probability is an inevitability and the only question is when. The problem is the speed of viral mutations/widespread world travel. Deadly.
Something being a worldwide pandemic is an inevitability. Swine flu spread fast enough to prove that.
Can Ebola go pandemic? Technically from what I understand, that just means two continents so if someone flew to one of the giant slum cities in Asia with Ebola they caught in West Africa (fortunately difficult now that airlines have cut service to Ebola countries) and spread it to someone in Asia, that would be a pandemic.
This could bite all the rich countries that don’t give a $@%^ about Africa in the butt.
Enbridge’s Line 9 pipeline reversal plan not OK’d by Montreal
Montreal Mayor Denis Coderre says Enbridge does not meet all conditions laid out to earn approval
CBC News Posted: Sep 12, 2014 2:36 PM ET Last Updated: Sep 12, 2014 6:25 PM ET
Propane consumption for drying grain in the Fall of 2013 spurred last winter’s propane shortage… and as well the Cochin LPG pipeline was down for maintenance.
This year the Cochin has been reversed to bring LPG into Alberta… and farmers in Alberta have wet grain to dry… of course the Cochin wasn’t reversed to help Alberta farmer’s dry grain! It was reversed because of the need for LPG to extract and dilute bitumen from the tar sands.
Anyway it will be interesting to see how this all plays out.
Grain harvest under threat from snow, rain
Harvest delayed just as it should be getting under way in Alberta, Manitoba
CBC News Posted: Sep 12, 2014 12:29 PM ET
Not a big fan of conspiracy theories, but it is amazing how flat the depletion rate (legacy depletion divided by total production) for Bakken oil has been since December 2013.
The EIA is just guessing at those numbers. They really have no idea what the true depletion rate really is. And their numbers change a little every month.