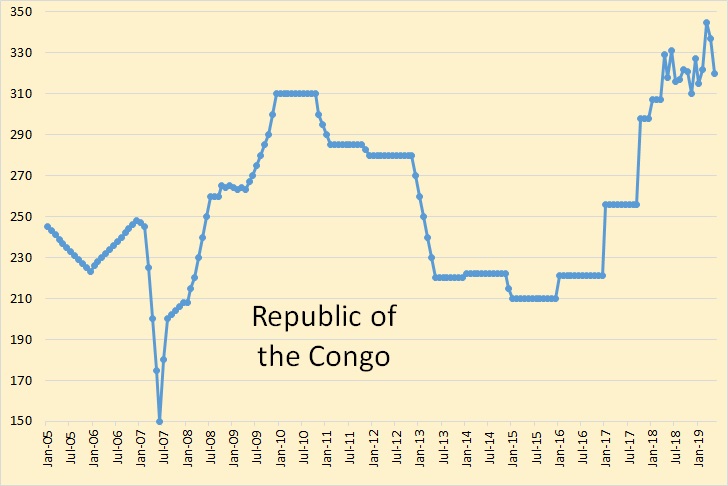
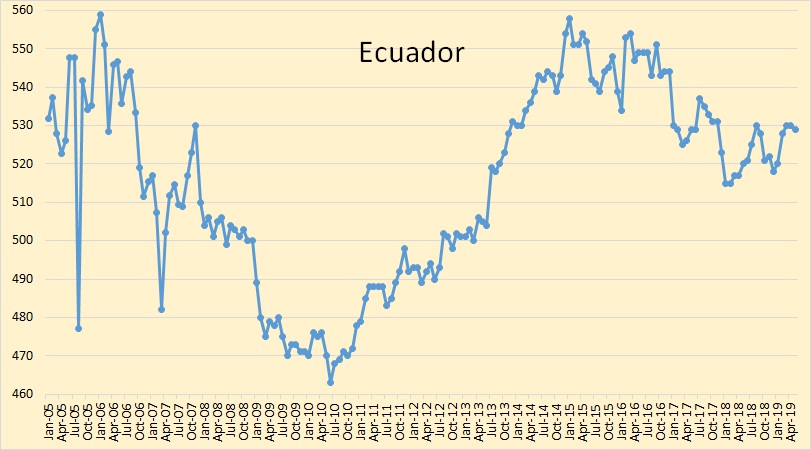
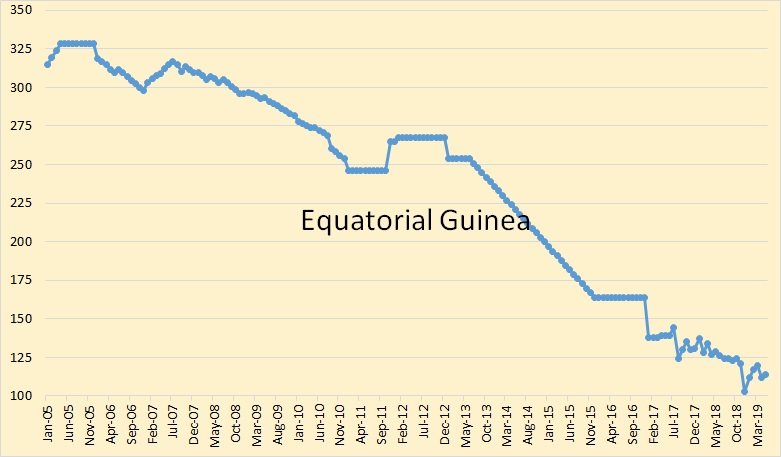
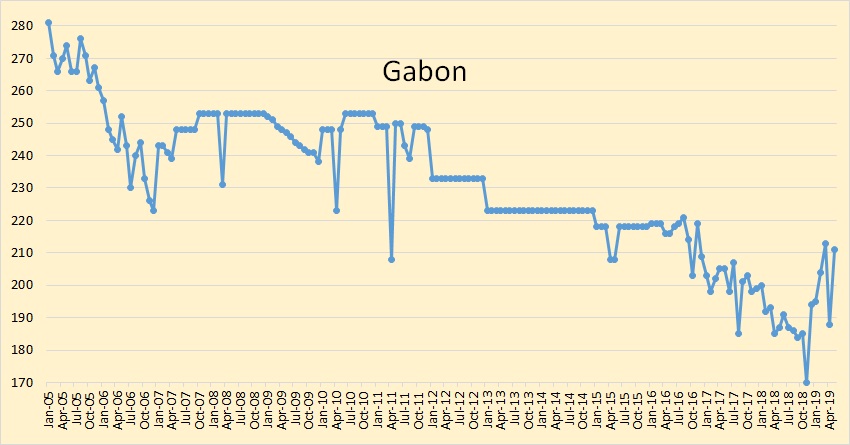
The below charts, unless otherwise noted, were taken from the OPEC Monthly Oil Market Report. The data is through May, 2019 and is in thousand barrels per day.
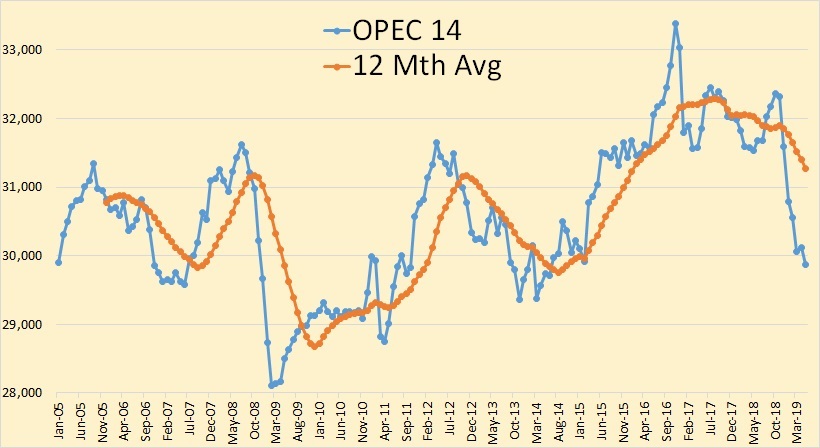
OPEC crude only production was down 236,000 barrels per day in May but that was after April production had been revised upward by 82,000 bpd.
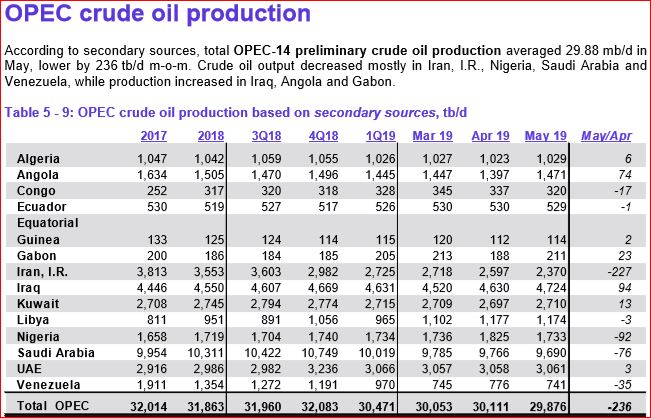
Iranian April production was revised upward by 43,000 bpd and Saudi Arabia April production was revised upward by 24,000 bpd.
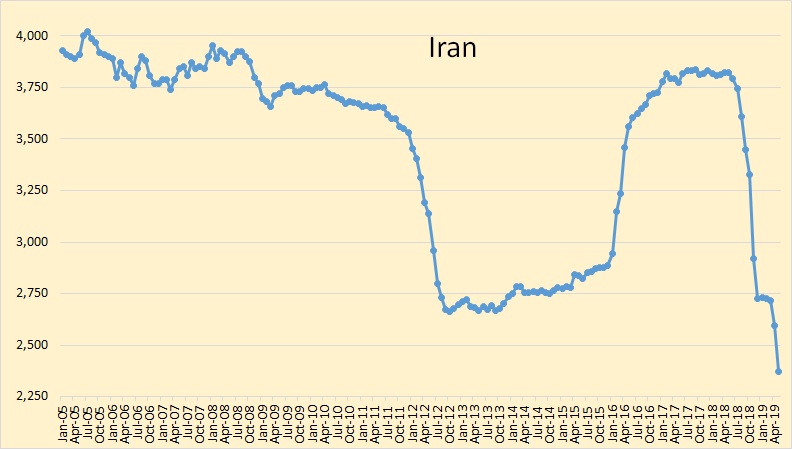
Sanctions are really starting to hit Iran hard. And they are trying to counter-attack against tankers in the Persian Gulf. This can only get worse.
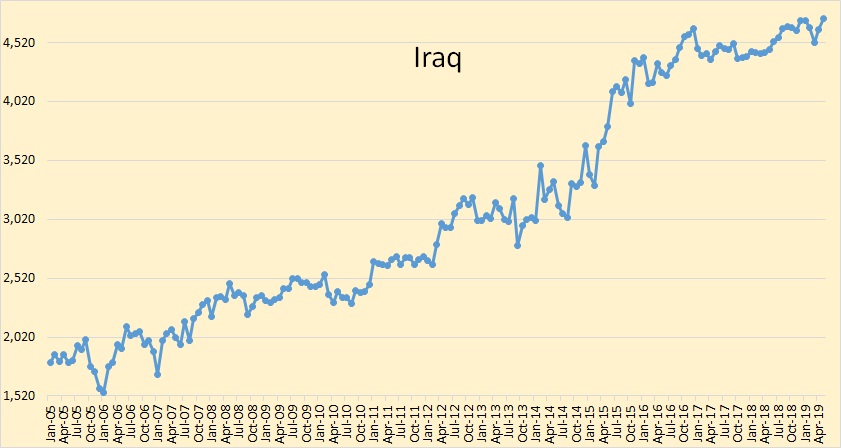
Iraq, totally ignoring quotas, reached a new all-time high in May of 4,724,000 barrels per day. There is no doubt that Iraq is producing every barrel they possibly can.
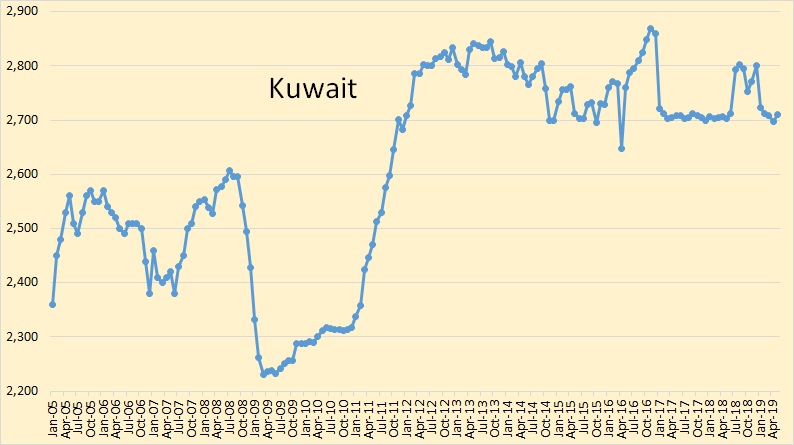
Kuwait, I believe, is also producing at the maximum possible level.
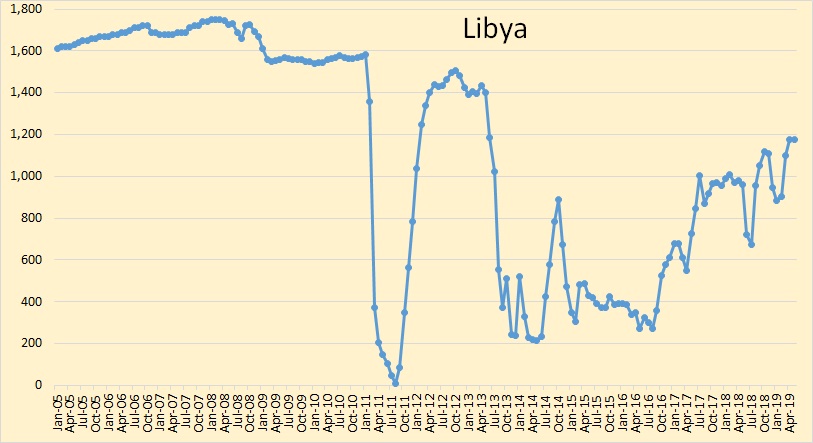
It seems Libya is winning the battle with the rebels. Their production is the highest since 2013.
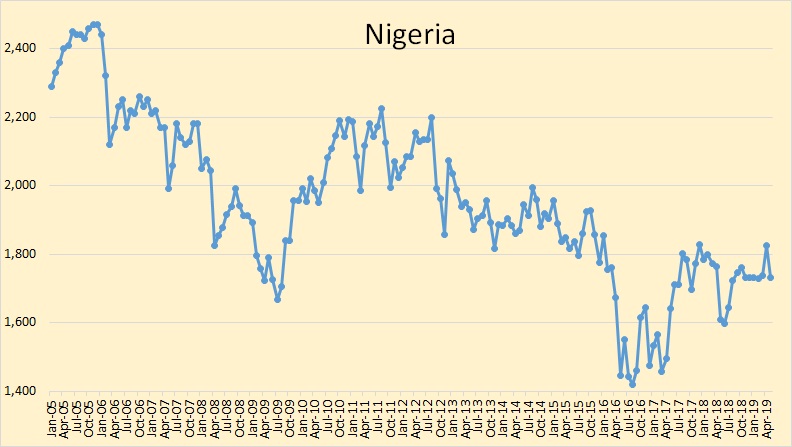
Although Nigeria still has some rebel problems they seem to be at a low level as they are not exempt from quotas. Though they seem to be paying little attention to their quota.
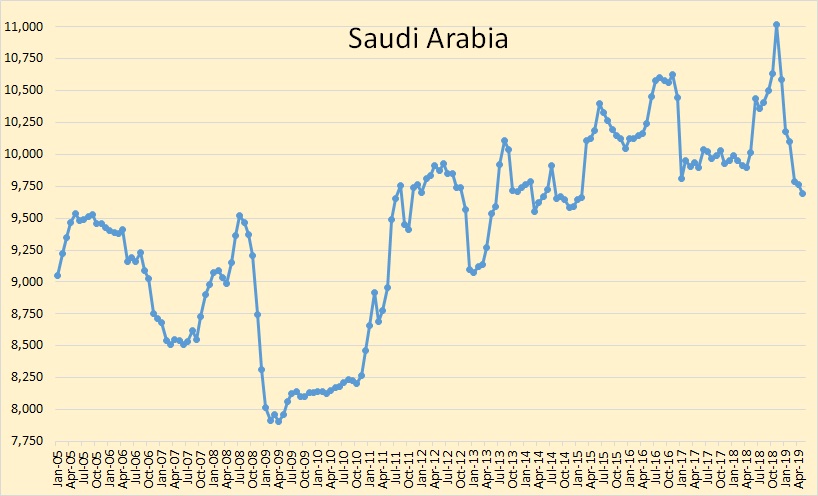
I can’t figure Saudi Arabia out. They are producing 621,000 barrels per day below their quota.
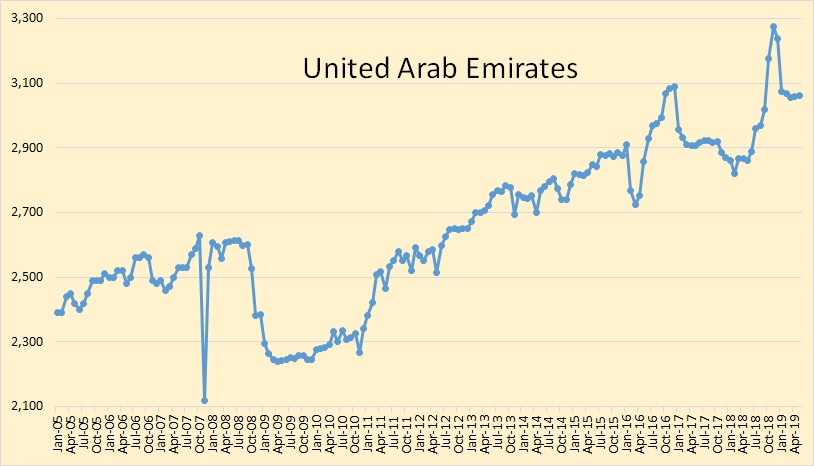
Not much to report from the UAE. They seem to be holding steady.
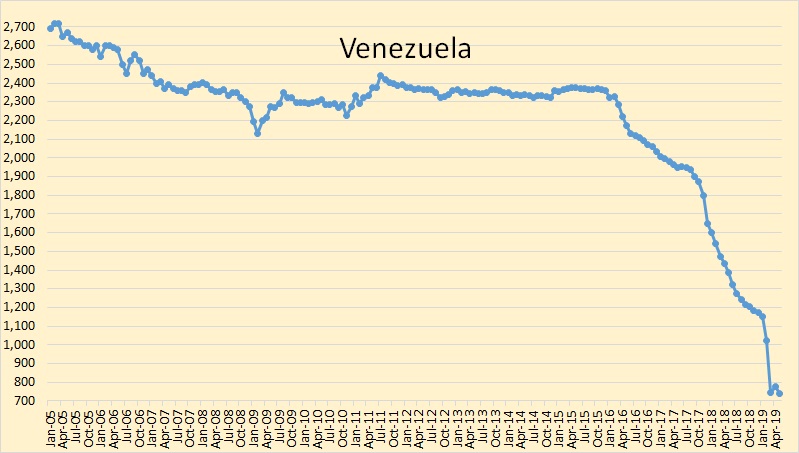
Venezuela seems to have stopped its production slide, temporarily anyway.
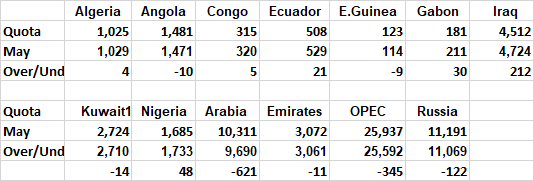
Iraq is 212,000 barrels per day above their quota while Saudi Arabia is 621,000 bpd below their quota. I really don’t think anyone is paying any attention to their quota and just producing what they think they should, or perhaps what they can.
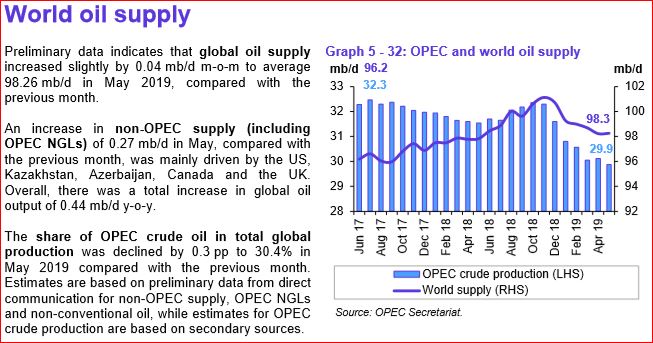
I am not so sure OPEC’s estimate of World total liquids is all that accurate. Not through May anyway.
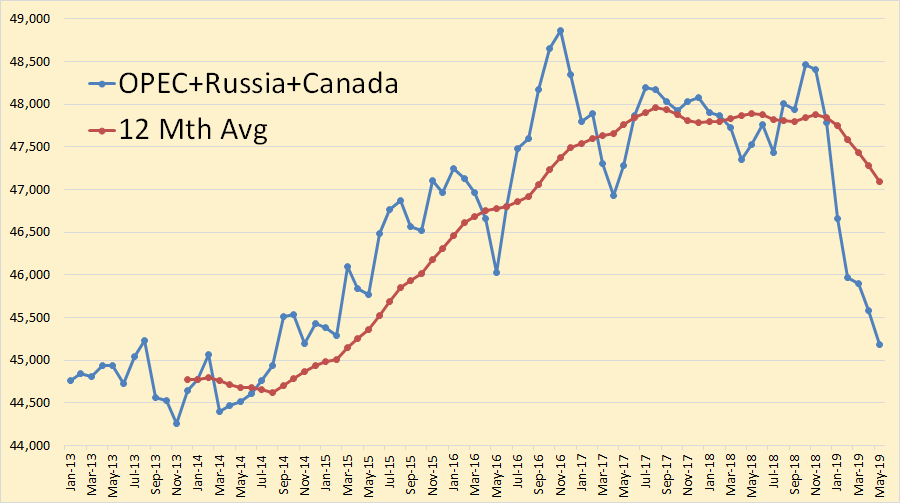
The above data for Canada, through May, is a projection by the Canadian National Energy Board and may not be completely accurate. Nevertheless, this is about 55% of World oil production. The average for the first five months of 2019 production is 2,000,000 barrels per day below the 2018 12 month average. And this production level will likely level out and hold pretty close to May production level for the rest of the year. I just don’t think it possible that 2019 will have a higher production level than 2018.
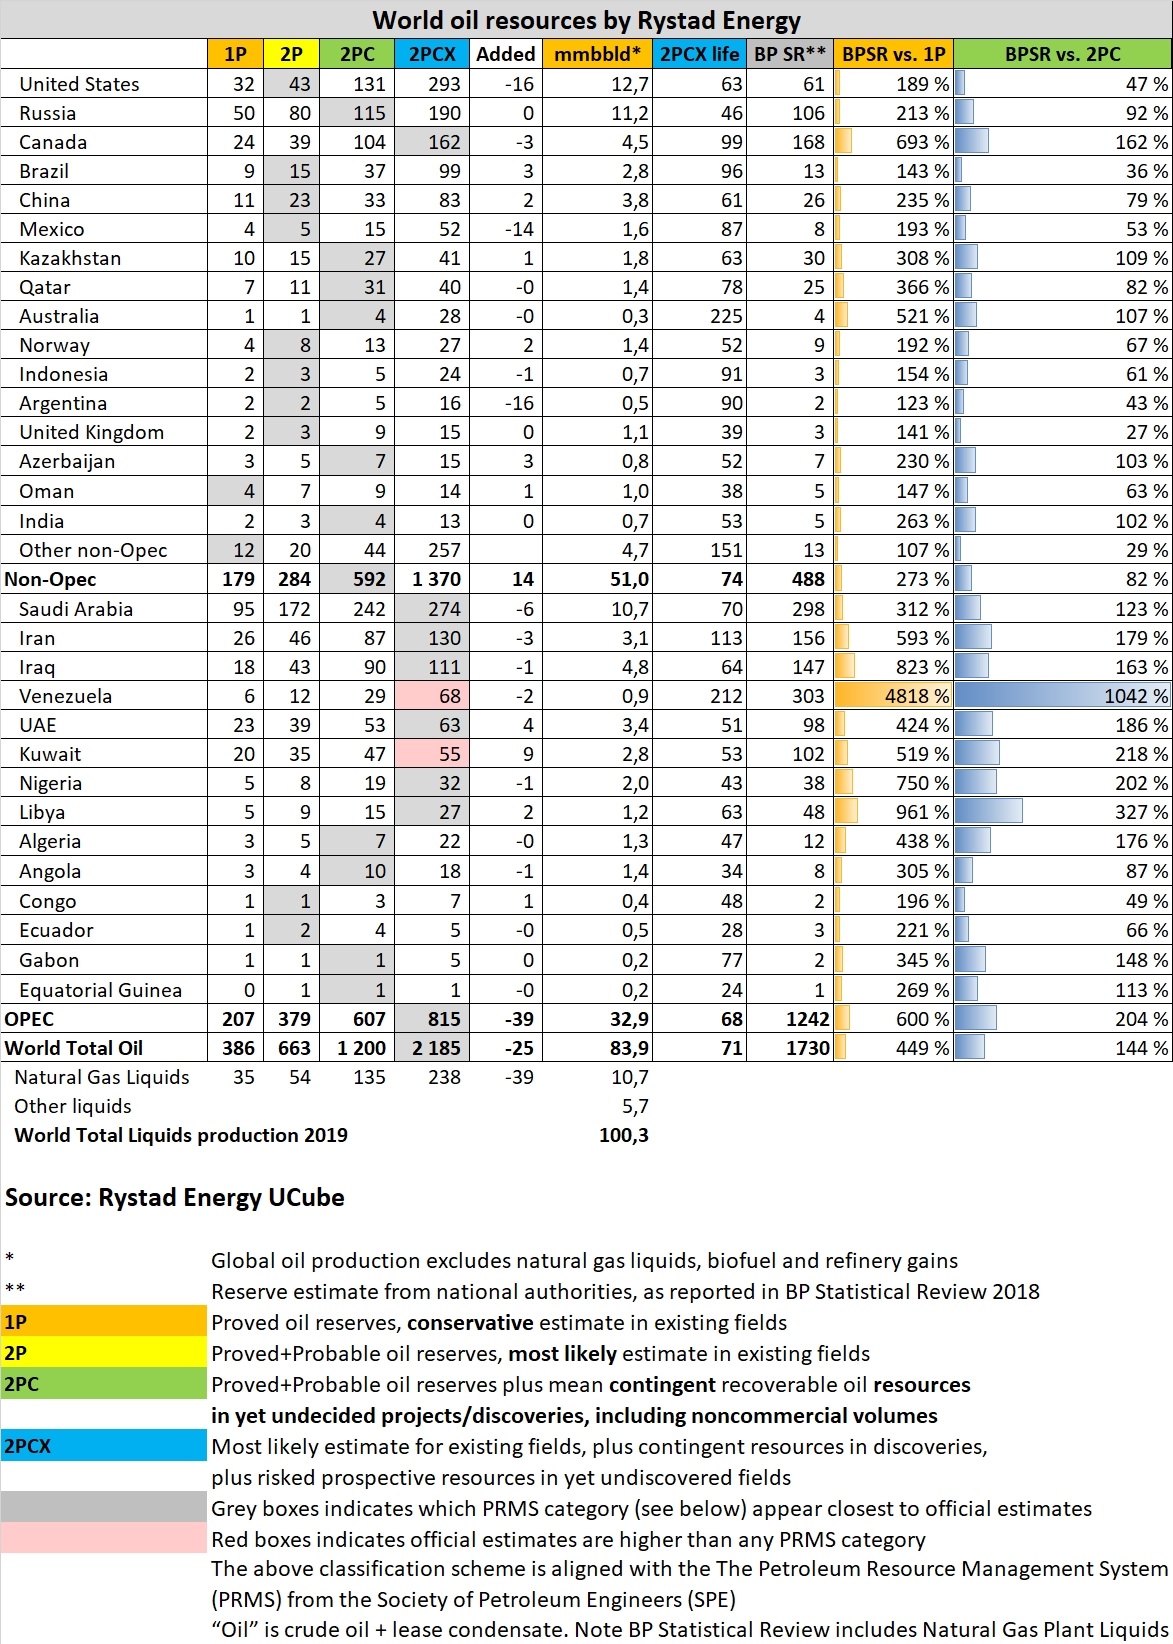
This chart can be found at: World Oil Reserves by Rystad Energy. I have absolutely no faith that the above chart is anywhere close to being accurate. Nevertheless, I post it for your information.
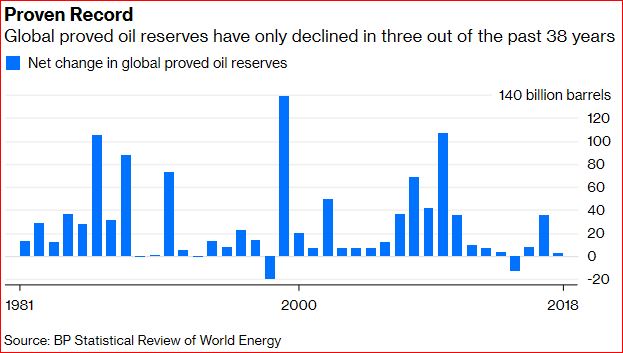
The above chart if food for thought. Just how accurate are those paper additions?
I found the chart at What Are Proved Oil Reserves Really Trying to Prove?
Long a measure of power and wealth, they lose their meaning in a world of peak demand.
Peak demand is, in my opinion, a total farce. Demand is forever increasing and peak demand is forever in the future. Peak supply will hit long before peak demand.
Not a good sign that oil production, inventories and oil price are all falling in 2019.
https://bakerhughesrigcount.gcs-web.com/static-files/faa8489a-0933-4976-93a7-f36a31c6502a
Rig count down another 6 in oil, Texas lost 6
Lots of data that points to flat US production, and looking to stay that way for awhile. EIA is the only production increase, and that’s just in their imagination.
US Rig count down 5 gas. Permian down 5 rigs. Looking at the rest of the states, it looks like the Permian is down 5 gas rigs because if they are oil rigs, the rest of the US would have to be plus 5 oil and down 10 gas, which looks unlikely. Why would there be gas rigs in the Permian when they are flaring the gas?
Perhaps there is someway mathematically that the Permian could be down 5 oil.
PS: Maybe the Baker-Hughes web site, where I looked, has a misprint. It says down 5 gas, and down 1 oil.
Could be. Not a lot of gas drilling in the Permian, they are just flaring gas. Yes, probability of oil is much higher.
Probability is that is the wells Apache pulled out of their Alpine High area. Drilling for oil and gas, but mostly produced gas. Read an article on it, in that they recently shut down that activity. But, yeah, I did not read it carefully. I’ve never read about any gas wells drilling in the EF, but they can, because it does have a gas window. So essentially losing oil and gas rigs to the tune of about 6, because the initial hope would be for oil.
I wondered in the past on why Apache made such a hoopla over their great Alpine High find. The amount of oil was substantial, but far from enough to pay for the drilling. Gas sure wouldn’t, not in that area. Probably, in ten to fifteen years, it will be more valuable. All gas will.
Correction, rig count down 6 in gas. Or, oil and gas as they were in the Permian and EF.
Peak demand is the same thing as peak supply. Oil is too hard to get from the ground for the world economy to want it.
Yes Banned. With the tiny little difference that they will sell it as a climate protection success: Yeah, we’re strong and simultaneously protecting the environment. Thank you Greta! Peak Oil was a scam and will never ever happen … And happily, the populace will sink into green, ecologically correct poverty.
Yeah, but he has one point right. It’s too hard to get out of the ground at this price. Two things, actually. Because were right at peak oil, demand (measurement wise) will equal peak supply (after inventory depletion).
Regarding Saudi Arabia being 621,000 below quota: I wonder what the price of oil would be if they were pumping at quota. They probably are losing money, but they may also be taking into account the value of their reserves, which would go down in value more than the money that they are foregoing.
I really don’t think Saudi Arabia is shouldering all those cuts by themselves just to keep the price up. There is a lot more to this than just quota cuts.
I agree. The only political scenario I can imagine is MbS doing it for Trump and Kushner in exchange for them banging the Iranian war drum, but I wonder if he even has the authority.
Hi Ron – a loss of 621k bbl/day….water is starting to hit some of the MRC laterals, IMO.
Director´s cut is out. ND down slightly in April.
However, that was after March had been revised upward by 1,622 bpd and February had been revised upward by 1,042 bpd. But it still looks like North Dakota is flattening out.
Revisions
Oct-18 -2
Nov-18 9
Dec-18 16
Jan-19 34
Feb-19 1,042
Mar-19 1,622
Eagle Ford Shale/Tight oil is also peaked out. Along with Andarko region as the EIA likes to call it (basically Oklahoma). The only plays left are Permian and Niobara (Colorado). With only 500k b/d added this year from the Permian, hard pressed to see supply catching up unless OPEC+ (mainly Saudi Arabia) adding supply again.
Many of the Shale stocks are in serious trouble, especially those that focus in the Bakken. Whiting and Oasis are now below their CRITICAL SUPPORT LEVELS that have held for the past five years. Oasis is trading at $4.64, below its $5.00 critical level and Whiting is trading below its major support level of $16.
We must remember, Whiting did a 4/1 reverse split a few years ago, which is a negative sign for a stock. If we remove the 4/1 reverse split, Whiting’s stock real value is a lousy $3.94 a share. I see both Whiting and Oasis becoming PENNY STOCKS.
Furthermore, most of the Bakken shale stocks are currently trading at less than 10% of their peak value in 2014. However, Continental Resources is the exception for reasons I can’t get into, which will likely come to light in the near future.
Let’s just say, there’s another MAJOR ENRON type of event to take place in the U.S. Shale Industry.
Regardless, U.S. Shale stocks are underperforming the majors and will likely to continue as oil prices go lower.
I see most shale companies becoming penny stocks in the future.
steve
Here’s the chart that shows the DEATH of Sanchez Energy. Sanchez Energy is the WORST of the WORST and is now trading at a mere 12 cents a share compared to its peak price of $38 back in 2014.
Sanchez Energy is ranked last for FREE CASH FLOW to CAPEX ratio in the industry, but I see many of the shale stocks following the same pattern over the next several years.
However, things could SPEED UP if we get the ENRON EVENT to unfold in the U.S. Shale Industry sooner than later. This is going to be a BIG ONE that destroys the notion of U.S. energy independence forever.
steve
Oh, Goodness! Don’t tease us! What is this Enron event???
Guy, you have to be the only person in the US who has not heard of the Enron event. Or perhaps you are not in the US. Or perhaps you come of age well after 2001, the year of the Enron scandal. But Enron was on every news channel, every night, for months.
But Enron was only the second biggest story of the year. 2001 was also the year of 9/11.
Enron scandal, series of events that resulted in the bankruptcy of the U.S. energy, commodities, and services company Enron Corporation and the dissolution of Arthur Andersen LLP, which had been one of the largest auditing and accounting companies in the world. The collapse of Enron, which held more than $60 billion in assets, involved one of the biggest bankruptcy filings in the history of the United States, and it generated much debate as well as legislation designed to improve accounting standards and practices, with long-lasting repercussions in the financial world.
I’m 70, I am aware of Enron, he cited an Enron event. I asked what it (the event) is. Geeze! If you look at my sentence closely, I did not ask what Enron was, I asked what the Enron event was. It’s not semantics?
Hey, the Enron event was the Enron Scandal. I would have thought that was self-evident.
Will the shale oil scandal equal the Enron scandal? That is the question Steve is asking. Well, it could be just as important, with just as many people getting bilked out of their money.
Dammit, yes, it could be just as big and as important.
GuyM, I knew what you meant. You were asking what Enron-like event was on the horizon.
Yeah. I was talking to Steve, and he clearly understood what I asked.
Ron,
I believe GUY wants the details on the upcoming “Enron” event. However, that will have to wait as I am not at liberty to tell. But, I can say this….
A LOT OF HEADS ARE GOING TO ROLL.
Energy Analysts are guilty of not CHECKING THE MATH or figures company(s) are publishing.
steve
As a CPA who has been in auditing in the past, I know of one balance sheet item that can cover a lot of ills. And, it no real secret. Valuation of their existing oil property. I know it is BS, you know it is BS, and when the company goes under, which probably many will within the next two years, everyone else will know it. Is this the big secret?
PS, the government is the worst in the world to help to propagate this BS.
You have said this before on this forum regarding continental. But nothing came of it. Still to come?
evo.
I too have wondered about CLR.
Tons of debt. Never any cash. Wells aren’t clearly superior to WLL, OAS, QEP in the Bakken.
The other major CLR area of operations is OK. I have never been able to make many of those work financially based on actual LOS I pulled off energynet.com and other marketing firms. Haven’t there been some recent collapses in the SCOOP? Roan comes to mind. Alta Mesa appears to be a case of fraud. Both are OK shale.
CLR is closely held by Harold Hamm. I think he owns 70%+ of the stock.
Just don’t understand why CLR has held up while Whiting, Oasis, QEP, Encana etc, are hitting critical levels.
A crash to $40 WTI for a few months and I think the above names could all fall.
But again, just speculating. I don’t have any inside info whatsoever.
Wow! Maybe people should pay your subscription fee, if you have any, or if not at least show up and maybe generate some sort of advertising revs, or Patreon whatever, lest there be no value to this self-promotion on a non investment blog.
Watcher,
We all appreciate you being the SCHOOL MONITOR,
Well done,
steve
SRS.
How about the following:
QEP
RRC
SWN
Antero
Gulfport
LGCY
Encana
Nabors Industries.
About any other service company not named SLB.
shallow,
Gosh, what a mess. QEP, RRC, SWN, LGCY, ECA (Encana), AR (Antero) & GPOR (Gulfport) are all mostly 10-20% or less than their peak prices in 2014. LGCY is by far the worst performer as it is trading at 15 cents a share down from a high of $25 back in 2014.
Look at the massive volume this week. NOTE, this is a weekly chart so each ticker represents one week of trading. LGCY traded 250 million shares. WOW. Seems like someone motivated to GET OUT.
UPDATE: I just looked at LGCY’s financials and I smell a RAT. The company has posted negative free cash flow since 2013 at a total of $1.3 billion. But, magically, their Long-Term Debt fell from $1.3 billion to $416 million. However, $883 million of their Long Term Debt is now CURRENT. Will be interesting to see if they have something to sell or will get some POOR UNWORTHLY SLOB to continue the Ponzi.
Ah…. LGCY is doing a restructuring here: https://www.legacyreserves.com/2019-06-14-Legacy-Reserves-Inc-Reaches-Global-Restructuring-Agreement-With-RBL-Lenders-Second-Lien-Lenders-And-Noteholder-Group
Likely buy a little time at most.
Interestingly, most of the charts look quite similar. However, Antero & Gulfport charts are the best candidates for PENNY STOCK HEAVEN first versus the others.
But, they ALL will likely hit PENNY STOCK status unless some POOR UNWORTHLY SLOB company buys them out.
steve
Unprofitable mature companies should be considered only as liquidation value, which means the equity for a going concern with a lot of debt to pay first is worth zero. To the extent it has any value on the market it’s as trading vehicles or gambling on takeovers. Which the majors have gotten wise to and aren’t in a hurry. Wait for BK, buy the assets you want. XOM isn’t a charity.
My feeling is is that while the EIA may not be wise to what undrilled acreage is worth, the big boys with buildings full of geologists whose jobs depend on making the corp money, they know better. Sweet spots are drilled first, everyone does that. You’re dumb if you don’t. The lower tier acreage is most of what these guys are selling after several years of buildout. No reason to buy that in bulk.
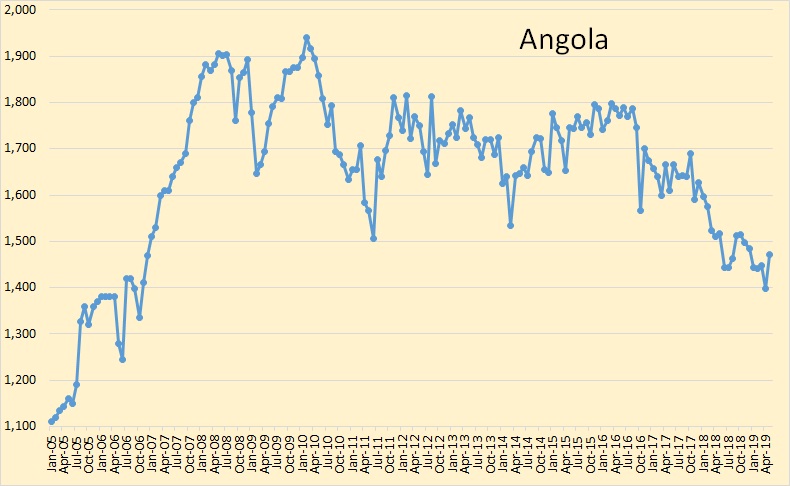
The Angola decline is important because China imports oil from there. I have it in my latest post:
10/6/2019
World crude production outside US and Iraq is flat since 2005
http://crudeoilpeak.info/world-crude-production-outside-us-and-iraq-is-flat-since-2005
Your conclusion is dry as a bone:
When US shale oil peaks and Iraq can no longer increase production[,] there will be some surprises for a complacent world which should have used the 2008 oil price shock as a warning to get away from oil – voluntarily.
Really Michael? Are you saying there will be no surprise when peak oil happens? No surprises? Everything will just be business as usual?
Just what the hell are you saying? What does “Your conclusion is dry as a bone:” mean? Please explain yourself?
His tone–like westexas’s– is delightfully dry. “Dry” as in laconic.
In plainest English, he’s saying we’re fucked, but he’s no drama queen about it, like Kunstler, et al.
Thanks, Matt, your charts are very intriguing. Most countries are well past peak. But how about the big countries. That is the USA, Saudi Arabia, Russia, Iraq, Canada, and Brazil? The OPEC 14 peaked in 2016. So we can write off Saudi Arabia, Iraq, Kuwait, the UAE, and Iran. That is, all of them may not have peaked, especially Iran, but all are close and combined, they have peaked. That is, especially when you count in the rest of OPEC, which is in steep decline.
Russia is close to peak and may have peaked last year. At any rate, Russia will not increase in production by very much. Canada has not yet peaked but any increase in production from Canada will not be significant. Brazil may have a bit to go before peak but not a lot. Bottom line it is all about the USA and the shale oil phenomenon. But even if shale oil keeps increasing, it will likely not keep replacing the decline in the rest of the world. But when shale oil peaks, or even slows down, it’s all over.
I am curious when that registers with different groups of people. I think oil industry folks already see the future and are trying to cash out before panic.
I think too many politicians don’t have a clue and aren’t preparing.
I would say most consumers don’t know enough about the industry to see the future. There are fracking protests among people who see drilling moving into their suburban neighborhoods, but they are talking about perceived safety and noise, not the possibility that these operations will go bankrupt and leave them with a mess.
Peak oil isn’t mentioned much in the mainstream media since LTO gave the industry a temporary boost. So it isn’t on most people’s radar yet.
The decline rate for the first group of nations (steadily declining since 2005) has an average annual rate of decline of 3.5% per year from 2005 to 2018. Many of these nations have smaller onshore fields (relative to Persian Gulf supergiant fields) or have much of their output from offshore fields, so in theory the overall we would expect the decline rate would be relatively high. Much research (from Uppsala) as suggested the supergiant onshore fields would tend to have lower decline rates on average than smaller onshore fields and offshore fields.
We will not know if this proves to be the case until these fields start to decline (though data will be lacking, so we may know very little until 2035 to 2040).
Dennis, as far as Saudi Arabia goes, these fields started to decline early in this century. Their wells were mostly vertical wells with the lower level of the vertical mostly in water. The decline rate averaged 8% in those days. Then Saudi initiated a massive horizontal well system, shutting down all their old vertical wells. They managed, according to their own words, to get the decline rate down to almost 2%. That was in 2006.
We don’t know the decline rate today but Saudi officials have complained that “the decline rate for fields around the world is increasing”. And I don’t doubt their word.
Dennis.
Once the water line hits those MRC laterals, it’s fu*king over. A loss of 621k bbl/day may be the first sign of things to come.
Peak oil was November 2005. Pseudo Peak was 2018-2019, per Ron’s charts.
Those shale areas are going to really provide some excitement in terms of yelling and screaming in the next year or so.
Mike,
The water will hit the laterals one at a time, the odds of it happening all at once is small. Northern Ghawar has started to decline already at about 4% per year.
Not necessarily Dennis. The laterals in any field will be placed right at the top of the reservoir. Of course some will be placed further down the anticline, but even there many will be placed at almost exactly the same level. The water will start hitting them, a few dozen per month, until it hits most of them very near the top of the reservoir, at almost the same time.
I believe in the reservoir the water levels vary, it is not like a big underground lake, it quite a bit more complex. In any case as you said their are 5 fields and I doubt the interconnections are very simple. Northern Ghawar is probably down to about 2.1 Mb/d (3.8 Mb/d for all of Ghawar minus 1.7 Mb/d for the central and southern parts of the field). Perhaps it will happen all at once as you seem to believe. A comment from any geophysicists or petroleum engineers would likely enlighten us both.
What is the likelihood that most or all of the MRC wells in Northern Ghawar water out over a short time frame, say 1 to 2 years? I would say less than a 15% probability.
Hi Dennis;
I don’t doubt that the field geology itself is quite complex, but if the separate fields are significantly interconnected then it appears to me that the water level will even out -more or less- to a plane over time. Those fields have been pumped full of high pressure water for decades, and in a high permeability series of fields then there has been plenty of time for water to distribute itself more or less evenly over the oil-bearing rock volumes. Of course, all IMO.
Mike,
I think the geophysics might be bit more complicated than we think, we would need a geophysicist to comment, this is beyond my level of expertise.
How much does the infamous Ghawar oil field have left in terms of increment production? I assume it’s already at peak production?
Ghawar was at about 5 Mb/d in 2005, recently it was at 3.8 Mb/d. If we assume decline started in 2008 (we don’t really know) and decline was steady over 10 years, that would suggest about a 2.7% average rate of decline (assuming simple exponential decline). This is just a WAG. Not much data on individual field output after 1980 in KSA.
That is if you count Ghawar as one supergiant field. Ghawar is really five different fields. The northern three fields are in steep decline but the lower two fields are not likely in decline at all.
Long, long ago, 2007 in fact, Stuart Staniford undertook an exhaustive analysis of Ghawar from the then available geotechnical data. Here are a few links:
http://theoildrum.com/node/2470
http://theoildrum.com/node/2441
https://econbrowser.com/archives/2007/05/northern_ghawar
Have not seen data on output from the many fields of Ghawar from 2005 to 2018.
If you have it it would be interesting. As it stands the data I gave earlier is all I have. Typically the URR and output data is given for Ghawar rather than breaking out the various individual fields.
Been nosing around the past 24 hours for information about Ecuador and what happened last year that generated a substantial increase in oil consumption.
Item one, no spectacular spike in GDP.
Item 2, there seems to have been some flow of money from US AID, but tracing it down for 2018 is getting buried beneath the quid pro quo story as regards Julian Assange. That, of course, would postdate 2018’s consumption. Not clear how such a flow of money would translate into oil consumption.
Item 3, there is no evidence of new refinery coming online in 2018 or any spike in imports that’s such a refinery might have generated, which would look like consumption. Their government has proposed a new refinery with about 150,000 BPD throughput.
Not in place yet and thus we do not have any idea, still, of why they spiked consumption.
I know I am going against the grain of the oil experts, but here is my very conservative take. I think the estimates for demand increase are always overstated, so I will use 0. OPEC plus down an average of 1.2. Add in .75 for Ven and Iran, because it is basically untraceable. US up zero to .2. Yeah, we will see some serious draws. Regardless of the hogwash EIA reports.
I know we have demand increases, I just don’t think they are all that predictable when they occur. Besides, from here on out, demand increases will mostly be zero, because they can’t get over supply.
We will rock along with these low prices for awhile longer, because the stupid EIA weekly does not show world inventory draws. The independents will get increasingly weaker. Not enough external funding, and too little internal growth. Not all, but most. It’s a perfect storm for the majors, who will be able to pick and choose. The majors projected increases will largely come from what they pick up. And they Are Not interested in increasing exports. Products, yes. Crude, no. We may be at the apex of shale oil increase, now. If not now, then soon.
Just my guess, but I wouldn’t take it to the bank. Well, I guess I did, a little.
If oil prices remain low I think your analysis is correct.
I do not think oil prices will remain low if the supply remains low as you suggest.
So tight oil output will increase when oil prices increase, in my opinion. So if my guess of $70/b for oil by Oct 2019 is right with continued increases of $8/b annually up to 100/b in 2023, we will see tight oil output increase.
Well, it’s downright impossible to argue that an increase is not in the cards at those prices. The only argument then, is how much next year, as this year is done. I don’t know, there are pieces of the puzzle that I predict, but they are not there yet.
And I would guess your price increases are in a conservative range.
Guym,
Prices are a WAG based on recent trends. No idea if it is conservative, it is a bit higher than AEO reference case, that case is conservative imo.
I agree this year will probably be flat. Next year if my oil price guess is correct my guess is 800 kb/d +/-200.
US crude oil production: the weekly adjustment (line 13) could be explained by an increase in wells started in May ??? But as I’m not a Rystad Energy subscriber this data is new to me…
June 13th OPEC MOMR page 52/53
A chart using Rystad data for the Permian to May
Green line = wells starting to produce oil
Chart: https://pbs.twimg.com/media/D9HT-ByWwAEHAeM.png
US crude oil production, Monthly vs Weekly data
https://pbs.twimg.com/media/D9HcQ_NXYAEhWgV.png
Ok. I’m confused. Wells completed start to produce, so what’s the green line? Are we having spontaneous production? DUCs still have to be completed and reported to the RRC. Which would not be above Rystad. They have started to become worse than EIA.
RRC does show about 150 well completion uptick in May, which should show up in June as a slight increase. It’s pretty marginal though. As previous months were down.
And, that plus line 13 is most interesting.
I suppose “started” means put on production and flowing. I wasn’t under the impression that operators waited any meaningful time to open the valves after finishing the frac. Even with massive multi-well pads, the completion jobs don’t take months, and it’s trending down with zipper fracs and the focus on efficiency. Perhaps someone here that’s closer to operations can shed some light.
I recreated the graph in excel, and it implies operators completed ~600 wells more than they turned to sales from May 2018 to March 2019 — roughly $6 billion of dead capital.
I don’t think a new pipe opened in April to take the extra volume (e.g. https://www.reuters.com/article/us-usa-crude-permian-basin/new-pipelines-drain-west-texas-crude-stocks-to-four-month-low-idUSKCN1QB1Y2 says 300k bbl/d from Sunrise expansion in November 2018 and 200k bbl/d from Seminole Red NGL-crude conversion in February 2019).
Maybe Rystad is working backwards from the inventory growth in the EIA WPSR and the outsize adjustment factor implying huge growth starting in mid April. The data doesn’t quite make sense the past few months.
Also FWIW, The RRC completions numbers haven’t been reliable for me, I think on account of late reporting and no revisions etc.
cmg,
Agree on RRC completions, they are pretty erratic, probably some late reporting and such, which is why I use it to give a 12 month trend. I focus on new drill oil completions for the Permian basin as it is responsible for most of the growth in Texas output and about 2/3 of US L48 onshore output growth. For the past 12 months the average has been 353 completions in the Texas Permian basin with a slight downward trend of about 40 fewer completions per year (least squares slope for new drill oil well completion data from June 2018 to May 2019).
GuyM,
It is possible “started” means a combination of new drill completed wells and wells that have been reworked or just brought back online after being down for maintenance or temporarily abandoned due to low prices. A guess on my part.
I noticed that graph in the OPEC MOMR report and was confused as well. And maybe Rystad is being used as a scapegoat here…”the numbers were wrong, but that is all on Rystad”.
Other than that SA export numbers are up by 0.5 mb/d for May compared to April as stated by tanker tracking. That contradicts the lower stated production for SA in the OPEC report. Iran exports probably 0.5 mb/d now (tracked)+ some not trackable. Domestic usage a bit more than 1 mb/d, that means their storage is filling up with about 0.5 mb/d. If satillite photos show that storage is not filling up anymore going forward, that probably means their smuggling methods are successful. Because, I doubt they reduce their production unless they really are forced to.
Another thing to note is that Brazil only had 5 offshore rigs operating in the latest rig count. That is not enough for any growth, more likley a production decline will be the result. The downfall of activity in Brazil is largely responsible for the big struggles offshore service companies have been going through for some time now. Rig rates are below operating costs now for example.
Energy News,
I like your monthly vs weekly chart. Your approach is more sensible as we can’t really deduct this number from stock because over time (1980 to 2019) it adds up to about 2 Gb of oil, so we can’t realistically deduct this for stocks as the US would have negative stock levels (an impossibility).
So it seems the US has been underreporting it’s output since 1980. Thanks for pointing this out.
OPEC report says that US inventory built by 52 MM barrels. Propane and NGPL increased by about 30 MM barrels.
I think plant condensate, which is considered NGL by EIA, has entered the refineries as crude and this will make more gasoline. The price of ethane, propane and I assume plant condensate has crashed.
The lease condensate inventory is rising and that is showing up as crude increase. Lease condensate is considered as “crude” by EIA. I find little difference between lease and plant condensate or NGL in terms of composition.
I also find loss of Venezuela import in March correlating well with adjustment factor going up in EIA weekly report with a month lag.
Plant condensate was sold to Venezuela. What is happening to it now?
The whole inventory increase in May can be explained by NG increase and condensate and NGL recovery.
Good points.
PS, I looked you up. Don’t think I want to argue anything about oil composition with you.
Line 13 might be partly a paperwork error. Someone on Twitter said that the EIA is going to make their paperwork easier to understand. This should prevent any mistakes that could be made when oil companies fill in the EIA’s various forms.
Except for the monthlies, EIA is a paperwork error.
The monthlies are a good and accurate starting point of where we are, but they are two months behind. In between, I have RRC drilling completions and permits. Plus, the activity I observe in queries. Not real accurate, but trends are fairly apparent. RRC production is basically flat since March EIA monthlies. That is, the US is within 100k barrels a day from 11.9 million barrels a day, unless the GOM temporarily coughed up more.
Relevant to this issue is a matter I have not seen addressed. Specifically the gas-to-oil ratio, or water to oil ratio is a number that’s generally available for oil wells.
I’ve seen no discussion of condensate to gas ratio for gas wells. Since condensate is an increased percentage of the liquid we call oil (vs crude), and we have in the past watched parameters like water cut and gas to oil ratio to determine the future of a particular oil well, one would think a similar parameter indicating the wetness of the gas from a gas well would be a fairly significant item to know if you are trying to know US oil production upcoming.
Condensate collected from gas wells is called plant condensate. EIA defines it as “not crude”. Lease condensate is called crude. Chemically there is little difference.
Now ethane, propane prices have crashed and you can expect plant condensate price as well.
Refiners can buy plant condensate at low price and make gasoline out of it. If they have done so, now plant condensate becomes suddenly crude input.
Lease condensate may be building and masquerading as “crude” build.
I do not expect the weekly adjustment factor in EIA report to go down in the near future.
We are at all time inventory levels of “other oil” which comprised mostly NGPL.
https://www.eia.gov/petroleum/workshop/ngl/pdf/definitions061413.pdf
I really appreciate your input.
Our anecdotal experience supports this. We are being paid the closest to WTI that we have since 2004. We are selling mostly light sweet 31-36 API. Also sell some high 20’s API, which is selling equal to the 31-36 range.
Yeah, mines at 39. Still low enough. EOG has a special deal on the EF, and while it is at a discount to MEH, it’s still somewhat higher than WTI.
Is this what is behind some of the unaccounted for oil in the inventory build? Light stuff (plant condensate) not included in production data but in inventory data, is this correct? How much of the inventory build is medium or heavy?
Basically, all is light from the Permian.
https://seekingalpha.com/amp/article/4269192-permian-induced-oil-glut-works
Specifically from the Delaware Basin. Very high API and condensate. I heard it’s getting it’s own designation to distance it from WTI, which is in good demand.
So everyone will be concentrating on this rising, or not going away, while the rest of the world’s inventory will be dwindeling. Pretty cool, huh?
The independents have found another foot to shoot.
WTI light is already trading since last year and that has a API gravity between 45 to 50. Reuters reported that there will be trading of WTI-condensate which has over 50 API gravity.
But segregation of various so called crudes result in more storage tanks and pipe line fills. But all increase crude builds. Exports need storage tanks as well. Both PAA and EPD said that US refiners are maxed out in handling light Permian crude and that export is needed.
Krish or Vishu, are you implying that a majority of the” crude oil”build up in stocks is of NGL+ NGPL basically anything above 45 API ? This will alter the whole picture of what is in inventory.
NGPL is at record level of 139 MM barrels for this time of the year. And we have a few months of more build. The entire Permian growth is over 45 API gravity. And now we have over 50 API gravity material entering the scene in the form of condensate.
Jeffrey Brown coined the phrase “condensate con” back in 2015. Now WTI specs have tightened conforming with COQA recommendations of February 2015. New grades such as WTI light and WTI condensate have emerged. They are all counted as crude.
And refineries are maxed out on what they can use, right now. Hence, unless it can be exported (big question) it will continue to add as crude inventory build. As I said, the independents have found another foot to aim at.
Oil prices will not rise much if the EIA weekly keeps looking sick.
The only recovery from this is exports (doubtful) or if big oil takes over the Permian and adds to refinery and other use capabilities. Permian, as far as Delaware Basin goes, is maxed out, due to 45 to over 50 API. They just can’t count it separately well enough, yet. So, it’s dumped into WTI inventory. Surely, there is a substantial discount, by now, but I can’t find it.
The other issue is that the light Permian stuff has about 1/2-2/3 the energy content of what was once considered to be a standard barrel of WTI. I suggest to you gentlemen that even if volumes were to increase from the Permian, we are well beyond peak hydrocarbon energy.
Mike,
Not all of the Permian crude is very light, there was a time when lighter grades commanded a premium price because the were easy to refine into gasoline and diesel fuel. There is plenty of heavy oil in the World that can be blended with the lighter crude, this is not likely to be a big problem as we are talking about less than 10% of World output from the Permian and only 10% of that is the very light stuff, so 1% of World C+C output.
The data suggests that for Texas the proportion of crude with API gravity above 50 degrees has been decreasing since Jan 2015, down from 22% to 10%.
Article on WTI, kind of interesting I thought
https://blogs.platts.com/2018/06/22/wti-vs-wti/
Thanks for the response but my question is more related to the mystery of EIA’s unaccounted oil. I don’t remember how high it is but several 100k/day, perhaps 500k?. I was just thinking that if plant condensate (and perhaps some other stuff) are not reported as ‘oil production’ but these fractions are reported when they end up in inventory than this should explain some of the unaccounted inventory increase.
Line 13, the 4 week moving average is above +800 kb/day, which has not happened since Jun 07, 2002.
Line 13 long term average is +200 kb/day and so it is usually positive just not so high.
Jeff,
the NGPL is included in the petroleum balance sheet, so not the explanation.
Krishnan’s argument includes the entire balance sheet, spreadsheet, or cumulative bull, whatever you want to call the weekly. A large part is showing, a large part is hidden in crude, and probably in gasoline. Look up his credentials, he knows what he is talking about. If you still want to dispute, that’s your choice.
Part is due to not being able to export to Venezuela, that is what he stated earlier, although it hasn’t been mentioned, lately.
GuyM,
Not disputing Krishnan, the comment was an answer to Jeff’s question. Read his question and my answer, the NGPL is part of the balance sheet, some of that may be included as crude input, but refinery and blender net inputs are broken out by crude and NGL, so the speculation that some NGL is hiding as a crude input may not be correct.
NGPL can enter a refinery as crude and make gasoline. It can very well be double counted. I just read naphtha hit a record export in May. Robert Merriam of EIA is in now investigating whether plant condensate is the reason for high adjustment factor. Plant condensate is not crude by EIA definition but it is not very different from lease condensate which is crude by EIA definition
Krishnan,
I would think it is easy to determine the amount of pentanes plus coming from NGPL plants, the lease condensate may not be tracked very well as there is a lot of mixing of crude and condensate from associated gas.
Perhaps the stock numbers are wrong, basically the weekly report is crap, I pay little attention to it.
For the past 918 months the “unaccounted for crude oil” has averaged 121 kb/d. This amounts to 775.89 million barrels of unaccounted for crude over the past 17.65 years or about 44 million barrels per year.
If we look at the monthly reports, even those tend to have accumulating supply adjustments from 1980 to 2018 with an average of 148 kb/d extra crude supply added each month on average over the past 38.67 years. From 1973 to 1980 the positive and negative adjustments balance, then the crude supply adjustments accumulate over time, added in up to 2.1 Gb of positive “US supply adjustments to crude oil” from Jan 1980 to March 2019.
See
https://www.eia.gov/dnav/pet/hist/LeafHandler.ashx?n=PET&s=MCRUA_NUS_2&f=M
I found the cumulative total over the Jan 1973 to March 2019 period, on July 1980 the cumulative total was -146, on March 2019 it was 68759 kb/d over 464 months, 68759/464=148.2 kb/d average supply adjustment each month over those 484 months. If we multiply 148 kb/d times 30.4 days per month times 464 months we get 2.09 Gb of cumulative crude supply adjustment over 38.7 years or about 54 million barrels per year of average annual crude supply adjustment.
Since 1980 the crude supply numbers have been inflated, one would think the EIA could due a better job with the data as this is monthly data which can be revised.
Comment above I mistakenly said crude supply has been inflated, it is the reverse in fact, crude supply has been under reported by 148 kb/d on average each month, or possibly net imports were 148 kb/d higher than reported or any combination of these two that adds up to 148 kb/d on average each month from 1981 to 2019.
EIA glossary page
https://www.eia.gov/tools/glossary/index.php?id=Lease
“Lease condensate: Light liquid hydrocarbons recovered from lease separators or field facilities at associated and non-associated natural gas wells. Mostly pentanes and heavier hydrocarbons. Normally enters the crude oil stream after production.”
Plant condensate comes from NGL processing plants.
So both come from gas wells, but the core issue is what you are suggesting — both are getting added to the crude stream and statistics. Maybe the most opaque way for this to happen is as diluent?
I don’t have a clear answer, but if the effort of the sheet is to explain the inflows and outflows of oil, and if if production is way overstated, don’t they have to plug the sheet someway?
The EIA line 13 is a calculation to resolve the difference between inventory change and the daily production and import rates. For example, let’s look at the EIA report of June 7, last week.
Inventory increase last week. 2.2 M bbls or 315 kb/d.
Production and Import oil going into inventory
(1) Domestic Production 12,300
(4) Net Imports (Including 4,489
Total crude going into inventory 16,789 kb/d
Oil coming out of inventory
(14) Crude Oil Input to Refineries 17,064 kb/d
Difference between oil going in and out of inventory
Inventory increase -275 kb/d
The numbers above show there is a discrepancy between the inventory daily increase rate of the 315 kb/d and the fact that the input to refineries is greater than production, hence the inventory should be decreasing. EIA assumes that measuring inventory should be accurate. So to bring the two numbers/calculations into balance, they need to add a rate adjustment line.
Adjustment = 315 – (-275) = 590 kb/d, as shown in line 13.
Thanks. Means they haven’t a clue to what it really is.
The issue is where is all of the wrong data coming from. Since nobody knows, the EIA has to be a good accountant and make things balance. However I continue to remain suspicious of these weekly inventory and production increases, when refinery runs are greater than crude input.
Ovi and GuyM,
Even with the monthly data which gets revised annually the EIA can’t get this right see my comment at link below
http://peakoilbarrel.com/opec-may-production-data-2/#comment-679885
Seems GuyM is correct, since 1980 the EIA seems to have lost the ability to count. 🙂
I know that is no surprise to you. You have never been a fan of the weekly.
GuyM,
Even when we look at monthly data there is a problem with the “unaccounted for” crude supply, where we have a data set that gets revised annually to correct past mistakes, it would seem the data should be better than this. They were able to do a decent job from 1973 to 1980, since then they tend to inflate crude supply, which seems silly.
Maybe it just part of the new fake news phenomenon.
Ovi,
I realized that I had this backwards. The cumulative supply adjustments were about 5.5Gb for crude plus petroleum products and 2.1 Gb of cumulative supply adjustments for crude oil from Jan 1981 to March 2019. This amounts to an average monthly adjustment of 359 kb/d for crude plus products when change of petroleum stocks is accounted for over the 1981-2019 period. For crude we only have stocks data from 2005 to 2019 and over that period the cumulative supply adjustment was 511 million barrels with an average monthly supply adjustment of 98 kb/d. This number needs to be added to field output over that period, otherwise crude stocks would be 511 million barrels lower which would be 596 million barrels in March which is less than the SPR at 649 million barrels. So the conclusion is that the EIA has been underreporting crude output since 2005 or possibly net imports are higher than reported. It is strange that they can’t get this right with data revisions done annually on the monthly data sets.
Phil Flynn wrote this comment this morning on his oil blog. Looks like there are professional traders concerned with the adjustments.
“The Trade will look hard at EIA adjustment numbers that have risen by a historically astronomical amount over the last 5 weeks. The EIA hopefully will soon have an explanation. It is critical to know because if those adjustments are unusable oil, it may be giving the market a false sense of supply security.”
I try not to get into politics too much, but have some serious questions on where we are headed in Iran. I know the press have serious doubts about Trump escalating the thing. Unfortunately, I can’t think of a better avenue for him.
Unfortunately, oil prices will head higher, now. No matter what happens. That would be bad for him, and the Republican Party. Unless, you can blame it on a bigger lie. E.g. “weapons of mass destruction”.
“In his first 869 days as President, Donald Trump said 10,796 things that were either misleading or outright false, according to The Washington Post’s Fact Checker. Do the math and you get this: The President of the United States is saying 12 untrue things a day.”
https://www.cnn.com/2019/06/10/politics/donald-trump-lies-fact-check/index.html
I don’t think lying is going to be a issue for the Trump Administration.
I don’t recall this parameter being measured for the previous president. The measurement they have taken might therefore be superior.
This is much like the analysis the media provided immediately following the election. A particularly accurate quote was something like this, based on the exit polls.
— We have been taking him literally, and white males in Wisconsin, Michigan and Pennsylvania have been taking him seriously. It is they who switched their vote from Obama to Trump. A strong case can be made for those voters being the only ones who matter. We will have to see if this is remembered come 2020. —
I don’t recall this parameter being measured for the previous president. The measurement they have taken might therefore be superior.
Spare us the disingenuousness, Watcher.
You can’t remember such a ranking because no previous President ever:
a) Told so many bald-faced provable lies (disinformation, if you will(and if there was, surely someone would have measured it by now)).
b)Had Twitter to allow him to lie without any mediation (such as TV and newspaper editors)
c)Had Fox News to repeat and endorse the lies.
This is a new measure for a new reality.
The country is war weary. Maybe Bolton thinks like Cheney. “We’ll drop a few bombs and be out in six weeks.”
A new war might make it harder for Trump to get his wall and his space force.
Hell, I was war weary over 50 years ago. Vietnam era vet. Doesn’t mean the idiocy stops.
Last President for war was a reservist kept outta war by his daddy. No experience, but mission accomplished. Yeah, baby! This one is more dangerous, as he has zip for military training.
No one pays attention to what the “great generation” put into their planning and war efforts. That was my daddy’s generation. Five to six years of planning how they could build back up and reposition the countries they planned to defeat. They cared about everyone. People in Germany and Japan may not appreciate it now, but the victors F???ing cared. We ain’t there anymore. We really are not even close to great.
The Army has already failed to meet its quota of recruits. Adding a new war to low unemployment, burned out troops, and more restrictions on who can join, won’t help matters.
Ah, not really. When I took my physical, it was obvious from the test I had flat feet. Did they give me 4F? Naw, because I told them my feet didn’t hurt. The guy next to me with painted toenails got the 4F, even though his feet looked a lot better than mine. They will get what they need.
Did not the previous president promise to end wars in Iraq and Afghanistan? In fact during the 2008 nomination campaign the goal was to move to the left of Hillary in war ending promises. Complete pullout from Iraq within 90 days of taking office was promised repeatedly during the nomination battle. In the first month of taking office, meetings with military people took place and there was no total withdrawal from Iraq. Not in 90 days. Not in 90 months.
That president, who also had no military training, chose instead to redefine what the definition of a combat troop is and re-categorize the garrison in Iraq to be whatever they could work with PR-wise for 2012. Almost like calling NGLs oil.
Moral of the story is it’s very hard to counter the Deep State and get out of military adventures. The president campaigned on a withdrawl from Syria and recently had the gall to actually try to keep his promise. The GOPe (aka GOP elite, a Deep State faction) raged at this and military commanders were quoted as saying we take our orders from the president and not from his advisors. It had actually gotten to the point where military commanders were having to point that out, such was the opposition within the administration to the move. Within about two weeks the total withdrawal that the president wanted had been watered down to something partial. And now oil sanctions are pressuring Syria.
It’s very hard to get out of military adventures no matter how you campaign or what administration you are in.
Watcher, thanks!
Speaking about sanctions:
https://www.nytimes.com/2019/02/08/world/americas/venezuela-sanctions-maduro.html
https://adc.bmj.com/content/88/1/92.1
https://www.dw.com/en/who-has-been-most-hurt-by-sanctions-against-syria/av-48977663
GuyM,
Oil is lacking technical support to move higher in price currently. I know you don’t want to hear that and neither does Dennis but it’s the truth.
HHH,
If there is excess supply you will be correct. Currently this is what the traders think.
They are likely to be wrong. The current oil price level or lower is likely to lead to a shortage of oil.
If OPEC decides to go the route they chose in late 2014, then you may be correct, but it is possible that even if OPEC+ pumps flat out that supply will be inadequate if C+C consumption continues to grow at the average 1983-2018 annual rate of 800 kb/d each year.
Of course a low growth in C+C consumption (say 600 kb/d) and OPEC eliminating quotas could make the fall in oil prices that you claim correct.
My guess is that there is about a 1% chance you will be correct.
We will have to see what OPEC does and further output data for tight oil. The growth is likely to be far less than the market expects.
If we look at the trends from the drilling productivity report from Sept 2018 to June 2019, it suggests only a 500-600 kb/d increase in US tight oil output from Dec 2018 to Dec 2019. Many traders think it will be 2 to 3 times this rate of increase.
Note that the EIA’s DPR tends to be on the optimistic side, my guess is the increase might only be 200-400 kb/d in tight oil output from Dec 2018 to Dec 2019. This points to supply growth not matching demand growth.
Dennis,
Dollar index is likely going to 116.00 in pretty short order. Price is building up for a range breakout to the top side. A breakout above 104. It’s currently sitting at 97 and change. Any rate cuts by FED will be small pullbacks and viewed as opportunity to go long USD.
There are a lot of people out there that will try to convince you that the dollar is about to implode. They either know they are lying or don’t have a fucking clue about what they are talking about.
Inflation is about to arrive through currency moves if you live outside US. Oil will become expensive in some cases 30%-40% more expensive in dollar terms to most of the rest of the world. Now think about that for a minute.
What if dollar remains high. And price rebounds to $70-$80 on a shortage. Rest of the world will be paying close to double what they are currently paying for oil in dollar terms at least. And we haven’t even made it back to $100 oil yet.
This endless demand growth theory isn’t going to hold water under these circumstances.
Demand for US dollars is at an all time high. Just think about the demand for dollars it takes to just service all the dollar denominated debt that exist. It’s about 2-3 trillion just to cover the interest payment on USD denominated debt.
Large trillion dollar US deficits are dollar positive. Very dollar positive. They soak up US dollar liquidity.
When US cut interest rates from 5.25% to 0.25% in the wake of 2008-2009 it created a flow of hot money leaving the US to the tune of 9-10 trillion dollars. It’s invested everywhere you can imagine. Well lets just say the majority of that money gets defaulted on due to a lack of dollars to service it. In a fiat money world that means supply vanishes when defaults occur. Dollar positive again.
Honestly when this all plays out over next 5 years or so. The rest of the world is going to beg the US to do something about the strong dollar. Peak oil fits into all of this because there are a lot of debts currently out there that become let’s call it noticeably unpayable due to lack of energy.
Wait, what? Deficits soak up liquidity?
How? A deficit is spending in excess of taxes. It floods money into the economy. A deficit is fiscal stimulus. No stimulus drains money. It adds.
Only if FED is buying does it add money into the economy Watcher. You don’t get how the market actually works. You think you do but you don’t.
@HHH “What if dollar remains high. And price rebounds to $70-$80 on a shortage. Rest of the world will be paying close to double what they are currently paying for oil in dollar terms at least. And we haven’t even made it back to $100 oil yet. ”
The Chinese are trying to establish a non-dollar oil trading platform. Wouldn’t excessively high exchange rates make this viable?
HHH,
There have been plenty of currency moves both up and down from 1983 to 2018, but the upward trend in demand for C+C has continued steadily at about 800 kb/d each year. Perhaps consumption of oil will not increase, in China the currency remains fairly closely pegged to the US dollar, so Chinese consumption may not be affected and US consumption won’t be affected. If Chinese and US consumption grow at 2018 rates in 2019, that will be 628 kb/d from those two nations alone, pretty sure the rest of the World (67% of total oil consumption in 2018) will manage 172 kb/d of C+C consumption growth (that’s 0.3% annual growth in C+C consumption).
The trade weighted dollar index against major currencies doesn’t look that high when looked at long term.
https://fred.stlouisfed.org/series/TWEXMMTH
So lets say dollar index goes to 116 from 97, that is roughly a 20% increase, so for any country whose currency matched that difference the oil price would be 20% higher. So $84/bo vs my guess for US oil prices of $70/b. Or if $80/bo in US then the equivalent of $96/bo elsewhere due to stronger dollar. Might result in a bit lower consumption than at lower oil prices, though the World saw pretty high oil prices from 2011-2014 with fairly robust economic growth, though oil prices were a bit lower ($80 to $86 per barrel when we account for the weak dollar over that period). World demand will need to adjust in any case and higher oil prices will make it happen.
If you are correct on future dollar appreciation, it may keep oil prices in check.
China’s peg is under attack. BIG time. Really that is what the whole trade war is about. It’s just not being said openly. Couple of other issues like stealing intellectual property from companies. But main issue is their currency peg give them unfair advantage.
On a monthly chart S@P 500 is sitting about 30 pips or points underneath the trendline resistance that rejected price earlier this year. WTP had a nice day today but it was within the consolidation pattern that WTI is currently in.
So you got the FED meeting and interest rate cut or no interest rate cut tomorrow and then the G20 meeting friday. Technically the market is much more likely to sell off this week than to head higher. Stocks are at technical resistance or just over in some cases depending on what your looking at.
The USD/JPY on the verge on breaking to the downside of a 4 year triangle pattern. It’s actually already sitting outside the triangle so it’s just waiting. If FED cuts rates watch the 10year bond fall which explains USD/JPY breaking to the downside. And if they don’t cut market won’t like it so that is also going to drag bond yields down.
G20 comes up with no deal. That is bad. So further fall in bond yields. But no deal is also broadly risk off which will include selling stocks and WTI. Selling would continue next week as well and Trendline support on WTI chart just might come into play at around $45.
HHH,
You are quite confusing, at times you say you only look at the charts to see what will happen and that politics don’t matter. Your comment above seems to refute that, seems to depend very much on Fed decisions, Trump decisions on trade, OPEC decisions on output, Iranian decisions on nuclear program, decisions by G20 members, Chinese decisions, and many others.
The trends on the charts will change based on which decisions are made, and these cannot be predicted in advance. Perhaps oil goes to $45/b or to $85/b, it will depend on multiple decisions by many players which will effect both the supply and demand for oil. For Brent in 2018$, $55 to $75/b would be my guess for average monthly Brent oil price from June 2019 to Dec 2019. The recent monthly spot price for Brent was about $70/b in 2018$ for May 2019. Though on June 11, 2019 the daily closing price had fallen to $63/b (nominal). Currently front month future is at about $61/b (nominal).
The trend in Brent real prices from June 2016 to May 2019 has been an average annual increase of $8.7/bo in 2018$ over the past 3 years. If the trend continues we might see $82/bo for Brent in 2018$ for May 2020.
HHH,
And I say this with respect, are you the same depressing guy, I thought at the time a banker type, who used to use the terminology about fed policy and how we had entered a tunnel from which there was no exit
Shale oil has about 1/2-2/3 the energy content of a standard barrel of oil. And you can’t make roads or plastics from it. Perhaps ‘technical support’ should factor in – what I would suggest to be – chemically and energetically important parameters for the recent stuff coming out of the ground.
Plenty of oil sands for roads, and plenty of natural gas for plastics.
article on tight oil and refining
https://www.forbes.com/sites/woodmackenzie/2018/09/27/us-tight-oil-piles-pressure-on-refiners/#358b6ef77d28
Zero chance USA will attack Iran.
Iran has S300 anti-missile protection, multiples of missiles, and has said, in effect, they will reply asymmetrically – hitting Saudi oil production AND pipelines.
Not to mention, in extreme circumstances, USA Qatar-based COM – which is designated by Iran as a terror organization.
Houthi missile strikes on/near Saudi infrastructure have given the warning – beating Patriot defense system in Saudi, reportedly.
Tanker hits were probable false flag, actor unknown (hit from outer Gulf of Oman side).
The drum beats and posturing is simply USA’s Govt declared policy of ‘maximum pressure’.
Effect of an Iranian defensive attack on Gulf oil installation? Massive recession in the West would be very least of worries.
No, a diplomatic way through will be found, rest assured.
yep—
even crazy donnie would not be that stupid (I think).
Bolton? Yep, he is crazy—–
The one silver lining of Prez Bone Spur Donnie, seems to be his aversion to carrying out wars in the Middle East. It was one of his campaign promises…
Now Bolton and a couple others need to be put in straight jackets, locked up, and the keys thrown away for the safety of the planet! I’m not sure the planet can take one more stupid American war for oil!
Staniford had north Ghawar at about 3.2 Mb/d in 2007 and the southern section at 1.7 Mb/d. He expected little decline in the southern area by 2018 so perhaps northern Ghawar has declined from 3.2 Mb/d to 2.1 Mb/d. That would be roughly a 4% average annual decline rate.
Organic chlorides and Russian production (from the Petroleum Economist):
“In the wake of the Druzhba incident, the Russian government may pass legislation to once again prohibit the use of organic chloride compounds in the oil industry, according to Russian energy minister Alexander Novak. The Russian authorities allowed usage of organic chloride to clean up oil wells in order to increase oil production in 2012.”
Possibly a factor going forward?
Bit of an overreaction on the story of criminals swapping some barrels of it.
Yeah, it do make you wonder about the validity of that story.
https://www.shaleior.com/projects
Well, I was a doubting Thomas on the EOG enhanced recovery thing. For a mere 10k I can get the details, but it is definitely working in the EF. 30 to 60% greater EUR, ain’t small potatoes. Expectation, now, is that it will work to some extent in the Permian. Makes the tail a lot longer. The EF May have peaked, but it is far from dead, yet.
GuyM
Interesting, but i am unconvinced. Peak rates for the pads are 10% of the initial peak rates. The benefit is all down to the initial match (decline rate) and the assumption of b=1.0 at the limit of hyperbolic decline. Those compressors don’t come cheap. I’ll be watching EOG’s investors presentations for further updates although this will have a degree of confidentiality – they won’t want to let on too much if it works.
We are in about the fourth year of their efforts in this, and it has been in each quarterly report for the past three years. They did 58 last year, making the total of about 150 wells. They are either on to something, or incredibly stupid.
And, they can come up with some pretty dumb stuff. Over two years ago, they started producing some monster Austin Chalk wells in the Karnes fault area. Some whiz kids came up with the theory that it could be replicated any where in the EF area. I had to follow that one, as it was so unbelievable. Sure enough, the efforts were duds without natural fracturing. But, to their credit, they came back in about two quarters and admitted they were wrong.
GuyM,
Thanks. Interesting, I wonder how robust the economics is. Seems producers such as EOG would be releasing this information in investor presentations, selling the idea a bit more.
The question would be how much does it cost for the EOR ? Perhaps at higher oil prices the economics pencils out, at current prices probably not.
Article below covers some of this
https://www.spe.org/en/jpt/jpt-article-detail/?art=3391
EOG claims only $1 million added to well cost by adding EOR and an extra $2 of NPV per capital dollar spent in Eagle Ford. Other plays such as the Bakken have not seen good results.
It will take an awful lot of wells producing from 30 to 70% more to move the industry average rate for ultimate recoveries. Particularly since many will be at the low end of the range. “We believe that 30% uplift is closer to reality than 70% for lean gas injection in black oil or even in volatile oil,” Honarpour said.
Not all of the wells are good candidates for the procedure. Low EUR wells, wells spaced to far together, or too far apart, wells producing over six years need not put their application in for EOR. Mine are spaced close to 400 ft, and have decent EURs. 30% more on mine would yield about 100k barrels, so today’s prices would still make it a real win win.
And, it’s been listed in every presentation for the past three years. Initial presentations gave more info, along with investor discussions.
Guym,
If the wells that it can be applied to are very limited, it may not amount to much for the overall play. In other words there may be a few wells (like yours) that get a bump from this, but it may simply amount to slightly lower decline rates for the overall Eagle Ford play’s production. I doubt the 2015 peak is in any danger of being surpassed and I am also doubtful the current Eagle Ford output levels will increase.
Do EOG’s presentations suggest this has been successful in the Permian, I have read it did not work well in the Bakken.
Checked out most recent EOG investor presentation, EOR only mentioned for Eagle Ford.
No, I specifically said it will only add to the tail.
I have only read that they see results in the Permian, not who, or how much. I have serious doubts that it will. Permian rock will have a difficult time containing the gas addition.
The largest contributor of Permian increase is in the Delaware basin. They are having trouble catching up to movement post first drilling. Adding more gas could chase it into the next County.
Let’s see how this plays out:
https://www.zerohedge.com/news/2019-06-17/countdown-has-begun-iran-warns-it-will-breach-uranium-stockpile-limits-10-days
At least the oil markets are completely cool – some US tank levels de- or increasing a few inches are by far more important than exploding the middle east.
The USA has asserted that the latest tanker attack was via limpet mines placed on the hulls by Iran. We have a video that allegedly shows the Iranians removing a magnetic mine from well above the waterline of one of the ships attacked. The crew of at least one ship says they saw flying object(s) just before the explosion. It appears the explosions were above the waterline.
I do not know much about marine warfare, but it would seem that if the Iranians used frogmen or some kind of sub to place the mine(s) they would have been below the waterline. If the ships were hit by a missile is seems we would be accusing Iran of that, and we might have recon of some kind on any above surface activity.
I don’t have an opinion on what actually happened, but we could be seeing the run up to a war, and wonder if the current story makes sense.
Well, this is probably not BS.
https://www.navy.mil/submit/display.asp?story_id=109911
There are a few who are not convinced :
https://www.rt.com/op-ed/462044-iran-war-mistake-us/
Good reporting by a Russian newspaper. Probably enough to convince any skeptic. Well, not any.
“for every irredeemable neocon who believes this sketchy story, there appear to be 10 more who doubt it – because with such a long history of using false-flag attacks to begin wars, only someone with their head buried very deep in the sand could not feel at least a little skeptical about recent events.”
The wording is obviously not objective. So let’s look at it in a different angle: Are the so-called evidences water-proof and sufficient to claim Iran did it and possibly start a war, which may be the next step, say after two three more explosions or similar events with evidences of same kind? Is there anyone who buys that all wars started by the US are based on solid evidences? And just to get this right, nothing in Russian papers is correct and everything in American papers is right?
No one has a clue.
And Iran does sort of hold the “trump” cards in this situation.
It wasn’t a Limpet Mine. They were removing a magnetic ladder stabilizer from the hull after rescuing the tanker crew. Its been edited for propaganda. Same crap that Iraq was buying alum. tubes to make Uranium centrifuges.
No way would Iran attack a Japanese Tanker when it was meeting with Japan’s PM. Obviously a war hawk does not want Japan mediating an agreement and perhaps is sending a message to Japan.
Some more info:
The Japanese asks US for more evidence:
https://japantoday.com/category/national/japan-demands-more-u.s.-proof-that-iran-attacked-tankers
Have you already heard that US established Iran Mission Center? Hint: I don’t think it was established to be nice to Iran.
https://www.wsj.com/articles/cia-creates-new-mission-center-to-turn-up-heat-on-iran-1496426232
https://popularresistance.org/is-the-cias-iran-mission-center-behind-iranian-protests/
Is it unfair of me to claim that it says a lot about American foreign politics that Bernie Sanders is asked to apologize for his resistance against the US wars?
https://nypost.com/2019/05/24/bernie-sanders-refuses-to-apologize-for-not-supporting-wars-in-middle-east/
And he thinks the possible Iran war is going to much worse than the Iraq war. I think that’s a serious understatement. Will Russia and China support Iran, and will KSA and Israel and in next phase NATO support US? This may be something far worse than the regular popcorn wars.
Here we go again:
https://mobile.twitter.com/realdonaldtrump/status/1141711064305983488
It is still disputed whether the drone was in international area or over Iran. But what the heck is a US drone doing so close to Iran, anyway? Especially now in such tense times. And let’s for a second think about the reaction if a foreign drone was anywhere near the US border.
How many soldiers will be mobilised this time? 2-3 more of these events and the US troops, including the ones already in Iraq, in Syria, in KSA etc will be ready for invasion. An invasion that parts of the world will think is justified. Again.
Iran wants war
https://mobile.twitter.com/latsal1/status/1141723071272902657/photo/1
/Humour alert
Looks like the US almost started WW3 last night by doing a major air strike on Iran, but the attack was called off. I would imagine if Iran is confronted with a major attack it will launch one of its nukes at the US which would very likely escalate to at least a regional nuclear war.
The Intelligence agencies & the Pentagon are at least partially aware of Iran’s Nuclear capabilities, & this is just absolute madness!
https://www.zerohedge.com/news/2019-06-21/trump-backs-down-military-strike-iran-last-minute
“The operation was underway in its early stages when it was called off, a senior administration official said. Planes were in the air and ships were in position, but no missiles had been fired when word came to stand down” the NYT reports, citing an unnamed official.”
“ikes had been set for early in the day to minimize harm to civilians and the military, and it was unclear if the administration would move ahead with attacks at a later date. Trump made clear that the situation would have been much more tense if the unmanned $130 million surveillance drone had been flown by a pilot.”
This EIA weekly idiocy has, no doubt, a longer run. It won’t last forever. Yeah, Permian high API oil is maxed out on usage currently, but will eventually find a home via exports. Plus, there will be less exports of Mars, which will be used in place of imports in the US. Just a matter of time. When will that happen? I really don’t know, it depends on how many of our feet are left to shoot.
The longer it lasts, the worse the results. How high do we want to see oil prices?
GuyM,
Probably $75/bo would work nicely for many tight oil producers, though $80/bo would be better.
https://www.forbes.com/sites/michaellynch/2018/06/29/what-ever-happened-to-peak-oil/#22fe8642731a
Peak oil is a figment of our imagination. Oil is limitless.
https://www.cnbc.com/amp/advertorial/2019/03/19/is-peak-oil-looming.html
Total says not unlimited, but who knows.
Ok, enough for today’s daily intake of BS.
in the meantime, saudi crude inventories continue to decline to a 10 year low. nobody seems to care
It’s much easier to insert your head in your anus.
Has anyone anyone else figured out yet that L-48 shale production may have relatively plateaued or possibly initiated a decline as of Jan 2019? We could get back up on a growth profile if pouring rigs and frac crews into the Permian Basin, but from what I can tell 2019 growth is looking somewhat muted compared to the wild eyed assumptions being used by the EIA, IEA et al…
EIA data is now showing declines for each of Jan and February while rig count is still moving down and more importantly frac crew counts are going down as well.
Things are setting up to get interesting. Plot attached is busy. Study the scales and axis descriptions to figure out which data goes to primary or secondary scale. Key is that the last five months worth of data points on there are SWAGS from EIA. Best we’ve got, but I believe there is room for them to move down materially based on the better, more revised actuals from January and February. *** I reserve the right to be 100% wrong. (Also have smoothed a couple of the earlier period blips that appear to be busts, so if you replicate you’ll see a couple/few anomalies.)
Everything is from today’s release with EIA forecasts through July. They are sneaky as they don’t provide the rollup view.
https://www.eia.gov/petroleum/drilling/
https://www.eia.gov/petroleum/drilling/pdf/dpr-full.pdf
Uh, yeah, I mention it frequently.
Yes – Guy, you get it no doubt and have done an admirable job educating others on here. I should have put some sarcasm emojis in my post, but using these boards is not my thing.
Anyone else still missing it? I mean besides the EIA. the IEA, etc…
I remain quite surprised by how nonchalantly the EIA continues to represent strong production growth when it appears they are just grasping at straws now.
Do, I think others know about? Yes, no doubt. The amount of people with over a 100 IQ is more than those under, I think. That’s is, if they listen, and try to understand. By this time, it’s far from rocket science, as even I grasp it. Unfortunately, those whose vision is impaired by greed, will be the last to see it, no matter what their IQ is. They follow the big boys, that’s where the money is. And, they will miss out on a lot of money. Que sera, sera! There will be those that short oil that make money, but I will put my odds on that adage, that pigs get fed, but hogs get slaughtered.
The average IQ in the United States is 98.Apr 10, 2018…
DrTskoul,
It is the median that tells us where the split is between 50% above and 50% below. Not sure we know what the distribution looks like, but in general the mean and median are not always the same.
Snowback,
I agree the Short term energy outlook for US L48 C+C output (excluding Gulf of Mexico) looks too high, they expect an increase of 800 kb/d from Dec 2018 to Dec 2019, likely 400 kb/d too high in my opinion. Over the Dec 2018 to Dec 2020 period they expect an average annual increase for US L48 (excl GOM) of 675 kb/d, that forecast may prove to be fairly accurate, but a more likely path would be 500 kb/d in 2019 and 850 kb/d in 2020 for US L48 excluding GOM C+C output. Their estimate might be a couple hundred kb/d too high for Dec 2020 but may be in the right ball park for L48 excluding GOM.
Not sure on GOM, EIA expects about a 200 kb/d increase from Dec 2018 to Dec 2020, we would need an expert like SouthLaGeo to comment on the GOM prospects as George Kaplan no longer comments.
Average GOM production for the last 9 months of available data, from last July through March, has been a little over 1.86 mmbopd. It was down 2 months because of Hurricane activity (September-2018) and Thunderhorse shut-in (February-2019). Not sure why it was down in October 2018. But, if you take out the 3 down months, average production has averaged about 1.92. How likely is it to be averaging over 2.1 in late 2020? For there to be any chance of that happening, Shell’s Appomattox field, which just came on line, will have to be close to it’s 170 mbopd capacity.
The next 2 substantial GOM projects are Shell’s Vito, and BP’s Mad Dog 2, both of which are supposed to start production in 2021, but both have capacity of 100 kbopd or more. BP also has a Thunderhorse expansion scheduled for 2021.
Projects set to come on line in 2019 or 2020 include LLOG’s Buckskin (2019), Anadarko’s Constellation (recently came on line), BP’s Atlantis Phase 3 (2020), and a number of other small tiebacks. I can see these projects in total adding 80-100 kbopd, but they, in my opinion, are mainly just offsetting production decline from other fields. Just doing this, though, is a big deal. That’s suggesting GOM production could continue at over 1.9 mmbopd for the next 2 years or so, even without Appomattox. But, if that happens, and Appomattox is up to 150 kbopd or so by late 2020, GOM production could be over 2 mmbopd. That, though, would be my upside estimate. My midcase estimate for late 2020 is in the 1.90-1.95 range – higher than I would have thought a year ago, but not as high as EIA’s estimate.
Thanks SouthLaGeo,
So the EIA is a bit optimistic, by perhaps about 150-200 kb/d.
Appreciate the insight, that was what my gut told me as I don’t have your knowledge of the new projects coming online. Will the Vito and Mad Dog 2 be enough to offset decline in 2021 or do you expect decline to start in 2021? Seems output will be roughly flat in your mid-case estimate for Jan 2019 to Dec 2020 (maybe a 25 kb/d increase over those two years).
Great stuff, thank you!
I was debating that question as I was putting together my comments. I think Vito and Mad Dog will add enough to offset declines and keep production fairly flat for another 4-5 years. By that time, Whale and Ballymore come on line and could keep things flat for a while beyond. In some of George Kaplan’s profiles, he showed a final production peak in the 2023-2025 time frame or so. I could see that happening – where the combined production from all the fields mentioned above results in a final GOM peak in that time window, give or take a few years.
SouthLaGeo,
More excellent stuff!
Thank you much.
Snowback,
Looking at DPR data we are likely to see a 300 to 500 kb/d increase in tight oil output from Dec 2018 to Dec 2019. Only about 300 to 350 horizontal oil completions per month in the Permian basin are needed to achieve this level of increase. In May there were 431 new drill oil completions in the Texas Permian basin, we don’t have data for New Mexico and we do not know how many of these were vertical completions (those tend to produce less oil), for the past 12 months in the Texas Permian basin the average number of monthly new drill oil completions was 353 per month. The trend has been lower at an annual rate of 40 fewer completions per year (12 month trend line).
see https://www.rrc.texas.gov/oil-gas/research-and-statistics/well-information/monthly-drilling-completion-and-plugging-summaries/
chart below uses data collected from page linked above. Permian basin is districts 7C, 8, and 8A.
Snowback,
Found some New Mexico data (not Permian specific) at link below for first flow wells
http://gotech.nmt.edu/gotech/Well/First_Production_results.aspx?api=&poolname=All&year=2019
For wells with first production in 2019 I sorted by first production month and found that there were 57 oil wells that started producing in Jan 2019, 104 oil wells in Feb 2019, and 68 oil wells in March 2019. Data is only available through March 2019, an oil well is defined by me as a well producing more than 450 barrels of oil per month.
Thanks for the graph/ link. I believe the completations is both new wells drilled and DUC’s. Schlumberger have commented many DUC,s might not be profitable to develop as spacing might be to close. I believe with a 50 usd WTI price few Companies have profit to drill new wells and the river from wall street have dried up. What surprice me is EIA that still see strong growth from shale oil the remaining of 2019 , to me it seems the Pionair Mark Papa was correct when he in 2018 stated the best of US shale is already past and in Q4 presentation he told EOG dont see any increase in their oroduction in a 50 WTI world. Seems the majour increase so far in US oil is from super light shale that can mostely be used to gazolin or at least need to be mixed with heavier oil to get diesel. There is lots of factors out there like tradewar , tension in the Midle East, Opec desission related to follow up cut policy. But what seems quite clear is that the easiest barrels world wide is taken, about 15% of oil produced are replaced with new discoveries, thete is millions of barrels in decline every year from exsisting fields at some point demand will increase oil supply unthil a new price range have been established that will be profittable .
One more time. It does not matter what you say on any blog. Consciousness raising is useless. Awareness will have no value. Educating people about things like this will send at least 50% surfing around looking for rebuttal, and when they find it they will embrace it.
The absence of transport will kill most of the people on this planet, and oil scarcity is how that absence will occur, and soon.
What one has to say about it doesn’t affect the inevitability because what one has to say doesn’t affect physics.
Man – that is some kind of depressing reading Watcher. Largely true, but still sad.
Agree 100% on the physics. Not many people know how this all works so I think there is value in sharing how the business works just to educate and raise awareness. It gets harder and harder for us to produce the next incremental growth barrel of oil every day. The fact is that just to maintain the same rate of growth every month or year in the shale basins, we have to add more crews and rigs, or get more efficient every second of every day. (Or some combination thereof.) Technologies will continue to help us touch more and more of the resource available, but we sure are climbing way up the tree for those remaining apples.
There is never an equilibrium point in activity increase or required DC&E efficiency gain when chasing some consistent form of growth in shale basins with hyperbolic declines.
To be sure we could buy ourselves a number of years worth of sustainable liquid and gas hydrocarbon production if we packed up everyone working in the Permian/Bakken/Eagleford/Marcellus, etc… and moved them to North Africa and the Middle East for a decade or so. It’s just that most people don’t like getting shot, or having 16 YO kids waving AK-47s in their face…
I could not comment on anyone’s optimism or pessimism on where we are headed, because I have absolutely no idea.
Snowback,
You mentioned number of fracking crews in an earlier comment. Do you have any hard data to share on that, or is that simply anecdotal. The completion numbers for May in the Permian basin suggest that if the fracking crews are fewer in number, that they have become more efficient in the Permian basin as the completions were strongly up (431 in May vs 209 in March for Permian new drill oil completions.)
Most of the increase comes from the Delaware Basin which has ridiculously high API. It’s not moving out of inventory, as it is maxed out in refineries. It has limited export value. What the heck are we going to do with all this hypothetical increase? The more inventories increase, the lower WTI. It’s crazy!
GuyM,
A lot of the US stock increase last month was NGLs/propane, not much was light or middle distillates or crude.
A large part is hidden in the small increases in crude. This time of year, and considering what is happening, we should be seeing substantial draws already.
But, don’t take my word for it, look at the direction it’s going. The discounts to even Midland, should be accumulating soon.
https://mobile.reuters.com/article/amp/idUSKCN1T71B7
GuyM,
It would seem that the solution is to export the light oil and import heavier oil so that the blend will be correct for existing refinery capacity.
Perhaps we don’t have the export capacity to do this currently, but I would think Canada could use it to blend with their bitumen output or it could be blended with heavier imports and then refined here.
I am not an expert on refineries so perhaps this is not possible. There is some pretty light output that came from the Eagle Ford, where was that lighter oil used?
Hi Dennis – I know that you are aware of this, but for others it is important to reiterate that active Frac spread/crew count, (# of them, and efficiency of same), is the single most important factor to be considered when forecasting future production adds. Typically Rig count is a good proxy as we don’t like drilling wells and then letting them sit too long before they start making money. DUCs are managed very carefully and rarely warehoused. (Bottom line – Don’t completely trust the EIA DUC counts as they are still too high.)
If you have watched the DPR releases closely they are closing the over-reporting gap that they built through last year, but still a long ways to go… There has been a net downward revision of ~700 DUCs in just the last six months or so. It never gets fully reported in the releases, but if you track monthly it makes sense why the Permian DUC count never really exceeded 4,000 even though hundreds and hundreds of new DUCs have been “added” since January… They are simply adjusting down prior months very quietly.
As to the source of the frac count data I would steer you to the folks at Primary Vision. Theirs is a pay for service regarding Basin level data, but I believe you can access national level data if asking nicely.
After viewing their national level product some folks dive into the pay for service. (Good business model, kind of like Shale Profile in that you get a taste of the product before fully subscribing.)
https://www.pvmic.com/frac-spread-count/
Now if May completions are actually as high as some of the numbers from late last year, that would imply that current frac crews are ~133% as efficient as the crews running in mid/late 2018. (Assume roughly a quarter of spreads are idled). Some of that is possible as high-grading occurs. We are definitely getting higher stage counts per day, so there is some merit there. At some point there will be a relative asymptote on frac efficiency gains and then counts will be the choke/throttle.
Thank you, and thanks to all others here for the insightful commentary and discussion!
Off topic – but is there a way to receive a notification when a reply is made to one’s comment? Email or otherwise?
Thanks!
Snowback,
Don’t think we have that feature here, sorry.
Thanks for that info. I agree there will clearly be a limit to how efficient frac crews can become. If oil prices eventually rise, tight oil output will rise as well. If oil prices remain where they are we might see flat output, but eventually (unless a severe recession begins in the interim) flat tight oil output is likely to lead to higher oil prices in my opinion, by May 2020 at the latest, but I think it more likely we see oil prices start to rise this summer and fall.
North Dakota Completions: Director’s Cut vs EIA DPR
chart https://pbs.twimg.com/media/D9W5ybMXsAAlsYW.png
The data service mentioned by Snowback has a free chart on twitter…
The Primary Vision Frac Spread Count is 445 for the week ending June 14th, 2019.
https://pbs.twimg.com/media/D9Dat-mXUAo8ZoI.jpg
Twitter Account: https://twitter.com/PrimaryVision
The best North Dakota completion data is found on shaleprofile.com imo.
For March the ND Middle Bakken/Three Forks and unknown completions were 62, very similar to director’s cut.
The DPR does a little better than in previous years, but basing the model on rig counts only is probably a mistake, they may incorporate DUCs into their model now, which would be an improvement, including frac crews would also improve the model. Also the model would be improved if it took account of both the oil rig and gas rig count, rather than simply total rigs.
Airbus Helicopters sees 18-month wait for oil & gas demand pick-up
https://www.reuters.com/article/us-france-airshow-helicopters/airbus-helicopters-sees-18-month-wait-for-oil-gas-demand-pick-up-idUSKCN1TJ1XZ?feedType=RSS&feedName=businessNews&utm_source=feedburner&utm_medium=feed&utm_campaign=Feed%3A+reuters%2FbusinessNews+%28Business+News%29
EU vs US inventories (Crude oil + Distillates)(OPEC MOMR)
The EU has a preliminary number for May (often wrong). And the USA has the latest weekly number (yellow dot).
chart: https://pbs.twimg.com/media/D9W-bv6W4AAs1Fl.png
Fujairah weekly inventory change (1000 barrels)(FedCom/S&P Global Platts)
Total -2,491 w/w
Seasonal: Total +3,704 year/year
Chart https://pbs.twimg.com/media/D9agFT0W4AALRn_.png
Japanese weekly inventory change (million barrels)(PAJ)
Crude Oil -6.27
Total (Crude + Distillates) -4.43
Seasonal: Total (Crude + Distillates) +1.43 year/year
Chart https://pbs.twimg.com/media/D9agdyLWsAEYUx6.png
New study shows how environmental disruptions affected ancient societies
A new study shows that over the past 10,000 years, humanity has experienced a number of foundational transitions, or ‘bottlenecks.’ During these periods of transition, the advance or decline of societies was related to energy availability in the form of a benign climate and other factors.
With the human population having exceeded the capacity of Earth’s resources, this analysis suggests that a transition toward sustainability for the current energy-dense, globalized industrial society will be very difficult if not impossible without dramatic changes.
They found that when energy was abundant, societies expanded and prospered. Conversely, when energy sources declined, there was societal contraction and collapse.
https://www.sciencedaily.com/releases/2019/06/190618123526.htm
Somewhat up thread, talk of WTI getting 3 categories of resolution for light medium and . . .relatively heavy.
Turns out seismic imaging is able to identify what is in pores of rock if you are seeking mostly to know the ratio of gas to liquid (of whatever kind), and it is also a little bit possible to delineate in the imaging water vs oil. The velocity of the seismic event signal is faster in denser material.
But because both are liquid, imaging estimates will be unreliable. The state of the art can’t tell. With oil itself getting categories of delineation one would expect imaging to have no chance to determine what is in the rock pores among the 3 categories.
Watcher,
Are you talking about bright spot technology, or something else? Bright spots have been around for 50 years or so. Initially, industry focused on using bright spots to identify gas prospects. As time went on, we found out we could identify high GOR oil as well. Unfortunately, sometimes a nice big fat wet sand can yield a nice bright spot as well, so it’s not fool-proof.
I have a hard time wandering through the rest of her stuff, but Peak oil prediction looks spot on.
https://ourfiniteworld.com/2019/02/22/have-we-already-passed-world-peak-oil-and-world-peak-coal/amp/
GuyM,
Not clear to me that oil has peaked, we have had plenty of previous episodes where output either fell or flattened out only to resume its rise later. Perhaps 2018 was the peak, I won’t be sure until 2022 when we have numbers for 2021, I would say it is too early to tell, but still expect the peak will be 2025+/-2, with a 20% probability it will be earlier (2018-2022) and a 20% probability it will be later (2028 or later). Note that a very small increase in output (a plateau like scenario) might be maintained until 2040, but I would put the probability of that scenario at less than 2%.
This is the issue that frustrates me the most. It’s the business as usual projections we get from virtually all economists. Their models do not incorporate enough variables.
And as interesting as Dennis’s models are, his projections don’t convince me we can count on them. They seem to assume that prices will be within a certain range and therefore production will be within a certain range. But I see today’s world far more unpredictable than that. I think we are going through a global transition which doesn’t have a precedent in recent history. We are facing the end of an energy era.
From the article GuyM posted.
“One issue with academic research today is that it tends to be divided into many academic ‘silos.’ Researchers tend to know more and more about their own field, but less and less about other fields that might be peripherally related. For example, economists tend not to keep up with the physics of self-organizing networked systems. Geophysicists understand the physics that governs the extraction of fuels, but they have no insight into the fact that the laws of physics might also affect prices and wage distributions.”
Boomer II,
You are wise to be skeptical of any forecasts of the future, all such forecasts can be no more than scenarios based on a set of assumptions, the assumptions are likely to be incorrect and a forecast based on in incorrect set of assumptions is almost certain to be wrong.
I am a bit unique in having been an undergraduate in mechanical engineering for a few years before switching to dual Bachelor’s degrees in Physics and Economics, then I went on to get a Master’s in Economics. So although I am not an expert in any field, I do understand both physics and economics.
Perhaps the understanding we currently have of both economics and physics will prove to be incorrect in the future (far more likely it will be economics).
Also note that although I understand mainstream economics fairly well, I focused more on political economics in graduate school and am well aware of the shortcomings of traditional economic thought. Nonetheless I failed my course in clairvoyance, so no doubt my models will have many shortcomings. 🙂
What concerns me about economic projections is the idea that humans will make rational decisions. Instead, I see indications that as stresses increase, humans may be inclined to make self-destructive decisions. Now in an ecological sense, the globe is likely better off if significant numbers of humans kill themselves off in some fashion. So perhaps we can attribute humans killing themselves and destroying their environment as a rational behavior, as far as nature is concerned.
At any rate, I’d like to see global economic predictions that include models based on irrational behavior and resource consumption.
Boomer II,
The “rational person” of neoclassical economic theory, would be considered irrational by most observers. So a straightforward neoclassical model already is “irrational”, by most accounts. 🙂
So the “standard models” will lead to pretty irrational outcomes. If we make the further assumption that policy makers choose to listen to diehard laissez faire economists (who have become dominant in mainstream economics from about 1980 to the present) then we could get some very irrational outcomes. This would be a world where a debt crisis is solved by eliminating all government debt, because clearly one cannot solve a debt crisis with more debt. /sarc
This was the mistake the Europeans made and that the Hoover administration made in 1929-1932 (not all government debt was eliminated, but there was reluctance to increase government debt).
That scenario requires a lot of economists to forget the lessons taught by John Maynard Keynes in The General Theory of Employment, Interest, and Money. It would likely lead to Great Depression 2 and possibly World War 3, it is not a pretty picture, and there is no model that covers it very well.
Dennis Wrote:
“This was the mistake the Europeans made and that the Hoover administration made in 1929-1932 (not all government debt was eliminated, but there was reluctance to increase government debt).”
Piling on Gov’t did does not work either. Argentina, Venezuela, Brazil all had just economic hits when they piled on debt trying to prop up unsustainable economic policies.
Winning at Debt it a lot like trying to win a Nuclear war. The obvious solution is to not start a nuclear war to get get deeply in debt.
The entire industrialize world is in deep trouble, having dug itself so deeply in depth it cannot possible escape. The worse of the problems have yet begun: Demographics & peak Oil. Once these to start is like trying to catch a falling knife.
At the very best the industrialize world has about 5 years left before its forced to just print money to meet financial obligations.
Tech guy,
Yes debt can be overdone, it can also be underdone, US 1929-1932 and Europe 2009-2012 are examples of the latter. Economics is difficult to get right, one size does not fit all.
Debt is what lead to the Great Depression. Credit was easy in the 1920s and people started getting deep in debt buying applicances, cars, radios.
What made the Great Depression, great was the gov’t trying to micromanage the US economy: Tarrifs, progressive taxes, Bank Holidays, and use the tax revenue to fund gov’t projects. The Great depression would have been just a bad recession if it didn’t meddle with the economy.
Tech guy,
Completely wrong.
The government didn’t meddle with the economy until March 1933. From the stock market crash in 1929 to Roosevelt’s inauguration in March 1933, Hoover followed the classical economic advice of laissez faire. What we got was 25% unemployment levels.
Roosevelt was embarking on a very new type of government policy and was very tentative in his efforts. Note that the huge boost to the economy came from increased economic activity due to World War 2 and huge government spending after the US joined the War in Dec 1941.
Federal budget deficit as a percentage of GDP at link below
https://fred.stlouisfed.org/series/FYFSGDA188S
US unemployment rate from 1929 to 1942, note the recession in 1938 due to a balanced Federal budget in 1938.
https://fred.stlouisfed.org/series/M0892AUSM156SNBR
Quoted the Gail post saying: “economists tend not to keep up with the physics of self-organizing networked systems”.
Curious as to where this comes up in geophysics?
As I said, I was confused on most issues discussed.
Boomer II, from what you quoted: “”Geophysicists understand the physics that governs the extraction of fuels, but they have no insight into the fact that the laws of physics might also affect prices and wage distributions.””
I have a question about the use of the term “THE FACT, ” which is followed later by the word “MIGHT.” Just me, but that seems nonsensical. And then the term “wage distributions.” What the heck is that?? The distributions are too high, too low, too varied??? And what does a geologist need to know about “wage distributions” with the extraction of fuels?? I can’t visualize a CEO interviewing a prospective new hire geologist and asking her/him to explain how drilling a well in that location will affect “wage distributions.” But, that is just ignorant me.
Perhaps a clarifying explanation of the link between the “laws of physics” and “wage distributions” can be provided by someone here who is a lot smarter than I am, and who can explain why a geologist needs to know.
I think the fundamentals of Permian oil has changed. If WTI goes to 70, there will, no doubt be more drilling in shale. That may not be the case in the higher API areas. The discount may only be a couple of bucks now, but the more that is produced, the greater the discount. As this area has the greater probability of growth, it could be a big limiter of Permian production. My guess.
https://info.drillinginfo.com/blog/west-texas-light-analyzing-the-growth-of-the-permians-latest-crude-grade/
GuyM,
Thanks for that link, excellent.
I imagine if this oil cannot be exported, and discounts rise on WTL (West Texas Light) with API between 45 and 50 that Delaware output will either flatten or fall and producers will focus on the Midland Basin.
In short, I agree with your analysis.
I think the time is getting close to an Oxy merger with a biggie.
The quality of the Delaware production definitely is an issue. It’s not an easily resolved bottleneck and the EIA projections for what can be brought out of the Permian don’t even address if producing it is desirable. Which is a compounding issue on US production forecasts as the Permian is expected to more than account for exhaustion in other basins that haven’t had (as much…) of this problem. Losing more conventional and early, less light LTO to legacy decline as the drilling prospects are more into “WTL,” that is the natural shape of things.
This oil was at a premium not too long ago. It could be mixed with the abundance of heavy oil for refiners, or used to make cheap gasoline. We no longer have an abundance of heavy oil, we have a dearth. Times change.
BTW, Eagle Ford has some oil that fits into that API category, also.
For some reason the heavy from Venezuela is not being used…
Heavier grades are now coming from Russia…
GuyM,
Can’t heavy oil be imported and blended with the WTL? It is unclear what has changed, it seems there is an abundance of heavy oil produced in the World, just import it, blend it with the lighter Delaware WTL crude stream and refine it.
According to reports heavy oil is scarce. Ven. Is down, SA is producing less. And, we are not shipping about 500k bbls a day of dilutent to Ven. Anymore.
Political conflicts are a drag sometimes for business.
Can’t we just import heavy stuff from somewhere, SA, Venezuela, and Canada are not the only producers.
GuyM:
“I think the fundamentals of Permian oil has changed. If WTI goes to 70, there will, no doubt be more drilling in shale.”
Shale drilling has little do with the price of Oil since Drilling has increases even though oil prices have crashed by about 50% since 2015. Shale drilling is dependent on the availability of cheap & easy credit. As long as creditors are willing to let shale drillers borrow, the game will continue. If credits stop lending to shale drillers, the industry would likely collapse in a year or two.
I agree there is a strong restriction. However, some of the bigger companies are not restricted (majors and companies like EOG). There would be some improvement in internal growth for some of the ones restricted. For others, there is not much hope unless they want to be a cheap lunch for the majors. It will go up, but not much to write home to Mama about. That’s for the Permian, and mostly the EF. However the eastern part of the Permian is further restricted on how much +45 API that can be absorbed. Bakken looks pretty shaky, but not too knowledgeable in that area. In short, the anticipated growth is mostly fantasy.
GuyM,
I think the Delaware basin is to the west of the Midland, on the border with New Mexico, most (or perhaps all) of the New Mexico Permian output is Delaware Basin output.
Duh. Left, right still confuses me?
U.S. Petroleum Balance Sheet
http://ir.eia.gov/wpsr/overview.pdf
Saxo Bank summary
https://pbs.twimg.com/media/D9bntoyXkAA5Xh_.png
Oilytics products summary
https://pbs.twimg.com/media/D9bwu0SWsAAvUEU.jpg
https://www.rigzone.com/news/permian_oil_output_set_to_keep_growing-19-jun-2019-159107-article/
Seems like EIA estimate 4 171 Mbpd from Permian in June than 4 226 Mbpd in July. That means up 55 Mbpd , and I believe remaining Area might be status quo or small decline. Even with the increase in super light WTI from shale latest EIA data show now storage of US oil decrease. Perhaps if Mr. President not mess it all with some twitter messages there will be some increase in oil price soon…
USA weekly inventory change (million barrels)
Crude Oil -3.1
Total Distillates -0.9
Total (Crude + Distillates): -4.0
Propane & Natural Gas Plant Liquids: +6.4 million barrel week/week (shown on chart)
Seasonal chart https://pbs.twimg.com/media/D9crgxaXoAUjZqH.png
Inventories: the sum of the USA + Fujairah + Japan (million barrels)
Total (Crude + Distillates): -10.94 (shown on chart)
Total Distillates: -1.56
Crude Oil: -9.38
https://pbs.twimg.com/media/D9cqxmaXoAYAzdC.png
https://pbs.twimg.com/media/D9cq9EdW4A0G1GP.png
OECD Stocks using data from OPEC MOMR.
5 year average for commercial OECD stocks in days of forward consumption is 61.7 days.
Onland commercial stocks in April were at 2875 million barrels, and dwarf most other reported stock numbers, these are the numbers shown in the chart but in days of forward consumption (this accounts for changes in consumption levels over time (in April 2019 the estimate was 47.84 Mb/d for petroleum consumption in the OECD) rather than in millions of barrels.
Strip out US inventory which shows a big build due to additional pipeline fills and storage tanks that needed to be built to handle much increased crude and condensate production in Permian. Also much increased NGL and propane production due to NG increase. You will find rest of OECD countries do not have that much glut.
March 2014 inventory 1294 BBLS. March 2019 inventory 1347 MM barrels for rest of OECD
IEA (May’s Oil Market Report pg39) Short-term crude oil floating storage sharply decreased by 6.7 mb in March m-o-m to 19.9 mb and remained lower than the five-year average, according to EA Gibson.
Good info, but I would say, just eyeballing it, a major point would be that it fell from over 50 mb on the five year average to 19.9 mb. However, it is up a few mb over 2018.
Rocky,
It is a small change relative to OECD on land commercial stocks of 2875 million barrels, 6.7/2875=0.23%. Good information, but it doesn’t really affect the World stock levels for crude plus products to a great extent.
Enno Peters has his North Dakota update up
https://shaleprofile.com/2019/06/19/north-dakota-update-through-april-2019/
104 new wells added in April 2019
Scenario below assumes 104 new wells are added until it is no longer profitable to do so with the oil price scenario assumed (shown on right axis). ERR=8.7 Gb, 27,700 total wells completed and oil price is assumed to fall starting in 2033 when World oil consumption falls below World supply in my EV transition scenario.
Dennis,
Interesting!
so your model for Bakken / 3 Forks is peaking at this level, either now or within a few years. Number of new wells is an input to the model, is that right? And the number of future wells is set the today’s level until 2033 to simplify?
Thanks.
Tom thanks.
Yes well completion rate is an input to the model. In addition, the model uses a well profile based on average well output data from shaleprofile, after Jan 2019 it is assumed that the average new well EUR starts to decrease based on the number of wells completed each month and an assumed Technically Recoverable Resource(TRR) of 11.5 Gb with 42,000 total wells completed (this is the mean USGS estimate for the North Dakota Bakken/Three Forks). Then assuming that 105 new wells per month are added until the NPV of future net revenue (using the oil price scenario shown on the chart and standard economic assumptions for well cost, royalties and taxes, transport cost, LOE, and discount rate) is less than the capital cost of the well (occurs in 2027 rather than 2033). At that point the number of new wells added per month is reduced to keep the ROI positive until wells are no longer added in 2032. The Economically Recoverable Resource (ERR) is reduced from the TRR of 11.5 Gb to 8.9 Gb and total wells completed are 27,700 instead of 42,000 due to profit considerations. Higher oil prices might allow somewhat higher ERR, potentially as high as 11.5 Gb, if for example there was no transition to EVs, or a much slower transition than I have assumed.
Also note that it is certainly possible that with higher oil prices the completion rate might rise to a higher level than the 105 average completion rate I have assumed, in that case the peak might be somewhat higher than the recent level of about 1.36 Mb/d, so these scenarios are likely conservative as far as high output levels, but also note that the fact that the resource is limited would mean that a higher and/or later peak would lead to steeper decline after the peak.
Below I present an alternative scenario with a higher oil price scenario. Clearly we do not know what future oil prices will be, nor the future completion rate, well cost, LOE, etc. I make assumptions and show the result.
Oil up today, and then after “closing” about 5% for WTI. Anomaly? Nah, pigs get fed, hogs get slaughtered. And that was a nice piece posted above from Ovi by Phil Flynn. Like I said earlier, even a higher than 100 IQ is not unusual in this “bid ness”. That’s not a reflection on Flynn, I am pretty sure he is over 140.
OPEC’s Top 3 Put Group on Track to Extend Oil Cuts in July
Saudi Arabia, Iraq and the United Arab Emirates — the group’s three biggest members — all want to keep restraining production in a bid to buttress crude amid signs of faltering demand. Having resolved a month-long fracas over when to meet, the Organization of Petroleum Exporting Countries and its allies now look likely to roll over the cuts when they gather on July 1-2 in Vienna.
That’s a good one. Iraq is violating their quota by over 200k and the UAE is near if not at their sustainable max production. The only time they spiked higher was for setting said quota. Meanwhile Saudi could increase production half a million barrels per day and still be in compliance.
Pull the other one.
Iraq is producing at an all-time high, 212,000 barrels per day above their quota. I can imagine that they want everyone else to continue their cuts.
Ron,
I would think other OPEC+ members would not be happy with Iraq.
Pretty good piece at link below on OPEC+ quotas.
https://www.bloomberg.com/graphics/opec-production-targets/
Dennis, thanks!
I think I will go through the data once more when my two brain cells are awake, but just want to mention that the level of details in your models are getting impressively advanced.
BTW: is the graph the same as the last one?
Ron and Dennis, thanks for all the work you have done and are doing with this web page I have learned a lot from. It has inspired me to do a MSc in Industrial Economics (well also because Rune Likvern who seems to also have a MSc in industrial economics) as I wanted to learn more about eg Investment analyses.
Excuse me for bringing up non-oil related war subjects all the time, but I think that the wars are presently a larger threat to humanity than eg peak oil and climate change as people are dying in wars everyday, as we speak. All three subjects are however linked together and only the future will tell how the planet will look like. And it is great to have a site where all these important subjects can be discussed. Again thanks for sharing your knowledge!
Tom the two charts are slightly different due to the change in the oil price scenario, they are the same through 2027 as far as the output curve and well completion rate, but from 2028 to 2040 the charts are different, the completion rate curve and oil price curve (read off right vertical axis) are where this is most obvious. You can pull up charts in separate tabs by right clicking on chart and opening in a new tab (Windows lingo, I am unfamiliar with Mac OSX) for each of the charts for easy comparison.
Attached is a chart showing the EIA’s weekly and monthly production numbers for the lower 48 states from Jan to yesterday for the weekly data and to March for the monthly data.
According to the weekly data, the lower 48 states production is up by 300 kb/d from Jan to June 14. The monthly data shows minimal increase from Jan to March but are 200 kb/d higher than the weekly data for June 14.
Confusing to say the least and possibly an indication of the level of uncertainty in their numbers/guestimates.
Ovi,
I am sure you know this, but for others, the weekly data never gets revised, the monthly data does get revised as the state level data improves over time. In short the monthy data, though imperfect, is less so than the weekly data. I tend to ignore the weekly data because it is so inaccurate as to often simply confuse matters. There is also a BOEM site where Gulf of Mexico(GOM) data can be found, it usually is similar to EIA data.
https://www.data.boem.gov/Production/OCSProduction/Default.aspx
From page above March 2019 GOM average oil output was 1906 kb/d.
Dennis
While they don’t revise their weekly data, in another way they do by giving us their latest best guess. For instance, their latest report has dropped production by 200 kb/d over the last two weeks. It will be interesting to see where the monthly EIA number for April comes in next week.
Ovi,
I am simply saying that the “best guess” in the weekly data has historically not been very good, the monthly numbers are better, though the best esimates are after the annual revisions in September each year, it takes a while to get the data right, just the nature of the beast.
Ok, in two days, we went up about $6 a barrel in WTI. What’s the record?
Back in 1990(?), after a [failed] meeting in Paris (?) with Iraq, James Baker from the US stepped in front of a microphone and started speaking with the word “Regrettably.” The price of oil went up $8 in 5 minutes.
That might be the record.
Two months old, but, no doubt, worse currently.
https://www.energyaspects.com/content/us-crude-growth-swinging-heavily-toward-50-api-refiners-raise-quality-concerns
So even in the Midland Basin the API is trending higher along with increased condensate. 70% of the new oil appears to be condensate. Damn, EF was never that bad, and they quit drilling in the areas that produced that stuff. Hail, the almighty Permian, King of condensate!
Plug that into your projections, Dennis. Firesale to be announced soon for pure Permian players. Useful for Majors, only.
That correlates to another story I posted earlier that said 30% was in the WTL area and 20% was in the WTI area. They never said what the other percentage was. I quessed condensate, and this article states it more specifically. Wow! Stories that miss me! That’s going to be as bad as natural gas prices, if they keep drilling. And all of that stuff winds up in commercial inventory.?
Fortunately, they quit just mixing it together. EIA has it the same in their weird numbers, but changing hands, it’s far different, now. Paint a big red nose on EIA and their numbers?
I wouldn’t have seen it from the RRC data either, as they have the same stupid system. Mix oil and condensate together. It’s not going to show up in Enno’s numbers, or any others, until they require it.?
When I was looking at completion data, they put the API on oil, but the amount representing condensate from oil production is never disclosed.
The only way I can tell how much condensate is from my wells is from the check Stubbs. It’s minimal, and decreases faster than oil production. I can also see why that EOG made such a big deal out of stating their Permian production has export contracts. This situation will eventually blow up.
GuyM,
I am pretty sure the oil and condensate are reported separately by the RRC.
http://webapps.rrc.state.tx.us/PDQ/home.do
link below gives map of districts (GuyM I know you know these, others like me may not)
https://www.rrc.state.tx.us/media/43653/ogm0132.jpg
Most of the condensate is from district 8 see chart below. Note that district 8 produces over 75% of Permian basin output since March 2018, but this district includes both the Midland and Delaware basins.
Using link below
https://seekingalpha.com/article/3693696-delaware-basin-update-crossing-wild-pecos
I used county level data for the following counties in district 8 from Jan 2016 to April 2019 the % of condensate for all C+C output in the county from Jan 2016 to April 2019 is shown for each county:
County——–%cond/C+C
REEVES——-33.67%
CULBERSON-93.98%
LOVING——-21.53%
WARD———2.24%
WINKLER—-4.40%
PECOS——–0.35%
Those 6 counties as a group had 28% of their C+C output as condensate, the rest of district 8 (mostly Midland basin production) had only 0.17% of C+C output as condensate. I imagine fewer wells will be completed in the high condensate areas going forward (fewer completions in the counties of Culberson, Reeves, and Loving). Those 3 counties alone had 36% of their C+C output from condensate from Jan 2016 to April 2019. Without the output from the three high condensate counties (they produced about 24% of all Texas Permian C+C from Jan 2016 to April 2019), the other 76% of C+C production only has 0.39% condensate. Eliminating only the output from Culberson county would reduce Jan 2016 to April 2019 Permian basin C+C output by only 2.5%, but condensate % of total C+C output would fall from and average of 8.7% over that 28 month period to 6.5%
When we consider more recent months from Jan 2019 to April 2019, the 3 highest condensate Texas counties of Culberson, Reeves, and Loving produced 27% of all Permian C+C output, but only 18% of crude output, their % of condensate as a proportion of C+C output for the first 4 months of 2019 was 39%. It would be wise for producers to cut back the number of completions in these high condensate areas until infrastructure is in place to move the natural gas and condensate to areas that it can be sold at a profit.
Drilling info has a bunch of data that I do not have access to, but looking at RRC data, Midland county’s % condensate was 0.08% for the first 4 months of 2019. For the longer Jan 2016 to April 2019 period (28 months rather than 4 months) the Midland county % condensate to C+C was 0.15%.
I used RRC Production Data Query (PDQ) with county level data for district 8 for these estimates. So not sure the Energy Aspects analysis of the Midland Basin is correct. Loving is a high condensate county with 21.5% condensate to C+C output for Jan 2016 to April 2019 and 26% for the most recent 4 months (Jan to April 2019).
I mistakenly said Midland basin and meant to say Midland county in second to last sentence in comment above.
The article was addressing new production, primarily. This outfit has some pretty good credentials, so doubtful they are too far off. And, obviously, they have access to drillinginfo data, you and I don’t have. Yes, by total, condensate is listed. Just not by well. And, your right, it would be wise. And, you have to remember that RRC data is only as good as its input, which changes after reporting.
By my estimation, Loving County has a substantial amount of the Permian increase, and in NM the next couple of counties. It’s high API, and obviously high condensate. EOG is in Loving, and is trying desperately to export it.
GuyM,
From Jan 2018 to Oct 2018, Loving was responsible for about 14.4 % of the Permian increase in output over that period. Loving county condensate % of C+C output for the increase in production over the 9 months from Feb 2018 to Oct 2018 was 17% based on RRC data. My main complaint was the Midland county data. No evidence of high condensate from Midland County, it is well under 1 % of output, about a tenth of a percent or less lately. Chart for Midland County % condensate/C+C from Jan 2017 to April 2019 below. I agree there is probably high API in a couple of counties, I think the article may overstate the case.
US C+C with API Gravity >45 Jan 2015 to March 2019, mostly 20 to 25% of output. The % of output with API gravity of more than 50 API has decreased from 12% to 9% from Jan 2015 to March 2019, thus the % of output with API between 45 and 50 has risen from 12% to 15% from Jan 2015 to March 2019.
Not going to argue. Have no backup data from their article, just graphs from the article. Usually, where there is smoke, a fire is somewhere. First time you have argued in favor of RRC data?
GuyM,
I don’t have the Drilling Info data, so RRC data is all I have, it is not clear how they define “new production”, but if they are looking at single months the data at drilling info can sometimes be wide of the mark, so using a longer output period of 8 to 12 months might lead some of these errors to cancel out.
In many cases the RRC data is the best we have and after some time (12 to 18 months it is excellent) in the mean time it can give us a hint at trends. This may have been what you have been telling me for years, eventually I get it. 🙂
To repeat, I agree there is quite a bit of high API oil, but it seems they may be carrying the argument a little further than the data justifies (at least based on what I see at the RRC).
I read with great i tetest the posts regarding increase of API gravidity. Seems like all Areas in shale playes have had different API and some very light tight oil. https://www.eia.gov/todayinenergy/detail.php?id=30852
I also understand EOG might have sent oil or condensate from an Area trough pipe lines and mixed it with oil as it increase storage levels and further lay downward pressure on WTI price. In a sand reservoir normaly oil , condensate, gaz is separated in the oil collumn related to density. If shale reservoir have similar geology the heaviest oil would be deepest in the shale formation, in vertical drilling the zones can ve targetted by make fractions in thoose levels , but I guess in horizontal drilling will they exstract what is in that depth first. More lighter oil will than penetrate the fractions from above and the result might be increased API. Since oil with very high API is less wurth and production cost the same means increased break even price. It is very interesting to learn from pepole that are in this Buisiness and have great knowledge about shale plays. I also sees from latest EIA update that US oil production is now 12.2 Mbpd up 500 000 barrels from January. Guess some of this comes from Alaska that have some increase activity and as I understand can earn money with 50 usd/ bbl WTI , some might be increase production from shale with high API. Than oil riggs in Permian continue to fall, think that not indicate much higher oil production at this price level.
Baker Hughes U.S. Rig Count
Oil: +1 to 789
Natural Gas: -4 to 177
Alaska +4
Texas -4
Baker Hughes charts
Hz oil rigs https://pbs.twimg.com/media/D9mdH1iW4AAm2Ji.jpg
Hz gas rigs https://pbs.twimg.com/media/D9mdHixXYAEfWP3.jpg
Table https://pbs.twimg.com/media/D9mgvwzWsAcZIbb.png
Platts rigcount for week ending June 19, 2019 is 1,040, down -13 from last week.
Twitter: https://twitter.com/PlattsRigData
Permian down 2. Permian would not have gas rigs. At about zero cents per mcf in that region.
Philadelphia Freedom Molecules escape from concentration.
“The Philadelphia refinery is “the largest such plant on the U.S. East Coast and the main supplier to the local gasoline market” according to Bloomberg. As of 10AM, the fire was still not under control, according to the Philadelphia Fire Department.” Entropy rules.
https://www.zerohedge.com/news/2019-06-21/it-could-burn-all-day-gasoline-futures-soar-philadelphia-refinery-burns
Small potatoes. Vast majority of US refinery capacity on Gulf coast.
That’s true, but the problem , now, is getting it to the East Coast.
They didn’t escape, they were sacrificed.
Heads up. Canada federal govt has approved pipeline expansion from oil sands to the Vancouver coast area. 800K BPD.
Other obstacles still exist, but it’s a step forward. Completion dates quoted 2022.
Pretty big deal, though.
Clickbated delux OilPrice Article. https://www.zerohedge.com/news/2019-06-21/trudeau-declares-climate-emergency-then-approves-major-oil-pipeline
Comments a real political Sh!T Show. Just where The F#ck they going to source NG + dilbit for all this Tar? Anyone want to stab @ Tons/hr Carbon extraction and release @Pipeline capacity?
New posts up
http://peakoilbarrel.com/us-tight-oil-estimate-and-projection-to-dec-2019/
and
http://peakoilbarrel.com/open-thread-non-petroleum-june-21-2019/