The latest OPEC Monthly Oil Market report is out with OPEC production numbers for August 2015.
All charts below are in thousand barrels per day with the last data point August 2015.
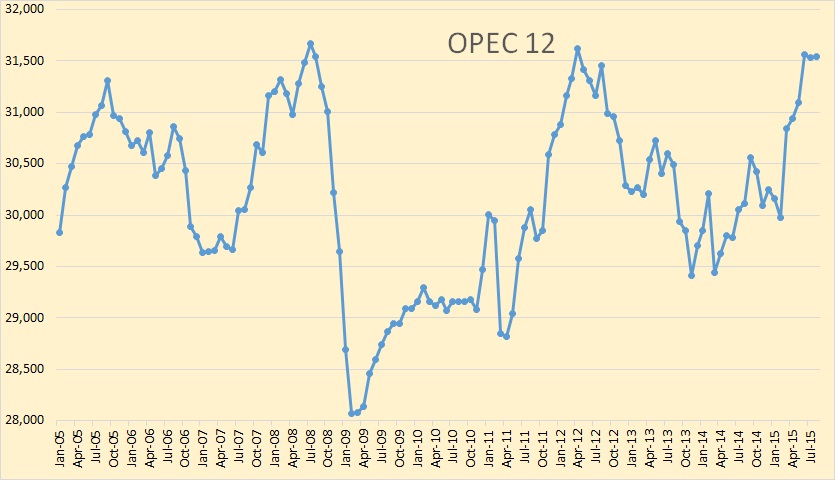
Not much has happened since June, OPEC 12 production was up 12,000 bpd in August that is well within the margin of error.
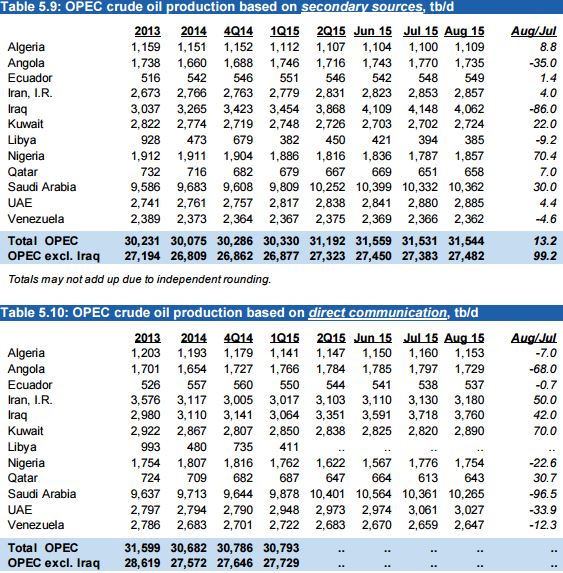
All my charts are taken from what OPEC calls “secondary sources” OPEC nations, especially Iran and Venezuela, often lie about their production. But from the chart above you can see exactly who was up and who was down in August, and by how much.
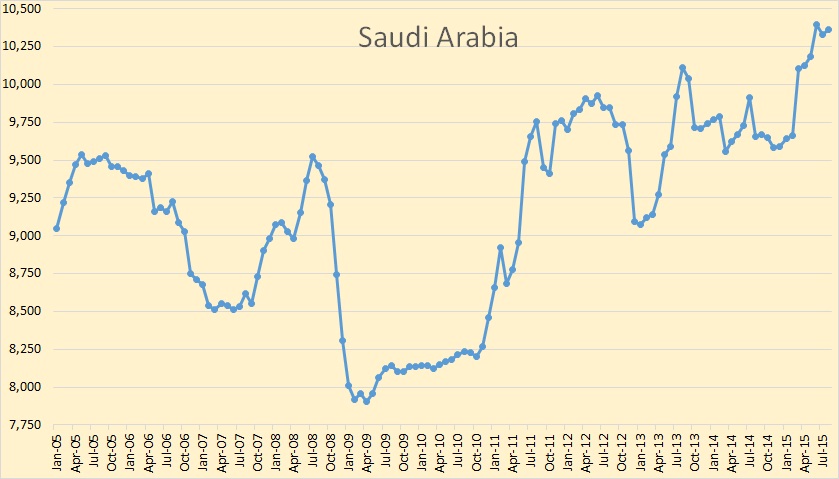
Saudi is holding steady, producing 10,362,000 barrels per day in August. However Saudi is up 700,000 bpd since February.
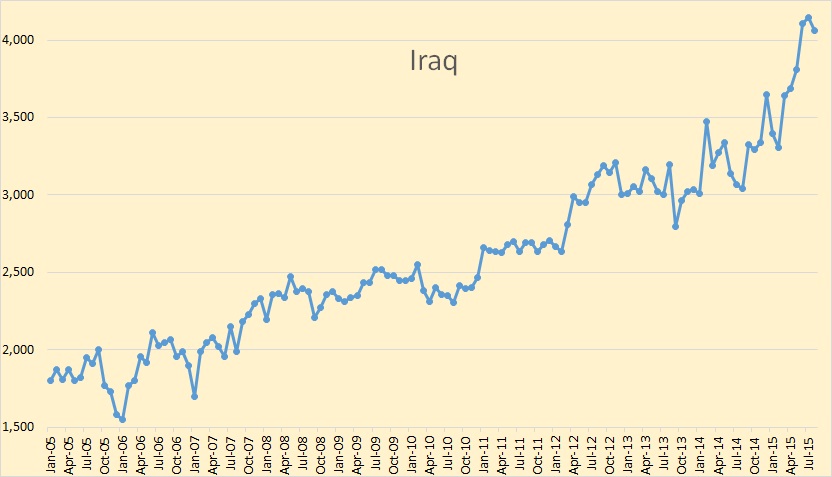
Iraq, like Saudi, has been holding steady since June. However Iraq has increased production by 756,000 barrels per day since February.
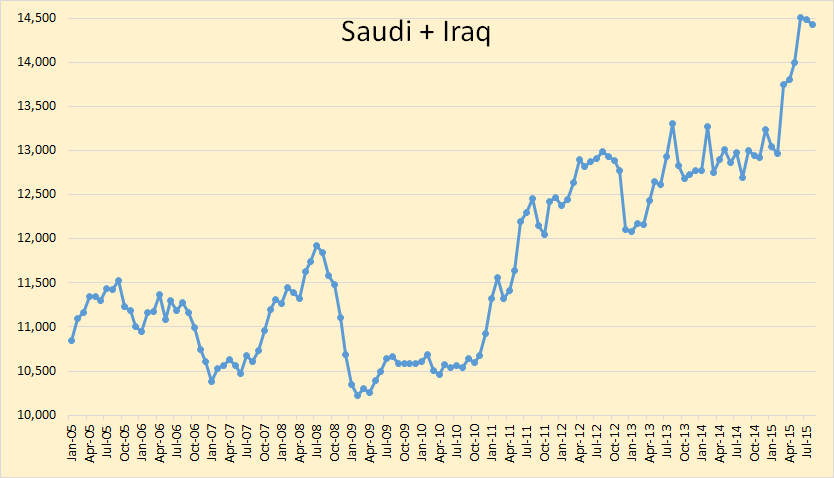
Saudi and Iraq have a combined production increase, since February, of 1,455,000 bpd.
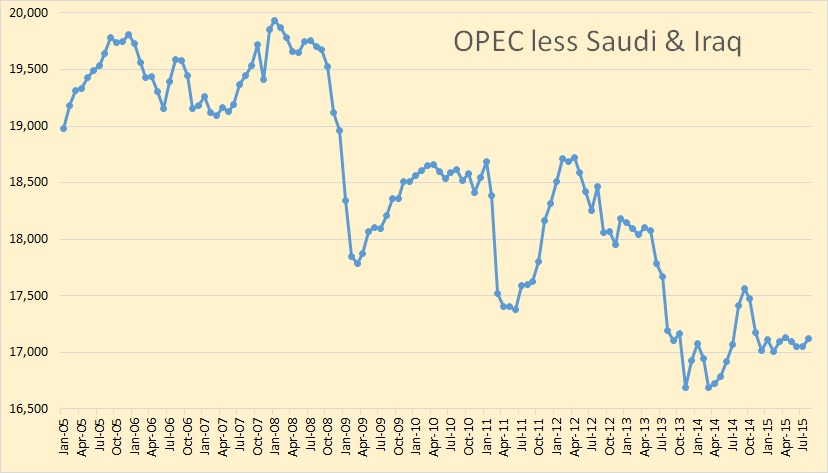
Everyone else in OPEC has hardly moved since February. Some of the other 10 OPEC nations have increased a little, some declined a little but none except Saudi and Iraq have done anything dramatic.
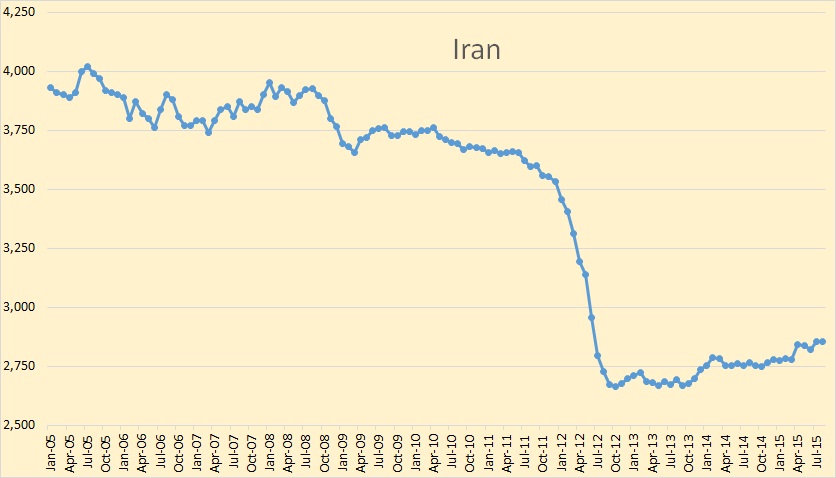
I had expected Iran to be up a lot in August but alas, nothing much happened in Iran in August.
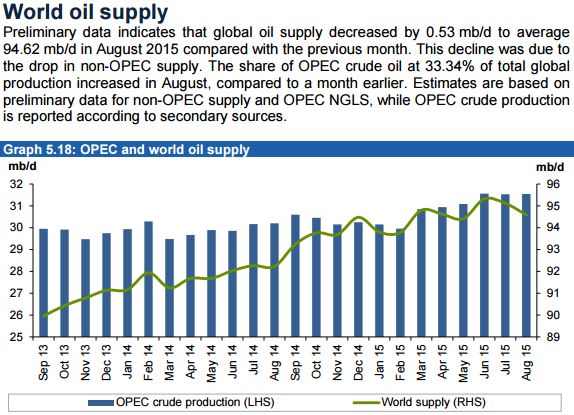
OPEC has world total liquids supply peaking, so far, in June and down over half a million barrels per day from July to August.
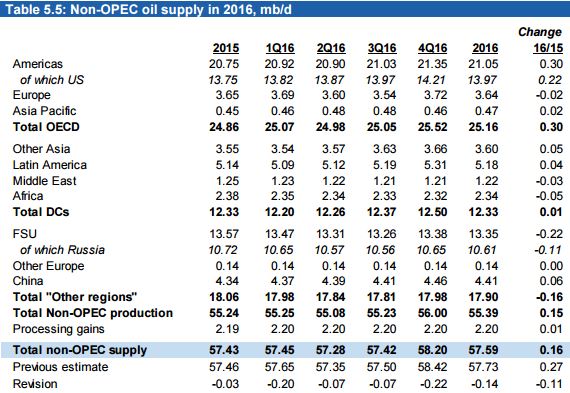
OPEC expects Non-OPEC total liquids to be up a mere 160,000 bpd next year with US and Canada increasing by 300,000 bpd. That means that they expect the rest of Non-OPEC to be down by 140,000 bpd.
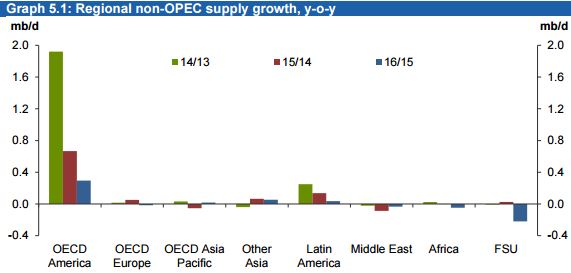
This chart gives a better idea of where they expect growth to come from next year, along with where the growth was in 2013 and 2014. This 2016 estimate of Non-OPEC production was revised down by 61,000 bpd from last month’s report. I expect further downward revisions in the coming months.
The page OPEC Charts has been updated with the August production data for all 12 OPEC nations.
Well at least one analysist agrees with me, we are currently at peak oil
The first step to kick our oil addiction is to admit we have a problem, and the longer we wait to do so the worse our problem is going to get. Humans are hooked and oil is running out. Yet the human population, America in particular, is in a state of denial. We either ignore the muffled doomsday calls from petroleum geologists that witness first hand the depletion of our oil supplies, or we simply deny the existence of a problem in the first place.
Our favorite defense against claims of oil depletion is the low gas prices we currently enjoy. We argue that prices are low therefore supply must high. Anyone with even a limited economics background would agree, yet that’s far too easy an explanation.
The real story lies with the rise of the U.S. fracking sector. Emergence of this new domestic market poses a threat to Middle Eastern oil giants like Saudi Arabia. Yet fracking is a more costly process than traditional oil extraction. Using this as an advantage, Saudi Arabia began to drive oil prices down to levels that frackers could not compete with. Granted, Saudi Arabian markets feel the heat of revenue decrease as well, yet they will endure while frackers will not.
Once the competitive threat of fracking has been eliminated, there is no doubt gas prices will be raised higher than ever. So enjoy low gas prices now because they will not last.
The fact is we are currently at “peak oil.” This is the point in time that we have pumped the maximum amount of oil out of the ground, meaning that from this point forward, we will produce less oil on a global scale each successive year.
The concept of “peak oil” is particularly frightening when you consider our demand for oil each year is increasing. This classic disparity between supply and demand is the root of the energy crisis we will face in coming years.
But it seems that just about everyone else disagrees:
The Pros and Cons of Sub-$50 Oil
Suffice it to say, the fears of peak oil are now dead and buried under millions of barrels of shale oil.
And:
Fear and loathing in emerging-market equities
Peak Oil was a cruel illusion and has morphed into a three mbd oil glut.
And this:
Not only was “peak oil” off-base… it was way, way off base. Out in the shale fields, it appears that a new kind of Moore’s Law is at work, with incredible new technologies making wells up to 50% more efficient per year!
And:
Innovation and Consolidation for North American Frac Sands as Low Oil Price Bites
The hectic pace of shale hydrocarbon exploitation in the US and Canada within the last 10 years has reversed the decline in exploitable oil and gas reserves and pushed so-called peak oil (and gas) decades into the future.
So those declaring the death of peak oil far outnumber those who say peak oil is here today. Fracking, they say, has changed the game. Fracking has made it a brand new ball game and peak oil has completely disappeared from the foreseeable future.
I think there are some folks who are in for a rude awakening.
____________________________________________________
I send an email notice whenever I publish a new post. If you would like to be added to that list please post me at DarwinianOne at Gmail.com
Posted a comment to Shallow Sands guy late last night and it may not have appeared.
Had to do with something relevant to this Ronpost. Namely . . . “the Saudis ramped up production and forced the price down.”
Nope. Look at Ron’s graph above for KSA. From July last year into looks like maybe Jan or Feb this year, KSA output was FALLING, not rising. That’s the period during which the price fell the most. It’s been largely flat since.
States since 1936 have manipulated the price of oil by manipulating the supply of oil.
Saudi Arabia increased its production significantly during the first half of 2015.
It seems fairly obvious that Saudi Arabia desires low oil prices for now, and has taken action to insure them.
Watcher, I was not clear enough I will admit. KSA was minding their own business till this spring when they ramped up production big time. Iraq did too, although keep in mind Iraqi oil is being produced through contracts with IOC’s.
KSA did not start the price slide, shale did. KSA exacerbated it and now all are in for long term low prices, IMO. Shale still mostly to blame. But KSA decided to be cute an maximize their production to drive the price down further. So they are selling more oil for drastically less than what they would like.
KSA has helped exacerbate a world wide commodity down cycle and they will have to devalue their currency. They may very well break US producers, but they will pay over one hundred billion dollars for the privilege.
Oil at $60 WTI would have slowed shale also, IMO. However, it will apparently be $40 or lower for quite a while since KSA has made it clear they want lower prices than that, so that will cost KSA close to $100 billion more than what it otherwise would have.
BTW, questionable how much they have really slowed US production, see July, 2015 ND and Bakken production numbers just released today.
Ultimately, there is a population in the US hurt by KSA actions, but small percentage. The rest benefit enormously. Meanwhile, all of KSA is hurt, and will be for sometime. Lucky for them they saved a lot of $$ when prices were high, they are going to need it IMO. All the rest of OPEC hurt, Russia hurt big time to, despite claims to the contrary.
I fully understand letting the market dictate, but getting cute and piling on is a mistake. But US will be happy to have KSA, rest of gulf OPEC, Russia, etc. give away more oil, even if more US companies BK. Someone in US will pick up the shale reserves, they are not going to disappear.
Watcher,
Saudi Arabia kept production relatively flat from August 2014 to February 2015.
And that contributed to the fall in oil prices, as the market expected them to cut output.
But KSA increased production by about 0.9 mb/d in just four months in March-June 2015.
That certainly stopped the oil price recovery that started in 2Q15.
Okay wait a minute. We’re talking about a price move from June 2014 to Feb 2015 from 105 to 50ish whilst KSA did nothing different at all.
Now y’all are going to posture . . . oh it would have come back if only? There is no if only. There is only the bulk of the move, July to Feb. Period.
As has been noted by Ron above, ppl are out there saying 3 million bpd excess supply. We’re at month 15 of the price fall. That’s 15X30 = 450 days or 1.35 billion barrels of storage above ground? Really? Seriously? You actually believe that storage was empty in June last year and now filled up? People were buying oil all this time to store it? The US SPR is the largest single storage place in the world and it’s only 700ish million barrels, and who thinks that was empty June of last year?
This whole thing doesn’t hold water, guys. Let’s not think in terms of supply and demand. Try supply and consumption, and then try to figure out how there can ever be more consumption than supply.
IEA uses the word “demand,” but if you look at their report what you will see is that when they say “demand” what they obviously mean is “consumption,” because their report breaks it down into the actual quantities of various categories of petroleum products consumed.
Here’s what they have to say about oil “stocks,” or oil put into storage.
The supply overhang has persisted and reached a staggering 3.0 mb/d in 2Q15, the widest gap in 17 years, as ever-higher flows of oil hit world markets. The pace of stock builds should ease over 2H15 as non-OPEC supply growth is expected to slow and projected demand growth remain above trend. Of the 273 mb global inventory overhang in 2Q15, 160 mb can be accounted for; OECD stocks climbed by 102 mb, Chinese inventories added 50 mb and Iranian floating storage rose by 8 mb.
https://www.iea.org/oilmarketreport/reports/2015/0815/
I’m saying the price would not be in the low $40s, (which at the well head is 20s and 30s for most in US and Canada) without KSA ramping up in spring of 2015.
Maybe it was the right move, maybe not. I am not smart enough to know. I guess it seems we have all assumed that Gulf OPEC, KSA in particular, and Russia are the wisest of them all when it comes to oil supply strategy.
Maybe they are. KSA is losing around $210 billion in oil revenue this year compared to 2014 (9.6 million x $60 x 365). OPEC as a whole is losing about $680 billion in oil revenue this year compared to 2014 (31 million x $60 x 365).
I do not know how much domestic spending KSA will be able to cut, but it looks to me like revenue will be $210 billion less than 2014, and if Goldman is correct, it will be another $210 billion less in 2016.
$420 billion is a lot of $$. Assuming a population of 30 million, that is a loss of $7,000 per year for 2015 and 2016 for every man, woman and child. Not chicken feed.
Let’s say KSA had instead cut one million bopd in Thanksgiving, Russia had also cut one million bopd and the rest of OPEC split up the third one million bopd.
9.6 million x $40 x 365 = $140 billion of oil revenue
8.6 million x $100 x 365 = $314 billion of oil revenue
I know the argument is they would have lost market share, etc. Maybe they would have. US shale sure has cost them plenty.
How about how much US shale has cost Russia. Let’s say in November in conjunction with KSA and OPEC they did cut one million bopd.
10.7 million x $40 x 365 = $156.2 billion
9.7 million x $100 x 365 = $354 billion
Ouch. US shale has sure cost Russia plenty too.
Now lets assume it turns out that the futures strip is pretty accurate, and KSA and Russia take it on the chin to the tune of $150-$200 billion a year each for the next four years. $350 billion x 5 = $1.75 trillion dollars.
Now we are talking about some big time dollars.
Maybe it was the right strategy, maybe not. Sure is a big gamble. Much bigger than whether some shale companies’ bondholders lose their principal.
Again, I am pushing the 99% of US view here, does not mean I completely agree.
The above is why I think there will be a cut. To much money is being lost, all over US shale, which no one made money on at $100, or $40, except for the shale employees, of course.
The world petro industry extracts 93 million barrels of oily water and other dubious gassy substances every single day.
(The energy content of said barrels has been steadily declining for a long time. Butane, hexane, asphalt, refinery gains are less energy dense or else the pea in a shell game.)
A straitened customer base can only afford 91 million barrels. What happens? The balance goes into storage, there is (the appearance of) a glut.
Look at it another way. The oily water industry can only extract 10 barrels per day. The blessed customer(s) can only afford 8 barrels. What happens to the other two? They go into storage and there are cries of a glut! Broke customers are the problem, money flows to drillers stranding the customers who cannot borrow, cannot make a bid for fuel.
BTW: peak oil (availability as determined by price) was in 1998, when a barrel of good quality crude could be had for $7.50. (Spot EIA price was $11.)
No doubt the collective end consumer is in a tight spot these days but the FLIP side of this coin is that the end users of any product such as oil want only so much, in the short term.
When producers bring more than that amount to market, the price crashes.
Electric cars are not yet a significant influence on oil markets but substitution and efficiency are rising in my estimation much faster than most people realize.
Some points-You simply cannot BUY a carburetor any more at a typical auto parts store. You have to ORDER one.
You cannot BUY an oil furnace in my part of the country anymore, you have to order one. Fifty different models of heat pumps are available TODAY at local contractors.
A new Ford F150 gets TWICE the gas mileage that my old Chevy gets – but I will keep on driving the old Chevy until it DIES because it was paid for the day I brought it home years and years ago and is still dependable.
Our ancient 1997 Buick land yacht, now enjoying a long rest in the back yard, gets almost thirty mpg on a trip. An eighty seven comparable in size and performance got less than eighteen. A five year old Impala that a friend owns gets thirty five on a trip.
Lifestyles are changing. Kids these days would rather have an econobox and electronic toys than a hot rod- some of them even go for all electronic toys and no car at all.
I would agree that consumption is depressed somewhat below what it would be if the economy had continued to grow the last couple of years.
But I still believe that the most important factor in understanding the price of oil is that production has been growing fast enough that it has outrun ESSENTIAL consumption,considering substitution of biofuels, improving efficiency, life style changes etc.
You pour milk out when the flavor turns a tad stale – if you have plenty of money. It becomes cat milk. If you have PLENTY of money you even feed the cat fresh cream.
But if you buy three hundred sixty five gallons a year because you have a big family, and the price of it declines by half, you don’t buy twice as much. You have NO NEED for it in the short term. NO REAL DESIRE for it.But you will buy a little more, maybe one or two or five percent more, because you can make use of THAT MUCH MORE by substituting it for other foods.
You can make use of MORE gasoline -so long as it is CHEAP-by delaying the purchase of a new or newer car a year or two. If gasoline goes to six bucks it will be to my advantage to buy a new truck.You can justify an extra weekend trip or the larger engine option in your new car.
Too much oil produced or too little consumed, the flip sides of the same coin. Either way, you get a price crash.
My understanding is that production has increased faster than consumption, even after the price crashed.
But production WILL fall of noticeably pretty soon, given that a lot of producers are in the red. It may take a year or more for this to happen and to clear out the huge amount of oil in storage.Then the price will go up again.
shallow sand,
I’m sorry, but you seem a bit obsessed with the idea that Russia and Saudi Arabia need to cut production.
1) Russia and Saudi Arabia each account for about 11% of the global liquid hydrocarbon production. Why do you think that they should take all the burden of output cuts to restore the market balance?
2) Oil prices tend to drop much more quickly than to rebound after sharp drops. In 2008, it took 5 months for oil price to decline from $145 in July to $35 in December. But after OPEC decided to sharply cut production at its meeting in December 2008, it took 25 months for oil price to again reach $100 (in February 2011). And that was helped by an 3.2mb/d increase in global demand in 2010. If OPEC or OPEC+Russia cut production by 2 mb/d today, it would take much more than a year for oil price to reach $100.
3) You ignored my argument that in case of OPEC or OPEC+Russian output cuts their lost barrels would be quickly replaced by shale producers. I’m sure that, if oil prices stayed at $100, LTO producers could add more than 1 mb/d this year and another million in 2016. The IEA now projects US C+C production at 8.82 mb/d in 2016, almost the same as in 2014 (8.72 mb/d). With constant $100/bbl oil, US production would average 10.7 mb/d next year and prices would drop again. So why would Saudi Arabia and Russia concede their market share to LTO producers without really achieving the goal of a higher oil price?
Hi AlexS,
There is an intermediate case where a cut would keep oil price at $65/b and LTO output would be unlikely to grow at that price (it would remain flat). Under those circumstances for both Saudi Arabia and Russia at about 10 Mb/d or 3.65 Gb/year, the extra $15/b ($65/b-$50/b) would be $54 Billion of extra revenue each year. So the question is: why forego this extra revenue? The Russian government could reduce output by increasing taxes, OPEC could easily reduce output with an emergency meeting as long as Saudi Arabia was on board.
Most US citizens (that are not in the oil industry) are perfectly happy to pay low prices for oil, the same is likely to be true for most Russians that are not in the oil industry.
There must be some non-economic motivation that Watcher could explain. Perhaps the Russian oil industry wanting to hurt other countries oil industries, or Saudi Arabia wanting to hurt Iran or the US LTO industry or even to keep other OPEC counties in line.
It will be interesting to see what OPEC does in December.
Dennis Coyne said:
That’s the $54 billion dollar question, no?
I suspect none of us has sufficient information to answer it, but you can bet dollars to donuts that Russia and Saudi Arabia have very well calculated and thought out reasons for doing what they are doing.
shallow,
That is the problem with US mainstream view. It is simplistic. That money that you calculate that oil producers lost is only imaginary money. Oil producers recycle the earned money into the global economy. They don’t keep it in some safe deposit box. So the imaginary money that Saudis lost is actually imaginary money that actually Boeing lost on future plane orders or money that” Coach” or “Gucci”” lost on future sale of women’s purses for Saudi princesses. Texas earned oil money are probably not supporting local RE or car sales at the same extent when the oil was $100. Earned money just get’s recycled. Not earned money is just illusion.
I’m just throwing out another view. I don’t know if it is correct and I am not obsessed with it. I think I am stating the mainstream US view, that being US will be happy for OPEC and Russia to hurt US shale in exchange for $2 gasoline the next five years.
I do know that, absent a production supply shock, only an OPEC cut will cause a price recovery. OPEC will not cut without Russia, Russia will not cut, so oil prices will be low.
Didn’t want to go through another 1986-1999, but maybe that’s what we have on our hands.
Don’t forget to factor in other producers when you prepare a mental model of how this works. Most producing countries have marginal fields and wells, they may also have projects which were forced to slow down, were deferred, or cancelled.
I keep an eye on Ecuador because they report production on a daily basis, and break it down. Private oil companies have been declining slowly, the state oil company seems to hold flat. I think this pattern repeats everywhere, there are players who can’t justify repairs and new wells, they are all losing production capacity.
” I think I am stating the mainstream US view, that being US will be happy for OPEC and Russia to hurt US shale in exchange for $2 gasoline the next five years.”
TRUER words have never been spoken.
The only people in the USA who give a flying Fxxx at a rolling donut about the tight oil industry are the people directly involved in it plus the conventional producers of course.
The rest of us, excepting conventional producers, feel some fondness for our good friends who are bringing us two dollar gasoline.
The conventional producers would gladly pay to have laws passed outlaw tight oil .
With the exception of a very small handful of congress critters that might be the bought and paid for property of tight oil interests, the rest of congress and the executive branch is EXTREMELY happy that oil and gasoline are cheap right now. Good times keep incumbents in office. Bad times put incumbents at higher risk of losing upcoming elections.
Less than one percent of the people in this country who drive would vote for a couple of bucks added to gasoline taxes. Most of THEM are already driving Teslas, Leafs, Volts etc- or taking the subway or the bus or biking or walking.
My personal physician lives up and practices down. His commute takes about fifteen seconds.
My attorney has a duplicate office in his home and schedules actual appointments in his ordinary office to the extent he can on alternate days so as to avoid the drive. This works for him given the sort of practice he has.
Incidentally it is amusing to remember the howls of disdain coming from the left when a few right winger political types predicted that good old Yankee ingenuity and elbow grease would bring us cheap gasoline again.
shallow sand,
The current situation is not exactly analagous to that of the 1980s. In the 1980s there was major global demand destruction.
Thus far during this go-round there has been no global demand destruction. Therefore this is a different animal.
During the 80s, there were large OPEC output cuts. This time, OPEC output is up around 2 mmbpd. OPEC numbers showing actual stock change are showing around 666 mpbd stock gains in the most recent month, just in the areas they have numbers for. Very low prices will likely persist for at least one more year, absent unlikely OPEC cuts.
Blaine,
That’s true. Saudi Arabia initially responded by cutting supply.
But the combined forces of new non-OPEC supplies comming on line and global demand destruction were just too much to overcome, and so Saudi Arabia in 1986 finally threw in the towel and increased its oil production.
What I am trying to point out is that, at least up until now, there has been no demand destruction during the current cycle. I am fully aware these facts fly in the face of many popular, and false, narratives being spun.
This does not mean that there could not, in the future, be global demand destruction. But so far during this cycle, that has not happened.
Blaine,
So the question becomes, why was the MSM, and even persons like Gail Tverberg and Art Berman, so engaged in making false empirical claims during the first part of the year?
The false narrative about falling oil demand was ubiquitous. Here’s an example from CNN, which I believe is the largest news outlet in the United States.
http://edition.cnn.com/videos/cnnmoney/2015/01/06/the-story-behind-oil-price-plunge-crane-orig.cnn
Demand has been growing with lower prices, but the demand growth is quite weak. This is fairly normal following a period of high prices. People have accepted a higher price as normal and have adjusted their behavior accordingly, even when prices fall again. The same thing happened during the 80s, only more strongly.
Despite all the said about the state of the global economy and potential risks for China’s GDP growth, I still don’t see any sign of weakness in global oil consumption. The effects of low prices are quite visible. In 2016, demand growth will slow down, but still remain above the long-term trend.
World oil demand growth in 2000-2016E (mb/d y-o-y)
Source: IEA
Hi Ves,
To someone running a business a drop in revenue is very real, the recycled dollars argument could be applied to your paycheck, would you prefer to earn half of what you did 6 months ago? I am guessing no, unless you had no income 6 months ago and then there would be no change.
Hi Dennis,
It is irrelevant what I or anybody that runs a business prefer to earn 6 months from now. The only thing that is important is if you want to stay in the same business when circumstances change is to survive another day. If you survive another day, things could change tomorrow.
Hi Ves,
For a small operator in a perfectly competitive market, I agree. For Saudi Aramoco, they could cut output and raise prices. As Glenn Stehle said above they must have their reasons, but $54 B per year is a lot of money to leave on the table.
Maybe that’s pocket change for the Saudis, I just don’t know.
“We’re talking about a price move from June 2014 to Feb 2015 from 105 to 50ish whilst KSA did nothing different at all.”
As we all know, the markets are driven not only by fundamentals, but also by sentiment and rumours. The oil market has moved from under- to oversupply in 1Q14. Oil prices started to decline in June 2014 , but initially the decline has been relatively slow, as there was a perception that OPEC will defend prices by cutting output. The day before the OPEC meeting in late November Brent price was still at $80, but after they decided not to cut the decline sharply accelerated. By the end of December Brent price reached $55 and, by mid January, $45.
The main cause of the glut in the oil market was the sharp increase in LTO production. But the market reacted on OPEC’s decision not to offset rising US production by its own output cuts.
The Saudis and OPEC in general have not increased production in late 2014 – early 2015, But it was their decision not to cut that triggered a sharp drop in prices from still decent $80 to $45, as this was viewed as OPEC war on shale oil. If you disagree with me, re-read articles on oil market written at that time
….wait there is more
Equity, RE, commodities etc. prices are also subject to influences from monetary policies.
The chart below shows the movement in oil price and timing of some fed deployed tools, Feds funds rate, QE. The highlighted areas shows (Fed) QE.
QE and S&P 500
Rune,
Monetary policy very much affects overall economic activity, which in turn impacts oil demand, which in turn affects oil prices.
A very good example of this was back during the 1980s.
You, however, are suggesting that there are other mechanisms through which monetary policy affects oil prices.
Could it be as simple as the functioning of the quantity theory of money, which holds, in its most elementary form, that, other things being equal, prices vary directly with the quantity of money in circulation.
Glenn,
Interesting observations.
If the amount of goods is unchanged while the quantity of money increases (or these two see different relative changes), how would that affect prices?
In a situation where money in circulation declines while supply of products is unchanged I would expect to see a decline in the price (deflation).
It is important to differentiate between price and affordability.
Example; oil at $20 could be perceived as cheap, but if the buyer only has $12 he cannot purchase the (full) barrel. The buyer could bridge the gap by borrowing $8, or the seller could lower his price.
Money connects sellers and buyers. (They could alternatively barter.)
It reminds me of the tales my father used to tell me about the Great Depression.
He said you could buy a cow for $10, but nobody had $10.
FWIIW
The chart below shows relative changes in crude oil and condensates supplies for the World, OPEC and North America (Canada, Mexico and the US) versus the oil price (Brent) using January 2008 as a baseline.
Note that with the collapse in the oil price in 2008 OPEC reduced its output with about 2.5 Mb/d, picking up the slack in world demand/consumption thus rebalancing supplies and demand and doing their to renew support for the oil price.
Something changed late 2012, growth in world demand was very much satisfied with growth in supplies from North America, while OPEC supplies moved sideways.
Note how the rapid buildup in North American supplies as from mid 2014 coincides with the recent collapse of the oil price.
Hi Rune and AlexS,
Nobody disputes that the sharp rise in LTO output caused the glut which led to lower prices. The rise in OPEC output in response to lower prices in 2015 just seems like a dumb move from an economics perspective. It may be a political battle between the Saudis and the Russians, or the US asking KSA to keep output high to hurt the Russians. I don’t think movements in world oil supply and demand over time can be understood very well by looking at monetary policy in one nation. I would focus on interest rates as that is where the rubber meets the road. US interest rates are not closely correlated with oil price movements (we would expect an inverse correlation, as interest rates rise we would expect reduced economic activity and lower oil prices, with some undetermined lag in time).
Using Fred data for 10 year treasuries and WTI oil prices from Jan 2005 to August 2015 we get the following scatter plot with R squared of 0.073.
https://research.stlouisfed.org/fred2/graph/?g=1Q9p
Dennis,
There is no single factor that could explain the changes in the oil market. Loose monetary policy had a very significant impact on the global economy and hence global demand. To some extent it also helped to finance the shale boom. However there is no doubt that monetary policy cannot explain all the movements in oil price.
Dennis Coyne said:
I agree.
There are so many moving parts that the analysis is best done by breaking the whole down into parts.
Minimally, it must be broken down into the devleoped world and the developing world.
The two parts of course overlap and have interdependencies, but their behavior since 2007 has been very distinct.
For instance, compare this graph of total private debt in the United States to the one for China below.
Obviously, an expansionary monetary policy in the United States — low interest rates and QE — had very different consequences than, for instance, China’s expansionary monetary policy.
What happened in the United States is what is called “pushing on a string.” That didn’t happen in China, at least not over the timeframe of the graphs.
Glenn, interesting.
I think it is also important to look at the (present, near past) structural differences of the Chinese and US economies.
China’s GDP is some 50+% Investments.
US GDP is about 70% Consumption.
Both economies has seen strong growth in credit/debt.
The US experienced very rapid private credit growth up untill the Great Financial Crisis, but afterwards it stalled out, and all the king’s men and all the king’s horses couldn’t put it back together again.
Some attribute the dilemma to the growth of what they call “unproductive debt.” To wit:
Q: Why are you so down on the U.S. economy?
A: It’s become super-saturated with debt.
Typically the private and public sectors would borrow $1.50 or $1.60 each year for every $1 of GDP growth. That was the golden constant. It had been at that ratio for 100 years save for some minor squiggles during the bottom of the Depression. By the time we got to the mid-’90s, we were borrowing $3 for every $1 of GDP growth. And by the time we got to the peak in 2006 or 2007, we were actually taking on $6 of new debt to grind out $1 of new GDP.
http://www.businessinsider.com/david-stockman-youd-be-a-fool-to-hold-anything-but-cash-now-2012-3
More here on this blog from Australia:
“The rise of unproductive debt”
http://www.macrobusiness.com.au/2012/05/the-rise-of-unproductive-debt/
Now compare how private debt in the US has remained stagnant, whereas private debt in China has exploded.
The expansionary monetary policies of the US and China had very different outcomes.
Hi Glenn,
My recollection is that China had pretty strong fiscal policy action along with monetary stimulus and as Rune points out China is a rapidly growing economy (relative to the US) where investment spending is a much larger percentage of total GDP. This can be a double edged sword if business confidence stumbles and investment spending tumbles, but no doubt the Chinese government would step in with fiscal stimulus if needed.
As you said at the start there is a big difference between China and the US on many levels.
Hard to predict.
Some say China has now reached the condition that the US and Europe reached in 2007: super-saturated with debt.
Certainly fiscal stimulus is not as taboo in China as it is in the Anglo-American world or Europe.
But this, I would argue, is not the magical elixir some on the left, like the MMT school, and some on the right, like Richard Nixon, with their vitiated Keynesianism believe it to be.
Perfect examples of this can be found in Latin America as we speak.
Brazilian policymakers, for instance, believed that all they had to do was create demand by implementing fiscal policies such as a guaranteed minium income, and as a result increased production would happen, as if by magic. Production, however, did not grow in stride, and what they ended up with is a pretty bad case of inflation.
Regardless of how the money supply is expanded, the trick seems to be to expand production concomitantly. The question I am struggling with, therefore, is this: What are the conditions or ingredients necessary for that to take place?
Is one of the ingredients for production to keep pace with money creation abundant natural resources, either domestic or within imperial reach, which are not too costly to procure?
Hi Glenn,
That is a great question debated at length by economists and politicians. Probably expansionary fiscal policy should be reserved for those cases where monetary policy is ineffective as interest rates approach zero.
If fiscal expenditures are needed for improved infrastructure they should be undertaken in the absence of adequate private investment, but mostly the government should tax externalities appropriately and let the private sector do most of the investing. Tax policy can be used to a limited extent to encourage investment in some areas where there is clear underinvestment that is suboptimal for society(education and health care are prime examples in the US.)
Generally the government should focus on defense, education, health, foreign relations, and monetary policy. Energy policy would not be a bad idea either.
Dennis,
In his book Bless the Pure & the Humble, Nicholas George Malavis has a chapter titled “In the Loving Arms of the State.”
US oil producers managed to find their way into “the Loving Arms of the State” in 1936.
They remained there until the 1980s, when “little oil” found itself spurned and cast off by the state. But big oil is still firmly in the loving arms of the state.
Make no bones about it, if the survival of big oil was seriously threatened, and it could not achieve these subsidies in a more opaque way, the state would intervene in a hearbeat with trillions of dollars of subsidies, just like it did to save the TBTF banks.
”Nobody disputes that the sharp rise in LTO output caused the glut which led to lower prices.”
It could be demand that did not develop at the expected pace.
”The rise in OPEC output in response to lower prices in 2015 just seems like a dumb move from an economics perspective.”
Do we know what strategies OPEC have deployed?
Those hurting most are high cost oil producers like North America.
”I don’t think movements in world oil supply and demand over time can be understood very well by looking at monetary policy in one nation.”
Interest rates are part of monetary policies.
US monetary policies have a different effect than, say Norwegian. The reasons are the size of the US economy and not least the US dollar is the worlds major reserve currency and most (all) commodities are priced in US dollars.
I referred to US monetary policies.
I would be surprised if you found any correlation between UST10 yield and the oil price.
Low interest rates work both sides of the supply and demand equation.
Rune Likvern said:
It could be demand that did not develop at the expected pace.
I think that’s right. The expansionary monetary policy implemented by the Fed in the wake of the Great Financial Crisis did not have the intended or desired outcome due to the “pushing on a string” effect. The money never made its way into the real economy, at least not within the geographical boundaries of the United States.
But this does not mean, however, that the money didn’t make it into the financial economy, or into economies in the developing world. And the former seems to be what you are zeroing in on.
There is a dissident school of economists, I think they’re German and/or Austrian, who argue the economy must be broken into two parts, the real economy and the financial economy. It looks to me like this line of thought follows in the footsteps of Marx and Keynes, or maybe those of von Mises and Hayek. For me it’s hard to tell because these dissidents don’t seem to have any of the traditional left-right allegiances to a strict class analysis. These dissident economists are having quite a bit of influence on economic thinking in Latin America.
If you’re interested maybe I can find some links to some of their papers.
Some of the money from QE’s found their way to the
Emerging Market Economies (EMEs) in the search for yield (carry trade). The carry trade grew in recent years.
This allowed the EME’s more purchasing power and they could use credit/debt to grow their economies and their energy consumption.
As the local currency depreciates (versus the US dollar) it becomes harder to service US dollar denominated debt. We are now at this stage.
Hi Rune,
I agree the monetary policy of the US influences more than just interest rates in the US, the low interest rates in the US drive capital flows as investors seek higher yields elsewhere and this affects exchange rates, which in turn affects international trade.
As you correctly point out the expanded credit in EMEs results in economic growth and an expanded money supply (assuming money velocity is relatively constant) which leads to local currency depreciation in USD. The currency depreciation may lead to increased net exports and higher economic growth for the EMEs. The higher income will help with servicing of the debt and the higher net exports might lead to currency appreciation as well (also making debt servicing easier).
” The currency depreciation may lead to increased net exports and higher economic growth for the EMEs. The higher income will help with servicing of the debt and the higher net exports might lead to currency appreciation as well (also making debt servicing easier).”
Dennis, can you point to EME’s where what you describe is happening?
Hi Rune,
No I cannot, the argument is theoretical. Would you agree that ceteris paribus a depreciation of a nations currency in USD would make their exports more competitive in the US and make US imports less competitive? If so one would expect that the net exports of that country would tend to rise. That in turn would tend to increase GDP.
For China the trade surplus was higher in August,
see https://www.focus-economics.com/country-indicator/china/trade-balance
The Yuan depreciated in mid-August.
India has been having difficulties with its trade deficit, but I have read that there are structural problems with rail and electricity generation that need to be overcome as it is experiencing very rapid economic growth around 7% per year.
Also the IMF data and 2015 forecast suggests that India’s current account deficit has improved from 4.8% of GDP in 2012 to 1.4% of GDP in 2014 and further improvement to 1.3% of GDP is expected in 2015 (April 2015 database.)
”No I cannot, the argument is theoretical.
It is not!
Check out what goes on in the real world (article behind pay wall).
http://www.wsj.com/articles/worries-rise-over-global-trade-slump-1442251590
”Would you agree that ceteris paribus a depreciation of a nations currency in USD would make their exports more competitive in the US and make US imports less competitive? If so one would expect that the net exports of that country would tend to rise. That in turn would tend to increase GDP.”
A depreciation of a country’s currency versus USD makes its products more competitive in the US. The question remains, will this change the demand for it?
You point to net exports as that was the case for every nation. It is not.
You are hypothesizeing.
A small trade deficit is still a deficit.
Off topic threads do not actually DIE immediately just because Ron or Dennis posts a new thread.
Anybody who wants to continue commenting in the non oil open topic thread can continue to do so for a week or two unless I am badly mistaken.
After Ron posts the next new thread after this one it can be used for related discussions for some time. Ditto the one after etc.
Assuming Ron approves of course.
So this would allow us generalists to continue any discussion relevant to the blog without causing Ron or Dennis any extra work.
Latest numbers from the Bakken show it’s stumbling a little, down some and production per well is still falling. Hope Ron puts up a post on it soon.
I will have a post on this early tomorrow.
Thanks Ron. So about 10 years after the date Matt Simmons predicted for Peak Oil it looks as though it has arrived – in spite of fracking.
Once this reality sinks into the collective consciousness I wonder if a certain amount of panic will set in and provide a psychological prop to prices? (Apols for the alliteration.)
As I have periodically noted, IMO it’s quite likely that actual crude oil production* may have peaked in 2005, while global natural gas production and associated liquids–condensate & NGL–have so far continued to increase. Link to comment on this topic:
http://peakoilbarrel.com/jean-laherreres-bakken-update/comment-page-1/#comment-534101
*Most commonly defined as 45 API gravity and lower crude oil
If I recall correctly it was Ken Deffeyes that called the top of conventional Oil production back in 2005, which I believe still holds true after ten years.
Well I don’t know about being at peak oil, but we’re sure to hell at peak cheap oil.
Are we also at peak afordable oil, as Gail Tverberg and Art Berman argue? If so, then we’re at peak oil.
I agree we are most definitely at peak affordable oil but I am willing to consider the possibility that the actual total peak production may still be a year or more down the road- at least using the new and improved msm definition of oil that means anything liquid that will burn.
Politics are politics and Sand Country production might rise faster than expected. Iran and Iraq could delay the peak for a little while while yet, although I consider this very unlikely.
One thing that still escapes me is the speed at which tight oil production can be ramped up again in the USA.
Some of the old hands on guys believe that a lack of experienced crew can hold back tight oil for a long time once the price goes up again but my gut feeling is that the drillers will find ways to train men fast once it is profitable to do so. If necessary ONE experienced guy can be put supervising two or even three new hands who have a basic background in heavy trades work.
You don’t have to teach such men not to smoke when handling explosives or flammable gases or stay out from under suspended loads or make sure the power is off before you stick a screwdriver in an electrical junction box.
The equipment is there, the mineral rights owners already know to within a meter where they want to drill the next well and all that sort of thing.
Maybe I am ALL wrong but my impression is that PAYROLL is a relatively small part of the expense of ACTUALLY drilling a well, or fracking it.
Doubling already high wages will draw capable men capable of learning fast out of the clear blue sky – literally – as the planes drop them off at the nearest airports.
Financing WILL NOT stop the revival of the tight oil business once great white shark businessmen are convinced it is profitable. There are plenty of that type out there who have control of ample amounts of money to drill a few wells or few dozen wells and once they are showing a profit more will jump in and the lenders will soon enough be back on board again.
I have no clear idea how high the price of oil must be in order for tight oil to be profitable. If the people who paid big money for land rights and existing infrastructure have to sell out cheap, then new owners may turn good profits at around a hundred bucks or maybe a hundred twenty or so per barrel. Maybe even less than a hundred.
Hi Old Farmer Mac.
The average Bakken well breaks even (paying a nominal return on investment of 10%, assuming 3% inflation) at about $75/b, maybe $80 (if there are some costs I have missed), assuming a well cost of $8.5 million.
Some lenders may have been burned so borrowing cost will be higher on the rebound so $90 to $100/b might be needed before a noticeable ramp up. It might take until 2017 for this to happen, it depends how quickly things ramp down in the LTO plays, we will probably see a big drop this winter, if things don’t pick up in the spring (no ramp up in output and maybe further declines) then oil prices might start to move by the end of 2016, hard to say how fast oil prices will climb, but my WAG is $100 by August 2018.
WSJ: Write-Downs Abound for Oil Producers
U.S. oil-and-gas producers have written down the value of their fields by more in 2015 than any full year in history
http://www.wsj.com/articles/write-downs-abound-for-oil-producers-1442184600
Oil companies will use a low oil price environment to write down the value of impaired properties with lousy technical (non oil price related) performance. This applies to projects with cost overruns, approved with reserves which turned out to be overestimated, plus those impacted by political developments.
For example, as far as I know oil companies with properties in Venezuela are booking huge reserves, they also book paper profits from the joint ventures. But the joint ventures don’t pay dividends. If a joint venture goes many years reporting paper profits but there’s no real cash being paid out the business isn’t really viable. This leads to a write down. But writing down $500 million in one of those JVs is much easier to hide if there’s a broad write down caused by low oil prices.
Companies like Chevron, Total, Repsol, Statoil, and Rosneft will eventually have to write down $ billions in Venezuela.
WSJ: Oil Patch Braces for Financial Reckoning
Smaller producers are girding for cuts to credit lines, as crude prices show little sign of rebounding
http://www.wsj.com/articles/oil-patch-braces-for-financial-reckoning-1442274651
old farmer mac,
There are lots of unknowns in predicting how quickly the domestic rig count can rebound from the current rout.
My speculation, which is of course no better than yours, is that it will not be so quick, maybe on the order of two or three years after prices recover to the $100+ level.
I agree that I don’t see finding hands to be the big impediment. What I believe could be a greater impediment is the lack of capital. After this shipwreck investors are probably going to be gun shy, and especially if they believe the Saudis have the excess production capacity to open the valves and leave them high and dry again.
And even though it looks like the European Central Bank is preparing for a hefty round of QE, we still don’t know what the PBOC and Fed are going to do. That will greatly affect the capital markets and the future availability of liquidity.
It could work out that way for sure- but depletion marches on and barring the world wide economy staying in the hospital or at least assisted living mode, I foresee shortages developing and it might not even be POSSIBLE for any country or even two (Saudi Arabia and Russia? ) to push prices down again.
And things worked differently in the past- When Rockefeller was rolling up the competition, he could move into a local market and run a small operator out of business.
There is a world wide market for oil now, and small operators will be able to sell their production into this market for almost exactly the same price the big boys get.
My old econ professor back in the Dark Ages explained it this way. A small steel mill owner could sell every thing he could produce for a dollar a ton less than US Steel to one big customer- leaving himself without his other customers. He could not charge MORE than USS though. So he got the same price or almost exactly the same price for the same exact product.
The Saudis might be willing to start ( or finish ) another price war in order to keep say four million barrels of American tight oil off the market.Can they afford to do that to keep one million barrels a day off the market?
IF not then tight oil will gain back even from a complete shutdown to a million barrels a day once the price goes up imo.
Of course I am a complete amateur when it comes to oil, but being a farmer I have watched the way markets work since I was a kid. Virtually all commercial scale farmers sell in competitive commodities markets with the exception of those who manage to get various governments to establish cartels for them.
The sugar cartel is the most important one in American agriculture at the moment. We used to have a tobacco cartel and citrus cartels etc although they were not referred to as such.
Hi OFM.
The Saudis might be willing to start ( or finish ) another price war in order to keep say four million barrels of American tight oil off the market.Can they afford to do that to keep one million barrels a day off the market?
I think the big unknown in all of this is how much oil could reach the market at a price of $110.00/barrel. As a thought experiment, assume that reserves can be brought on line instantly, or that the price of $110 is locked for 5 years (almost the same thing.) How much oil would be available?
How much Oil sands?
How much offshore?
How much arctic?
How much could be produced in Iraq (and other 3rd world producers) with the additional capitol for bribes, etc.?
How much biofuel?
My guess is that number is a lot more than the 2 to 3 million barrel per day oversupply that I will stipulate to here.
It may be that the Russians and Saudis aren’t worried about the shale oil dragon.
Maybe they’re worried about the rest of the dragons .
-Lloyd
Hi Glenn,
When oil prices go back to $100/b, and given a year or two at prices above $100/b, we might see a new peak in C+C output, at that point if a further rise in oil prices does not result in an economic crash and higher oil output is not reached, at that point I will be convinced we have reached peak affordable oil, my guess is that by 2019 or 2020 we might see oil above $150/b (in 2015$) for a short time, but it is likely to lead to an economic crisis if oil has peaked and everyone finally realizes it, the likely depression that will follow will reduce oil demand and output and oil prices will fall. When the economy finally recovers in 2040 to 2045 oil output might rise a little, but it will never reach the previous peak.
Only one possible scenario and of course it will miss the mark (depression will start between 2025 and 2030 and last 10 to 15 years). The crisis may be the kick in the pants needed to start the transition to other forms of transportation and better urban design.
In the meantime the problem is peak oil in certain countries like Syria. And global warming, too. From my website:
14/9/2015
Syria peak oil weakened government’s finances ahead of Arab Spring in 2011
http://crudeoilpeak.info/syria-peak-oil-weakened-governments-finances-ahead-of-arab-spring-in-2011
Thanks Matt, I always enjoyed reading your thorough analyses.
I agree. An absolutely outstanding analysis.
I fear a repeat of Syria could occur in Mexico. Could you imagine the consequences for the United States of having a Syria right next door?
Mexico seems to share some similar characteristics with Syria:
1) Declining oil production. Mexico has enormous oil and gas reserves, but they are all of the expensive-to-produce variety — shale and deep-water Gulf of Mexico.
2) Located so as to bear the brunt of global warming, and
3) With its location near the United States, a perfect candidate to become a pawn on the geopolitical chessboard for the big boys.
A recent study concluded that if global warming reaches 2°, this will not only mean a total loss of Mexico’s corn production, but will make the northern part of the country “uninhabitable.”
http://alef.mx/noreste-de-mexico-sera-inhabitable-con-el-calentamiento-global/
The graph below shows how Mexican oil revenues are in free-fall.
The only way oil can ‘go’ to $100/barrel is if customers around the world all of a sudden get rich.
Since the world economy = zero-sum Ponzi schemes (and close relative conduit schemes), there is absolutely no chance of that happening.
“Inflation … ” you say. Inflation for customers is the same for drillers, the relationship between the two factors does not change. Both driller and customer use the same dollar, peso, euro, yuan … each as the other.
If the economy holds on – does not get even SICKER – oil can and WILL go to a hundred bucks over a period of a few years in constant money. People change their ways and use oil more efficiently and will be able to afford hundred dollar oil in constant money.
Depletion and the rising cost of extracting ever smaller, deeper and more isolated from civilization oil guarantee the price WILL go to a hundred and eventually to TWO hundred- unless we learn to substitute other sources of energy. At less than two hundred coal to liquids and electric cars will work out ok.
I agree that the hundred dollar oil right now- say as the result of Russian and the Saudis deciding to cut a couple of million barrels each- would put the economy in the hospital.As things stand, the economy is pretty damned shaky.
“Out in the shale fields, it appears that a new kind of Moore’s Law is at work, with incredible new technologies making wells up to 50% more efficient per year! ”
I cant even figure out what this sentence means. Maybe I will have to read the article?
The article was written by a kid who has probably invested all of a whole evening in actually reading up on oil. No offense intended of course. At least he has a CLUE about some of the details and recognizes that peak oil is an absolute reality – if not now then soon enough to be a big problem for his readers.
That puts him in the elite one percent who understand at least some of the more important aspects of physical reality.
Looks like the Saudis increased production to contain excessive growth by marginal producers (the USA frackers weren’t the only ones relying on very high prices to justify their investments and continuing marginal well production).
Another issue: I still believe Venezuela is losing production capacity. OPEC doesn’t identify the “third source” information, and I suspect they are manipulating information they put in their report. What I hear coming out of Venezuela is terrible. The government is trying hard to create a conflict with Colombia, and simultaneously goading the Venezuelan people to revolt.
It’s probable the Maduro regime’s Cuban handlers want a violent showdown so they can implement a hard line Castro clone dictatorship. Obama’s very soft attitude towards the Castro machine may be encouraging them to gamble and go for a final solution, knowing the USA will accept a hard core human rights abusing dictatorship in venezuela. I don’t think a new USA president will be as incompetent as Obama in this region, and I bet the Castros feel the same. This tells me Venezuela’s oil production is dropping, and is likely to start having Lybia like performance over the next 18 months as the regime moves fast to consolidate itself as a fully fledged Castroite monster.
So gas prices have never been cheaper taking in inflation for the last decade. So all this oil abundance is creating economical nirvana this year? So with all that extra discretionary income due to low oil prices around why good majority of the buyers purchasing vehicles with 84 months of installments? Yeah right, nirvana.
Had a chance to peak at the seat reservation system for transatlantic flight to a major hub for a flight in 3 weeks where usually you pick & reserve seats at the time of the purchase instead of at the check in. Over 200 empty seats on a jumbo plane. Boy, who needs to waste money on a business class when you can stretch your legs by yourself on 4 seats in the mid -aisle section of the plane.
Looks to me that oil industry just joined the rest of other industries in just blowing smoke. It is just simply race to the bottom.
Ves, with wages barely growing at 2% nominal, the the decline in the price of oil is being offset by increasing rents for 30-35% of households and rising out-of-pocket costs for dis-ease care, including medical insurance premia.
The price of gasoline adjusted for CPI as a share of real wages for the bottom 80-90% is at the level of past recessions and lower than during the recession of the early 1990s.
US payroll receipts against reported wages and salaries imply that employment is overstated by as much as 1% or more.
Orders, wholesale sales, and freight spending and shipments are contracting YoY with industrial production mfg. rapidly decelerating YoY and inventory/sales soaring to recessionary levels of the past, including in early 2008 and spring-summer 2001.
Recessions are good for “gluts”. 🙂
“Recessions are good for “gluts”
Yup. The whole thing is funny, ppl are figuring out the motives of 1.5% oil production increases by Opec of the total world production (if the numbers are to believe) that are causing the whole world oil industry to unravel. Let’s repeat again the number, measly 1.5%. Well if you ask me then the whole oil industry is rotten by debt pyramid if excess of 1.5% is causing such havoc.
Oil is one of the small class of goods that display what is referred to as extremely inelastic demand. This means in a short supply situation the price skyrockets and in an excess supply situation the price crashes.
People will pay four bucks for ENOUGH gasoline to get by but not even a quarter for more than they CAN USE . Why should they , having no need for it, no opportunity to resell it, and no place to store it beyond a couple of jerry cans maybe??????????????????????????????????????????????????
A lot of people have a hard time accepting the basic truth that a very small ” EXCESS” supply of some goods gaurantees a price crash of those goods.
In order for the collective customer to be WILLING to buy the amount of oil coming to market, it was necessary for the price to crash.
This happens all the time to farmers. I have grown some of the most beautiful melt in your mouth county fair blue ribbon peaches imaginable and hauled a truck load of them around all day to nearby retailers trying to sell them without an offer to buy at ANY price.
Hauled them home and gave them to a local bootlegger who promised to bring back my hand make wooden boxes. He did. Years when peaches are in short supply he comes to me and pays me for blemished fruit.
I might have been able to sell some of those peaches by parking in town on the side of the street but you need permits for that these days and you can’t be two places at once.
A month earlier or later and I could have sold that load for a premium price but peaches get ripe in their own time and rot fast.
Now given time to adapt to low prices people will find ways to use a lot more gasoline to their advantage such as buying a bigger faster more stylish vehicle or taking a long car trip or moving farther from work to get a nicer house.
But this sort of adaptation takes a while, the time frame being measured in years rather than weeks and months.
There is nothing fundamentally wrong with supply and demand theory but a lot of people who are not NEARLY AS SMART as they think they are prefer to believe in shadowy traders in smoke filled rooms or some other such bullshit.
Such people do exist of course but they can only steal a few crumbs (amounting to a lot of money ) here and there because they HAVE NO WAY to control production, refining, and distribution- not to mention they have no way of controlling end users ranging from the Pentagon all the way down to the hard up guy who buys a gallon a week for his moped.
As Ron and a lot of other people have pointed out, there is no need to believe in a conspiracy or malice etc when the known facts are perfectly adequate to explain an issue.
Mac,
There is no conspiracy, we, as world economy, are broke. Oil can go to all the way to 10 cent a gallon, but that will not help you paying current outstanding debt. It’s all running on fumes at this point. But denial will prevent for majority to realize that for some time.
I agree the world is more or less broke and drowning in debt -but this has nothing to do with proving or disproving the validity of supply and demand theory.
I agree, no conspiracy, no conspiracy is necessary to explain oil producers bringing a little more oil to market than the end users want to buy at the former higher price. But the end users ARE buying ALL of the oil coming to market at the CURRENT LOW PRICE.
There is a possibility of a conspiracy on the part of foreign producers to force prices down- but I have seen no evidence to this effect and don’t believe any exists because I do not believe a conspiracy exists to keep oil prices low.
Ordinary market gyrations are perfectly adequate to explain supply outrunning consumption at hundred bucks a barrel.
Ordinary market adjustments that happen all by themselves will cause production to fall off soon as some producers are running “in the red” and will have to close shop.
Reduced supplies will result in higher prices before too long, maybe another year or so.
Hi Oldfarmermac,
It is not clear why you think the economy is so shaky, the US is doing fine. On debt I found a post by James Hamilton from last February.
http://econbrowser.com/archives/2015/02/sovereign-debt-scares-is-the-u-s-immune
He concludes:
My expectation of solid U.S. growth for 2015 will be another factor increasing near-term revenues and decreasing some spending items.
Hence my conclusion: Greece has a big problem right now with its current debt load. The U.S. does not.
Dennis Coyne said:
Maybe not.
US banks and investors are owed one hell of a lot of money, much of it from countries which rely on the export of primary materials — most of which are currently depressed — to make the dollars to pay their external debt.
Then US banks have a rather large loan portfolio to domestic oil & gas producers, and this also is beginning to look pretty shaky.
Nomi Prins gave a lecture in Mexico City a few days ago where she talks about all this. She concludes that:
The difference is that now, in contrast to the 1980s and 1990s debt crises, loan and bond amounts have not just been extended by private banks, but subsidized by the Fed and the ECB. The risk platform is elevated.
http://www.nomiprins.com/thoughts/2015/9/9/mexico-federal-reserve-policy-and-danger-ahead-for-emerging.html
I know all this flies in the face of the USA! USA! USA! crowd and the US national mythology of rugged individualism, but the truth is that the United States is not an island.
Maybe not.
US banks and investors are owed one hell of a lot of money, much of it from countries which rely on the export of primary materials — most of which are currently depressed — to make the dollars to pay their external debt.
Then US banks have a rather large loan portfolio to domestic oil & gas producers, and this also is beginning to look pretty shaky.
No mi Pri ns gave a lecture in Mexico City a few days ago where she talks about all this. She concludes that:
The difference is that now, in contrast to the 1980s and 1990s debt crises, loan and bond amounts have not just been extended by private banks, but subsidized by the Fed and the ECB. The risk platform is elevated.
I know all this flies in the face of the USA! USA! USA! crowd, US national mythology and the ethos of rugged individualism, but the truth is that the United States is not an island.
Hi Glenn Stehle,
In 2013, World GDP was 75 Trillion USdollars, your chart indicates $8.7 T to non-bank borrowers outside the US. For the rest of the World (non-US) GDP was about $58T in 2013, so a Debt to GDP ratio of about 15%, not really much cause for concern.
Dennis,
Well I’m certainly familiar with the “debt doesn’t matter” brigade.
It began rather inconspicuously with the deficitry and debtcraft of Richard Nixon (who declared back in the 1970s that “we’re all Keynesians now”), picked up a great deal of steam under Ronald Reagan with his supply-side tax-cut theology, and now finds its leading advocate in Paul Krugman, who argues debt doesn’t matter because “Debt is money we owe ourselves.”
http://krugman.blogs.nytimes.com/2015/02/06/debt-is-money-we-owe-to-ourselves/?_r=0
Taking the opposite side of the argument to that of Krugman are folks like Michael Pettis, who argues that not only does excessive external debt bog down an economy, but excessive internal debt does too.
“If we don’t understand both sides of China’s balance sheet, we understand neither”
http://blog.mpettis.com/2015/09/if-we-dont-understand-both-sides-of-chinas-balance-sheet-we-understand-neither/
Hi Glenn,
Nobody argues that debt doesn’t matter. The question is how much is too much.
If you think a Debt to GDP ratio of 15% is too high, I don’t think you will find much company in mainstream economics.
Do you think when an economy is in a severe recession we should follow the policies of Herbert Hoover?
I prefer the economic policies of FDR, though he had his doubts about fiscal stimulus (and the idea was very new at the time with the General Theory being published in 1936) and pulled back too early in 36.
The only thing worse than too much debt is not enough debt. Debt in moderation is a good thing.
Dennis,
What Glenn shows is cross border US dollar denominated debts.
What you need to focus on is total debt to GDP levels.
DC Wrote:
“Do you think when an economy is in a severe recession we should follow the policies of Herbert Hoover?
I prefer the economic policies of FDR”
FDR’s policy was a disaster. The US remained in a depression for nearly a decade and managed to exit only by entering a World War. I don’t get why anyone thinks FDR was a great president. But hes not alone, since Russians praise Stalin too, and the Chinese have their Mao.
There isn’t too much difference between Hoover and FDR. FDR continued most of Hoovers policies, but just doubled down on them.
“Hoover engaged in many unprecedented public works programs, including an increase in the Federal Buildings program of over $400 million and the establishment of the Division of Public Construction to spur public works planning. Hoover himself granted more subsidies to ship construction through the Federal Shipping Board and asked for a further $175 million appropriation for public works; this was followed in July 1930 with the expenditure of a giant $915 million public works program, including a Hoover Dam on the Colorado River.[107][108] In the spring of 1930, Hoover acquired from Congress an added $100 million to continue the Federal Farm Board lending and purchasing policies. At the end of 1929, the FFB established a national wool cooperative-the National Wool Marketing Corporation (NWMC) made up of 30 state associations. ”
https://en.wikipedia.org/wiki/Herbert_Hoover
The bottom line is that gov’t stimulus didn’t work in the 1930’s. FDR’s high tax policies prevented private sector from gaining any traction. After the war, the US had the only standing manufacturing base, as much of the overseas manufacturing was destroyed during the war, which avoided it from slipping back into the depression. Also FDR was no longer president which I am sure helped.
The US Debt to GDP is much higher than 15%. The US federal debt is at 100% of GDP. Then throw in Muni debt, Corporate debt, household debt, student debt, and so on its over 300%. And this is not counting unfunded liabilities such as retirement (SS, Medicare, Private and public Pensions)
The only way the US economy can avoid a depression is to continue to pile on more debt. Just Oil field depletion, there is also the Red Queen of Debt.
Globally, the world Debt to GDP is also higher than 15%. Need to include non central gov’t debt (ie muni, Corporate, household, etc) Also like the US. many gov’t hide unfund liabilities and Debt. Example was Greece, but most of the rest of the EU does the same thing, perhaps not on the same scale, and they hide it better.
We have a perfect storm headed towards us: a triangle of mounting problems: Cheap energy depletion, Mountain of debt, and an aging population. Then throw in a few side issues like water shortages, over population, Ethnic/Religions tensions, etc and you have a clear path to another global war.
Recall that Facists & Communist rose to power on the heels of economic crisises in Europe and Asia after the end of World War 1. Nations that endure an economic crisis like Greece will also select Fascist and Communist gov’ts. Nations enduring economic crisis usually have civil wars, ie Fascist vs Communists, fighting for control.
In my opinion,this Refugee crisis hitting the EU has a high probability of causing the next ethic war in the EU. Europeans will start rebelling against the islamists as the start consuming resources, jobs and see higher taxes for increase social welfare spending on the refugees.
US total debt liabilties exceed $59T:
https://research.stlouisfed.org/fred2/series/TCMDO
Ron, thanks for the post. You said: “OPEC expects Non-OPEC total liquids to be up a mere 160,000 bpd next year with US and Canada increasing by 30,000 bpd. That means that they expect the rest of Non-OPEC to be down by 14,000 bpd.”
The numbers do not add up. Did you mean “OPEC expect non-OPEC total liquids to be up a mere 16,000 bpd”?
US liquids production is expected to grow by 0.22 mb/d
Canada + 0.17 mb/d
Latin America (non-OPEC, non-OECD) +0.04
Russia – 0.11 mb/d
Rest of FSU – 0.11 mb/d
OECD Europe – 0.02 mb/d
Total non-OPEC + 0.16 mb/d
OPEC definition of total liquids includes C+C+NGLs+ GTL+CTL+ biofuels, but excludes processing gains
OPEC, like the USA’s EIA, are distorting forecasts to fit their needs/goals. Saudi Arabia has a very transparent strategy: drive oil prices down to bankrupt a portion of oil companies, teach their lenders a lesson, and make sure the production excess doesn’t repeat for at least ten years. This will be accomplished within 12 months as companies declare bankruptcy, sell properties to healthier companies, and banks write off a portion of the oil loan portfolios.
This process takes time because bureaucracies react slowly. But it’s going on right now. The Saudis will continue producing and observe as non OPEC production declines. But they will also use the monthly report to forecast production increases they ought to know aren’t realistic. The overprediction dampens the oil price, and speeds up the Darwinian extinction process the industry is undergoing.
As for the EIA, it seems to be flying in tandem with Saudi Arabia. But my guess is their aim is political. The USA government wants countries like Iran and Russia to be gasping for air. This must have been what has been driving the EIA to overprediction as a general rule.
Thanks PE. I usually make at least one error in every post and I do appreciate you pointing it out to me so I can quickly correct my error. It is fixed now.
Thanks again.
Ron,
OECD Americas include US, Canada, Mexico and Chile.
This region is expected to add 300 kbd
US and Canada +390 kbd
Mexico and Chile – 90 kbd
True but the first chart is not about OECD America, it is North America which is USA, Canada and Mexico. The second chart would include Chile in the mix but that would make little difference.
You are correct, Chile and Mexico would subtract from the total, not add to it. But I doubt very seriously that the US and Canada will increase production by 390,000 bpd. I expect there to be a decline from all North America.
I agree with you. I noticed that OPEC is usually late for a month with changes in global oil supply forecasts.
Both IEA and EIA have sharply downgraded their forecasts of US oil production next year. IEA now expects US C+C+NGLs production to decline by 160 kb/d in 2016. LTO production is expected to decline by 385 kb/d, partially offset by increases in the GoM and NGLs output.
EIA expects US C+C production to decline by 400 kb/d, and C+C+NGLs by 140 kb/d.
But OPEC is still projecting an increase of 220 kb/d
All of the above makes me wonder- what are these guys really after? Money? So they are in a flaky business. Why not put their chips on a relatively sure thing, which is of course in my head, wind/solar, getting more bang for buck every single day?
None, or dam few, seem to have any care for the future generations, and any regard for the fact that ff’s, which they are endlessly huffing-puffing to get more of, are gonna kill the biosphere.
And most puzzling of all, they know all of this full well, as much as any bunch I have ever met. Yet,– yet more huff-puff for ff. Somebody please tell me why.
PS- I have learned even more than I wanted to about oil business here, probably good for me.
I have even learned some about not-oil energy, for which I am grateful, it being my profession and hobby.
Wimbi
Many a poor sailor has been lured upon the rocks by the call of the sirens.
Money was just sitting underground and all they had to do was make holes in the earth to have it pour out. But they made deals with the bankers and investors to make those holes. Payments are due and the money has shrunk to less than half.
Oil men called onto the rocks, what irony. Happens in every business. There is no sure thing, we just see the survivors and forget about those that lost their shirts, so things look better than they actually are.
Lots of people made lots of money from this oil rush. The ones left holding the bag are in trouble now, but the rest got paid along the way for providing materials, transport and services. Without those courageous few at the top and without the investors and banks, all the others would not have made money.
As far as the moral aspect, any oil man is going to look you in the eye and say “What if we all just quit and went home? Where would you be then?” So there is the short term and long term view. We know that a transistion must be made but we don’t seem to know how to do it very well or plan it. When the hunting got thin, the tribe moved on. They learned to not thin it so much and move on earlier. We have no history or tradition to tell us how to do anything but expand or die. We have to make it up as we go and are working against the tide of precedent. That means building confidence in a trip into the unknown. Not easy.
The oilcos made money when they borrowed not after they drilled.
At issue is whether they get the chance to borrow a second time pocketing more money. At further issue is whether there will be any more oilcos!
Remember, tycoons get paid first, everyone else has to pick up the tab, afterward.
Never said the oil companies made money.
Thanks for the reply, Zep. I didn’t expect any since my comment was provocative.
http://www.resilience.org/stories/2015-09-09/limits-to-growth-an-update
There’s what I think, and the last few minutes say what I am doing, and LOTS of people around here are also. Especially important–WE ARE HAVING FUN DOING IT.
So my answer to “where would you be then?” is, not all that bad, thanks.
Just think of all the resources we would suddenly have if the oil guys just quit and went home! Everybody would jump right on renewables and simplicity and quitting the worthless busyness we see all around now.
And I DO NOT buy the argument that without oil we wouldn’t be able to move around, do anything, etc etc.
Here, before anybody’s tank went dry, there would be guys trying to sell them kits that run that car on wood gas. Make that garbage gas, which has a lot of plastic in it which we all know is just solidified petroleum and has gobs of energy.
I just gave a little pep talk to a mob of lifeboat builders at a very well attended local energy fair. I was preaching to a choir that was running ahead of me. They were already doing what I was saying could and should be done.
Am I hallucinating? Don’t think so.
Winbi, most oil companies won’t invest in wind turbines or solar. It doesn’t make any business sense. Those who propose such moves don’t understand how to run a large business or have practical experience in these matters.
What you propose is similar to asking Farmer Mac to invest everything he has in a Holiday Inn franchise and 12 story hotel next to the UC Berkeley campus. Ask him what he thinks about it.
Wind and solar. “doesn’t make any business sense”. Yep, have heard that ten thousand times during the years I ran around the world demonstrating solar. That’s why I at long last realized that “business sense” didn’t make any sense in my understanding of the meaning of the word.
But now we have a little problem to explain. I hear that most of last year’s new energy money went into—wind and solar. How can that be true? Doesn’t make any business sense.
Winbi, most oil companies won’t invest in wind turbines or solar. It doesn’t make any business sense. Those who propose such moves don’t understand how to run a large business or have practical experience in these matters.
Doesn’t matter because the banks do understand how to finance large businesses and they are investing in wind and solar, big time while they are starting to reduce the available capital to a failing oil business model.
http://www.energypost.eu/ubs-citigroup-warn-investors-massive-revolution-energy-industry/
Of course I could be wrong but I see the oil business transitioning into providing very expensive feed stock to the petrochemical industry. The refinery businesses that produce gasoline and other fuels to be burned in transport I think are going to be slowly phased out. This is a completely new paradigm. Most of the players who insist on trying to hang on to the old paradigm are going to lose big time.
Banks don’t invest in solar and wind. Neither does coca cola, nor Nissan, nor general foods, nor Merck, nor Disney, nor Sony, nor 3M. Get it?
Banks don’t invest in solar and wind. -Fernando
How about Duke Energy and Dresser-Rand Group then?
2,000 MW+ Wyoming wind project with compressed air energy storage:
http://www.denverpost.com/business/ci_26593057/wyoming-wind-farm-energy-would-go-l
How about Philip Anschutz and his Power Company of Wyoming?
3,000 MW Wyoming wind project:
http://www.psmag.com/nature-and-technology/how-a-conservative-billionaire-is-moving-heaven-and-earth-to-become-the-biggest-alternative-energy-giant-in-the-country
“We’re doing it with good science and good planning. But don’t forget, we’re capitalists. We’re doing this to make money. This is what we do for a living,” – Bill Miller, Power Company of Wyoming
“When the engineers handed him a plan with 1,000 turbines stretching for more than 20 miles across the highest ridges on the ranch, where the wind is at its fiercest, Miller signed off. A thousand turbines was double the number at the most powerful wind farm in the nation, the Alta Wind Energy Center in Kern County, California. Miller also asked for the largest turbines on the market, which, at $4 million apiece, rise to nearly the height of the Washington Monument and have a capacity of more than three megawatts each. All told, Anschutz’s wind farm would be able to produce more than 3,000 megawatts of power, four times the electricity produced by the Hoover Dam and enough to power every home in Los Angeles and San Francisco.
(bold mine)
Banks don’t invest in solar and wind.
Perhaps but Investment Banks do!
And there is zero doubt that even regular banks finance wind and solar.
Analysts at Citibank predict global growth in solar could be at least 65 percent higher on average than what the International Energy Agency predicts through 2020. Citi’s solar PV forecast shows an average global installation rate of 53 gigawatts per year between 2013 and 2020. The IEA, by comparison, forecasts an average global installation rate of 33 gigawatts to 34 gigawatts per year over the same period.
GTM Research’s global PV forecast is significantly higher than both Citi’s and the IEA’s, coming in at an average of 75.5 gigawatts per year between 2013 and 2020.
Perhaps I’m not the one who doesn’t get it…
Thanks for the update,Ron.
At your convenience, I would like to have your (somewhat detailed) take on the the first graph from ~Apr’12 to ~August’15 time-frame.
“So those declaring the death of peak oil far outnumber those who say peak oil is here today. ”
In ’05-’06-’07, those declaring that we all would live in bazillion dollar mentions and flip them to make more gazillions and ever greater riches – far outnumbered Jim Rickards, Peter Schiff and Robert Schiller (and a few others) …..but then, ’08, ’09 came along…….and kaboom!
“I think there are some folks who are in for a rude awakening”
I think some folks are in for a CRUDE (pun intended!) awakening …..and all of us are in for something that shall dwarf even the doomiest(is that a word?!) of the doomers…
Be well,
Petro
Thanks for the post Ron.
A quick note on the ND numbers: total daily production in ND dropped with 0.78% from the previous month (9408 bopd). The drop was less severe than I expected, mostly due to:
1) 136 wells were started vs 111 spudded (in June 121 wells were started vs 108 spudded)
2) initial flow from the July wells was about 10% higher than wells starting in June. That was pretty good, although a few months in the past have seen better wells, and there is still no proof that 2015 wells are significantly (>10%) better than 2014 wells.
In the beginning of July WTI was still close to $60, so I think operators may have reduced August output more than for July.
Gas/oil ratio increased slightly further, and water/oil ratio dropped a bit.
Enno
I had seen individual well profiles from Bruce Oksol’s site that indicated significant choking back was occurring. This view was prompted by huge dropoffs in output, far exceeding normal decline.
Rune Likvern posted an informative graph a few weeks ago showing vintage well output in color code by year for, I think, Oasis. If I remember correctly, all the wells had both a simultaneous, sharp, drop, and then an INCREASE in output this past winter and spring.
The only logical conclusion to be made for the increase, I believe, is if the wells had been restrained by choking (the purpose being holding off sales in the extreme low price environment.
So, my question to you, do you follow individual well output on a month by month basis to see if these types of fluctuations/increases occur?
I imagine it would be quite time consuming, but enlightening if, in fact, it would support the observation that this choking is taking place.
Coffee,
There may have been some choking of the wells in the past, but I feel with the increasing gas production, and dropping oil production is an indication that the wells are being opened up and flowed to the max.
If this is the case, we will see a sharp drop in production in the next few months. It would help to explain how Continental, plan to not complete 60 wells by the end of the year, yet still increase production!
Maybe production was cut to avoid excess gas flaring. Water cut also changes due to shut in of high water cut wells because water disposal cost exceeds gross revenue minus other real ongoing opex.
Coffee,
I do have all the individual well profiles, with monthly oil/gas/water production data, and also the number of producing days. However, as there are > 10.000 wells, it is no use to manually try to determine whether wells are being choked or not. There are many cases where there are sudden jumps up and down in production, and I can’t think of a way to determine whether and how much a certain well is being choked. The only thing I can see is that based on the # of producing days, I don’t see a difference with the 2014 numbers, so at least it seems that wells on average are not produced significantly fewer days than in 2014. If you or somebody else could provide a simple algorithm, based on the available data, that would tell relatively reliable whether and or how how much a well is being choked, then I might be able to implement that.
So in short, choking may be a (significant) factor, but so far I didn’t find a way to extract that from the data in an automated way, nor would I be able to find it by manually reviewing the individual well data.
In a similar way, I am unable to reliably detect the effect of refracs, or fracs on nearby wells, which would skew the data to the upside. Finding those may be a little easier though, as geo-information is available, and a refrac pattern would probably be more obvious.
The view that Mike and others have expressed, that wells may be pushed harder during this period, seems to me more reasonable for the average shale producer without a lot of cash in the bank (so probably all except EOG). I think most producers are struggling for survival now, and all have a need to show strength to creditors, and saving cash flow for later doesn’t fit in such a situation. The rising gas/oil ratio may be an indication of that (1.01 in Jan 2014, and now 1.31 in July 2015, for the whole of ND). If saving oil for later was a priority, you would also expect that more wells are spudded than started, but the reverse is the case already since Feb.
Push, Enno
I agree completely with both your observations with one qualification. I’m gonna see if I can track down Rune’s graph (perhaps Mr. Likvern might be gracious enough to add input) and pinpoint some of the actual wells/data.
The thing is, if this company (Oasis?) undeniably constrained output throughout all its wells, and then ‘opened ’em up’ as per the accross-the-board, through all vintages, increase, as Rune’s graph seem to show, it would significantly impact the correct evaluation of many/most? Bakken wells.
Absent any operator declaring this is their policy, a granular analysis, bokoo time consuming, might be the only effective method to prove or disprove this.
Guys, how many wells are flowing in the Bakken v on artificial lift?
Is there a way to determine that?
Shallow
That info should be available to someone with that ND DMR subscription, which I never got around to getting.
I did come across two data points recently involving AI in the Bakken.
Some outfit (Zavanna?) took a well offline for awhile to install gas lift hardware. When they went back online, the production jumped way higher than previously.
EOG, apparently, goes very quickly to ESP on all their Bakken wells. Kinda curious, but those guys sure know what they’re doin’.
Wow that sounds expensive to go back on to install an esp and to run power . How far down would it have to go? All the way to kickoff?
Let’s assume a well produces 0.1 BOPD per psi pressure drop in the horizontal leg. The pressure drop is taken from the well liner to a point several hundred feet away from the wellbore (I’m taking a short cut).
When a well is shut in to install the new hardware the pressure builds up very fast at first, but as time goes by the rate of pressure increase slows down gradually. This means that a well shut in for say 30 days has built pressure in the near well area and will produce at a higher rate (for a while).
If the artificial lift system (say gas lift) drops the pressure by 500 psi at the horizontal level this hypothetical well will produce 50 BOPD on top of what it produced before. The pressure build during the shut in period can easily be 1000 psi. This leads to a short lived burst from say 100 BOPD to 250 BOPD, which of course drops off in a hurry. The well will eventually produce a bit more with the artificial lift in place, but the “steady production gain” would be lower, a bit less than 50 BOPD.
As a general rule a well completed in a high pressure and low quality zone will not benefit much from artificial lift.
Installing gas lift mandrels with “dummy valves” is good practice if regulations allow it, and the chosen artificial lift is gas lift.
Installing ESPs is a bit trickier, if the well makes water and the pump seals are exposed to well fluids the pressure cycles involved in shut ins can introduce water into the motor itself, which of course isn’t sanitary. But an operator can install an ESP in the straight hole section above the build to horizontal and drop the pressure in the horizontal leg as much as 1500 psi (this depends on the well’s directional design).
A well can also be drilled with an early directional kick but a very gentle build to allow running an ESP way down. But most ESP s hate sitting at an angle, because it screws the bearing loads. So once the pump is being run deep the best solution is to run it way down to have it sit in a near horizontal position in a very straight section.
This gets really complicated, it depends on a bunch of factors. I don’t have the detailed well designs nor the reservoir performance data, but it’s clear this problem has multiple solutions. It’s one of those things like buy Ford or buy Dodge.
The free annual production reports (here is the one for 2014, for example) display that information, but only as up-to-date as the end of the year the report covers, of course.
Still, doing a simple text search in last year’s report of how many times “SOW: AL” appears versus “SOW: F” shows about 83% of the wells in North Dakota were on artificial lift.
coffeeg, everyone,
Just a small FYI: ND is mentioning (so far) that the one-year requirement to move to production could be waived or massaged, to reduce addition to oversupply.
This was on Rigzone or Downstreamtoday, today.
Coffee,
Your wording is interesting;
“I had seen individual well profiles from Bruce Oksol’s site that indicated significant choking back was occurring. This view was prompted by huge dropoffs in output, far exceeding normal decline.”
Being more specific would be helpful.
I have detailed data on all wells by 14 companies (going back to 2006) and several of the pools, the only company I found had an extraction development out of pattern was Slawson.
Below is a chart showing 4 of Slawson’s wells started early in 2014.
There is no sign of choking back for the wells shown in the chart below.
Something is going on, but what become educated guesses.
My best guess is that those are the shutdowns to put in artificial lift, but they do seem to be taking a really long time. That would seem to indicate a really weak or really strong cash position, but I’m not sure which. They might not have cash to finish, or they might have so much that they don’t mind shutting in and waiting for better prices. They’re private so they don’t have to say.
There isn’t really a production boost afterwards, though, so if that’s it, it didn’t work out for those two wells.
how much, if any, Saudi production action do you attribute to the possible threat to them the EV poses? Are they trying to push the mass EV rollout much further into the future?
haha zero
And who gets the last laugh?
There are a billion cars in this world, a thousand million. There are fewer than a million electrics, this is after years of production. EVs will never catch up, all else being equal.
All else isn’t equal, it is industrialization itself that is bankrupt, not just some of its components.
Steve is right – in the long haul.
But the end of industrialization is not yet, and unless there is a FAST crash, electric car production is going to grow like crabgrass. Battery costs are falling by half every five years while oil will imo be well over a hundred bucks in 2020.
I may live long enough to buy a ratted out old Leaf for a thousand bucks that will go “only ” forty miles on a “worn out” battery.
But it”s only twenty five miles to town and back. 😉
And the truck will still be here, if I have to go farther.
Given no oil changes, very few repairs given no transmission radiator alternator starter gas pump water pump muffler tail pipe conventional battery etc etc , and high gas prices, and a couple of thousand dollars worth of pv in my side yard ( no NEED for a farmer to do something so insanely expensive and troublesome as to build something on his ROOF ) a dirt cheap old ratted out Leaf or Volt could pay for itself in a year in gasoline alone , if I worked an evening or night shift so as to charge it with free solar juice most days.
The solution to poor working people’s commuting problem will be dirt cheap well used electric cars- just as it is today cheap old conventional used cars.
Given that I am retired and can manage most trips to town in a couple of hours and early or late or even at night, I might not have to drive the truck in place of the Leaf more than once a month or so except maybe during an extreme wet spell.
If there’s a fast crash electric vehicles will be the last thing people will buy. Go visit Bangkok and see what they drive.
The EIA Drilling Productivity report is out.
The DPR team now expects Eagle Ford production to drop by almost 300 kb/d from April to October
Bakken region is expected to decline by just 80 kb/d from December 2014 peak to October
Permian production is still growing
Saudi Arabia’s oil production per capita peaked in 2004-05 and is at the level of the late 1990s, which is similar to the US in the early to mid-1980s at the onset of deindustrialization and financialization. Saudi Arabia is at war and requires borrowing to fund social welfare spending.
China’s oil production per capita peaked in 2008-10, which aligns with where the US was in the late 1970s.
Peak Oil per capita is a decade in the rear view mirror. Growth of fossil fuel-induced global industrialization is done. The world cannot afford to grow real GDP per capita AND build-out renewables AND maintain the fossil fuel infrastructure indefinitely. Something has to give and it will be real GDP per capita and the further build-out of renewables.
Peak Oil. Overshoot/bottleneck. Limits to Growth. End of growth.
Next comes another global deflationary recession and financial crisis; global real trade and GDP per capita stagnation and eventual decline; peak and decline per capita of food production, supplies, and utilization; increasing scale of mass-population migration and resulting ethnic/racial/religious conflict and violence; a growing number of failed states; and emerging imperatives and evidence of a last-man-standing contest between the West and China for the remaining resources of the planet, including the eventual collapse of US-China trade and diplomatic relations, blockades and embargoes of China, and increasing risk of war between the US-NATO and China.
I haven’t yet read the “death of peak oil” articles that were posted by Ron, but it seems to me that such articles hurt the oil industry by maintaining we’re awash in oil, therefore encouraging lower oil prices.
Who are the “there’s no peak oil” articles supposed to help? I suppose they encourage more investment in trucks and such, but beyond that, why would anyone want to lower oil prices even more than they are now?
Boomer…you got it backasswards….Ron is suggesting the opposite.
Boomer II, “national security”; mass-social propaganda/conditioning to discourage a deflationary mindset taking hold among businesses, households, and financial markets and to encourage and reinforce the perpetual growth paradigm; and discredit analyses, implications, and prescriptions that would challenge or invalidate the Establishment consensus/metanarrative, which in turn would challenge the credibility, legitimacy, and conferred authority to rule by Wall St. and The City, TBTE banks, Fortune 25-100 managers and owners, rentier Power Elite top 0.0001%, et al.
A full understanding of Peak Oil and its implications encourages questioning of the assumption that perpetual growth of population, resource consumption, profits, and capital accumulation is possible This compels seeking alternatives to the Oil Age assumptions, which in turn requires the courage to envision a rather different, even radically different, set of values, incentives, efficiency, social contract, financial system, labor division, distribution of income and wealth, tax code, and so on.
Peak Oil is inextricably linked to the issues of population overshoot, resource depletion, climate change, “Limits to Growth” (and the end of growth and of “globalization”), “secular stagnation”, QE and financial bubbles, and wealth and income inequality.
To understand Peak Oil is to be equipped to synthesize the related issues into a comprehensive global metanarrative that challenges the Establishment metanarrative on which the rentier Power Elite and their Establishment academic and technocratic intelligentsia and mass-media influentials depend for their credibility, legitimacy, influence, and power.
To fully articulate a comprehensive metanarrative about Peak Oil is to challenge the very legitimacy of the Anglo-American imperial ruling elites’ basis of wealth, privilege, and power.
See, easy as pie and to think some people see this as a huge problem.
“sarc”
BC, you’re a deep thinker and I suspect not a lot of people take enough time and thought to really understand what you’re saying. I just want to let you know — I “get it”.
Of primary national security significance is the imperative to keep the general public fully invested in “the system” — believing that “all is well”, that our establishment leaders have “got it handled”.
As a national security imperative, it goes without saying that the full force of the federal government and its operative agencies (CIA, NSA, FBI, etc…) are one-hundred percent engaged — no doubt in behind-the-scenes partnership with Corporate America — all working together to keep the hologram intact.
I know from past posts that Ron disagrees with this “conspiracy theory”, which is fine. Others understand. The 24/7/365 barrage of “news and analysis”, combined with “official” statistics published — all are coordinated and designed to achieve the desired effect.
We are living in a make-believe world. When the fantasy dissolves like vapor in the wind, we’ll be in serious trouble.
At some point the curtain will have to drop, no doubt scapegoats will be carefully lined up before that occurs though.
I wonder if there will ever be a mass awareness or understanding of the true picture within the general populace? I also wonder how much long the can-kicking and financial contortions can continue for.
We are living in a make-believe world.
No, you are living in a make-believe world. Most everyone else knows better than to believe such crap. I say most everyone because there are some people who would believe the wildest conspiracy theory no matter how improbable.
So, you’re saying that everything is just fine? Most people DO seem to think so, despite the fact that “most people” are clueless about just about everything in regards to peak oil and economic matters. Are those the ones you’re referring to?
The mass media and politicians certainly project confidence in a bright financial future of an America well on its way to economic recovery. What? That’s not “make believe”???
So, you’re saying that stock markets are NOT totally manipulated to keep asset prices elevated and to project economic strength and stability where none exists? That government agencies are reliably and accurately reporting GDP, employment and other statistics related to the economy, with the purpose of presenting a truthful and fact-based representation of economic reality? That tight oil companies are in fact contributing significant net energy to the world economy despite the grim reality that they can’t turn a single buck of profit on average after all these years of burning through hundreds of billion$? That the government agencies that oversee stock markets and energy industry are all dutifully reporting the full truth and nothing but the truth to consumers and investors alike so that they can make informed decisions?
Give me a break. You’re a great statistics guy Ron, but now you’re making me think that YOU are the one living in a make-believe world. Maybe I’m not getting your point. What “crap” are you referring to?
Dave P said, “no doubt scapegoats will be carefully lined up before that occurs though.”
Bingo. That’s our modus operandi, since time immemorial.
NoItAll, don’t be too hard on Ron, he’s a great data compiler/presenter after all. We all have our weak spots, and remember, the TV, mass media outlets and their parrots are pretty good at telling us of who the bad guys are.
Russian exports fell some in 2014 compared to higher exports between 2003 and 2013. Exports began to increase in 2003.
http://www.cbr.ru/Eng/statistics/print.aspx?file=credit_statistics/crude_oil_e.htm&pid=svs&sid=vt1
I had already posted this chart
Russia’s crude and refined products exports (million tons).
Per Alex’s chart:
Note that as refined product exports increase,Russian crude exports must necessarily decrease at any given level of production.
The Saudis and some other exporting countries as well seem to be investing heavily in refineries and chemical manufacture within their own borders.
Over time this implies a LOSS of refinery capacity and petrochemical manufacturing capacity in importing countries. With inadequate feed stocks these industries MUST shrink.
I leave it to the reader as homework to explain the significance of this observation.
OFM,
You are right. Russian companies have been heavily investing in modernization and expansion of their refineries, and are now exporting a much higher percentage of liquids in the form of refined products (primarily diesel) rather than crude. Similarly, Saudi Arabia and some other Gulf countries have built new refining capacity and starting to export increasing quantities of refined products. That caused massive closure of old refining capacity in Europe.
Of course Russian refined product exports are up. Putin has severely tax advantaged product exports relative to crude exports. It’s mostly a matter of indifference for the rest of the world.
This person wrote an excellent little piece about decline rates and demand growth:
http://www.investorvillage.com/smbd.asp?mb=5035&mn=29937&pt=msg&mid=15292307
Greenbub. This is a good article, and I can assure you it is playing out in real life, based on our example.
After drilling 2-4 wells annually, none this year, no plans for next year either. Only two work overs this year, none planned in the future. About 5% of production shut in due to very low prices.
Assuming others are acting in this manner, would assume link is accurate. Low prices will take their toll, the unknown is the duration required to see the supply/demand balance.
And as I have frequently noted, it’s very likely that actual global crude oil production* has been flat to down since 2005, despite trillions of dollars in upstream capex. Therefore, given cuts in upstream capex, it’s reasonable to expect a decline in global liquids production to be most pronounced in regard to actual crude oil production–the quantity of the stuff that corresponds to the global oil price indexes.
*Most commonly defined as 45 API gravity and lower crude oil
I am sorry but that begs for an explanation…
Where are we now in relation to this cliff? 50:1?
‘Worth more’ in what sense?
It would only be ‘worth more’ to a society that could afford it– it, being of an increasingly-lower-quality product at an increasingly-higher-cost to obtain and using itself to obtain it to boot… That’s a positive feedback: increasingly costly to get–> increasingly lower quality –> increasingly costly to produce/refine –> increasingly costly to get…
If I am the only customer (I rep the global economy) for the only bike of a company (it reps all oil producers) and the bike is worth a lot to me because it gets me to where I want to go, but I can’t afford its price, and the company relies on me to buy its bike, but it has a hard time producing it and selling it at a price I can afford, then how much it is worth is kind of irrelevant, except I guess where my and the company’s well-being is concerned.
Many other forms of technology like hydro and nuclear require a lot of oil input (never mind the nuclear waste can ceaselessly being kicked down the road to ruin), and in the context of the aforementioned, and in other contexts, like a degrading ecosystem and increasing population, some of which want the ‘Western lifestyle’.
BW Hill or a member of its group might be speaking about price in a certain way, perhaps in some ‘absolute’ sense and/or with regard to some kinds of ‘pins’/’pegs’ to the global prices of crude at certain points in the past, extrapolated forward.
Price doesn’t matter if there is no demand, no?
Maybe for the reasons I just mentioned. The increased demand via cheaper prices for an increasingly-problematic/inferior and non-renewable product will erode its own demand, thus price.
Like the apparent ethanol nonsense? Greater inputs than what comes out? Land and food issues?
‘u^
Maybe the price will shoot way up until only a handful of people can afford it. But that’s not a global economy as we know it anymore.
Hi Caelan,
The amount of work that can be accomplished by a given amount of energy is not fixed. As the price of energy rises energy will be converted to work more efficiently.
I will give a very simple example.
When work is done on an object such as moving a piece of freight it is proportional to the distance the freight is moved (we will assume no change in elevation for simplicity) if we assume the mass of the object is unchanged and that the gravitational constant(g) at the surface of the earth remains relatively constant. Let’s say the freight is 50 kg of rice that we will buy at a grocery store and that we will drive our car to the store to get it. Driving the car to the store and back without getting anything does zero work, but if we don’t forget to buy the rice then some work is done. (Moving 50 kg over a distance of10 km.)
If the store is 10 km from home, then 4.9 MJ of work is done getting the 50 kg of rice home from the store. If I drive a pickup truck to get the rice and get 20 MPG and use 0.62 gallons of gasoline which is 81.7 MJ of energy so 4.9/81.7=6% of the energy is converted to work in this case.
A prius would use only 0.248 gallons of fuel or 32.7 MJ of energy and the efficiency goes to 4.9/32.7=15%.
In the simple example above the choice of vehicle can change the amount of energy required by more than a factor of 2.
An EV (Nissan Leaf) would accomplish the task using 13.4 MJ of electricity or 4.9/13.4=36% efficiency or 6 times higher than the pickup truck.
There is a great deal of waste in the current system as Wimbi has pointed out so often.
DC,
I think Caelan is driving the point is that when the cost of extracting energy (Oil) is takes close to the amount of energy extracted, we have a problem, no matter how efficient cars and trucks become.
Also the issue is that there is an cost for efficiency. The higher the efficiency, the more complex and costly it becomes to manufacture it. Also maintenance becomes an issue with more efficient, complex systems as the increase complexity has an increase probability of failures and often requires higher maintenance.
Here is an example. Utilities are replacing gas turbines with less efficient ones because the more efficient turbines have much higher maintenance costs:
“However, since this air is ‘stolen’ from the gas turbine it has the effect of lowering overall efficiency. Steam cooling, in which steam from the steam cycle of the combined-cycle plant is used to cool the components internally does not have the same efficiency cost. This is the solution adopted by MHI, and by GE for their high-efficiency G-class and H-class machines. However Siemens are using air cooling for their latest H-class turbine and Alstom’s turbines are also air cooled.”
http://www.powerengineeringint.com/articles/print/volume-19/issue-3/gas-steam-turbine-directory/efficiency-versus-flexibility-advances-in-gas-turbine-technology.html
Consumers are less like to be able to afford more efficient systems. Perhaps you can afford a EV, but the single mom with three kids, who is struggling to mean ends, probably can’t.
http://blogs.wsj.com/experts/2015/09/14/get-ready-for-oil-company-write-downs/
Did anyone catch Trump’s Dallas pronouncements on energy. Elect Trump and our problems are solved. We will be energy independent. If I wasn’t so lazy I would listen to the replay and write the exact quotes.
BREAKING: Pennsylvania naturalgas data out:
Jan 12.58 bcf/d,
Feb 12.67,
Mar 12.75,
Apr 12.52,
May 12.05,
Jun 11.99
Jul 10.64
May15 production revised up from 11.90 to 12.05(the initial value),June up from 11.92 to 11.99. All other months had extremely small variations. I remark that the max variation with monthly data was +/- 0.25 bcf/d.
Data here:
http://www.depreportingservices.state.pa.us/ReportServer/Pages/ReportViewer.aspx?%2fOil_Gas%2fOil_Gas_Well_Historical_Production_Report
They’re still capped by transportation and not production during the summer. We’re going to have to wait for winter to get meaningful y/y comparisons.
Thanks for the info.
Romney (the father) was worried about what is now called peak oil some sixty years ago. He tended to make fuel efficient cars. Also made the only sedan with seats that reclined to a double bed. https://books.google.com/books?id=SeATsSDTmaEC&pg=PA176&dq=ed+zern+nash+bed&hl=en&sa=X&ved=0CCcQ6AEwAGoVChMI6bHsrfj4xwIVhjmICh36Pwop#v=onepage&q=ed%20zern%20nash%20bed&f=false
Back in October of 2008, the clowns who were running the financial industry up in New York City marched up to Capitol Hill and begged Congress for 700 billion dollars to keep from going bankrupt.
Congress, the fools that they are and have been for years, obliged and handed over the money. It was the tithing owed from decades of taxing Wall Street too much, when you owe, somebody collects, doesn’t matter who you are. Willie Sutton would have asked for more, lots more.
Attila the Hun was a gentle soul compared to the brainless fools on Wall Street.
Tricks and treachery are for fools that don’t have the brains to be honest. – Benjamin Franklin
All the oil industry has to do is approach the US Congress, ask for 500 billion, maybe even one trillion of those US dollars, and save them from going broke like Wall Street was back in 2008. The oil industry at least does something useful like produce oil, an important natural resource if there ever was one. I dunno, but me thinks oil is more important and better than all that money, but that’s just my opinion. Oil should have remained at 100 dollars per barrel and Congress needed to pass a law requiring it to be at 100. Period. The 100 Dollar Per Barrel Mandate Law, and passed with unanimous votes from both the House and the Senate.
The US gov owes the oil industry at least one trillion US dollars. That’s final.
Anyway, when you have to drill for oil, Uncle Sam can lend a helping hand. Might cost an arm and a leg, however, every endeavor requires some sacrifice.
What’s another trillion in debt? If Wall Street can do it, so can oil.
True Ronald W, the government might put money toward supporting the oil industry or it might just take over the bankrupting ones and form a new agency. But of course this is just feeding a dying industry, one that will only continue for a decade with lots of input before it falls off like going over a cliff.
Or that trillion dollars could be invested into PV solar farms to produce 90 trillion kwh over the next 70 years. At .3 kwh per mile that is 300 trillion miles using EV cars (that will get more efficient with time so it will be further). So a one trillion dollar investment would provide 100 years of current car travel distance in the US.
If the trillion dollars was offered as a 50% subsidy, there would be twice as much power generation as I calculated above.
Considering we spend about 400 billion dollars a year on average for gasoline alone, that is less than three years cost to achieve over 70 years of transportation energy.
The catch being that oil as a major transport fuel will not last anywhere near 70 years. The sun is a much more stable source of energy.
So what is holding us back from the buying the biggest bargain in history?
Two important factors that significantly impacted the oil market on the supply side over the past 5 years are:
1) The rise of the US LTO production and
2) Unplanned crude oil production outages
The shale boom resulted in the increase in US total oil C+C production from 5 mb/d in 2008 to 9.6 mb/d in April 2015. In the chart below this factor is shown as incremental supply compared with the average 2008 levels (rising from 0.5 mb/d in early 2011 to 4.6 mb/d in April 2015)
Global supply disruptions, which normally did not exceed 0.5 mb/d, amounted to 2 mb/d since the Arab Spring in early 2011 and to 3 mb/d in 2013, when renewed decline in Libyan supplies combined with the effect of sanctions against Iran.
In 2011, the amount of production outages exceeded incremental supply from the US, which resulted in Brent price rising above $100. But by the end of 2012 the sharp increase in LTO production largely offset the effect of supply disruptions. For more than a year these two factors were increasing in tandem, which resulted in relative price stability. Finally, in early 2014 incremental US supply exceeded production outages, which led to a gradually rising overproduction in the global oil market and eventually – to a sharp drop in oil prices.
In other words, if not for supply outages, the shale boom would cause a sharp drop in oil prices much earlier than the second part of 2014. And if not for the shale boom, oil prices would skyrocket much higher than $100 causing a very deep global economic crisis.
The chart below (based on the EIA statistics) illustrates how all this worked:
Estimated Unplanned Crude Oil Production Outages vs. Incremental U.S. C+C supply (million bbls/day)
Thanks for sharing your superb insights Alex.
I think that the unplanned outages are probably a recurring factor. When you look at the size of global oil production, and all the possible things that can go wrong in those places, the only realistic expectation is that all the time some things somewhere will go wrong. Just the size may vary, but I would be surprised if the size of unplanned outages goes down. The world is remarkebly stable the last few years in my opinion. That could be a trend. But the increase in potential damage that a few lunatics can cause frightens me, as there are obviously still many of those people.
Enno,
thanks for keeping us informed about changes in shale well productivity and sharing you thoughts on many other issues. What you and Rune Likvern are doing is very important for understanding the dynamics of the LTO industry.
Enno,
I also think that the unplanned outages have become a recurring factor. And that’s because some parts of the world are actually remarkebly UNstable the last few years.
Hi AlexS,
Very nice analysis. Thanks.