The OPEC charts below were created with data from the OPEC Monthly Oil Market Report. The PDF File can be downloaded from here: OPEC MOMR All OPEC data is through April 2018 and is in thousand barrels per day.
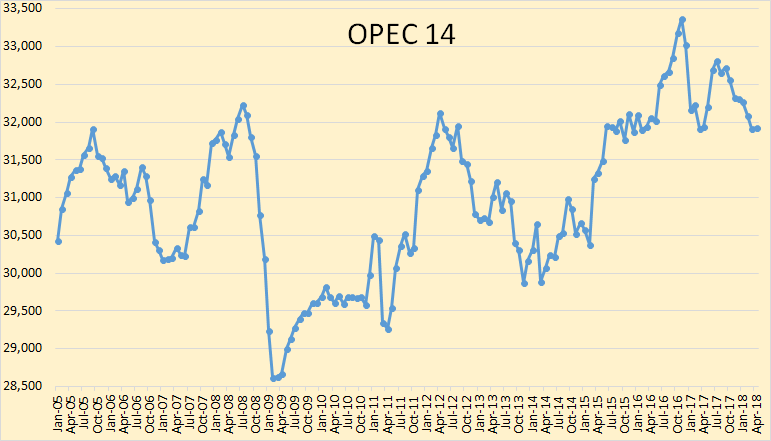
There was little change in OPEC production in April.
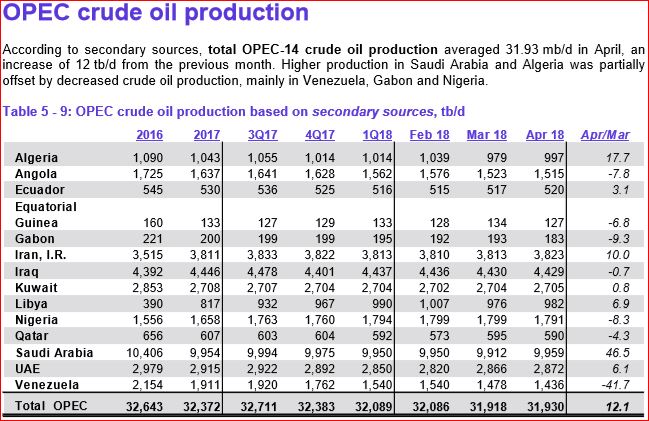
OPEC production was up 12,000 barrels per day in April but that was after February production had been revised down by 74,000 bpd and March production revised down by 39,000 bpd.
I am going to forgo commenting on each country unless there is something dramatic happening.
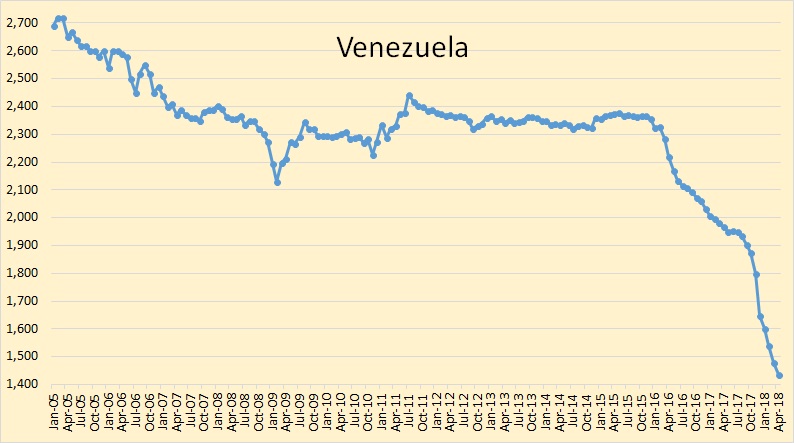
The collapse continues in Venezuela. Since September 2017, the decline has averaged 63,000 barrels per day per month. The two years prior to that date the decline had averaged less than 20,000 barrels per day per month.
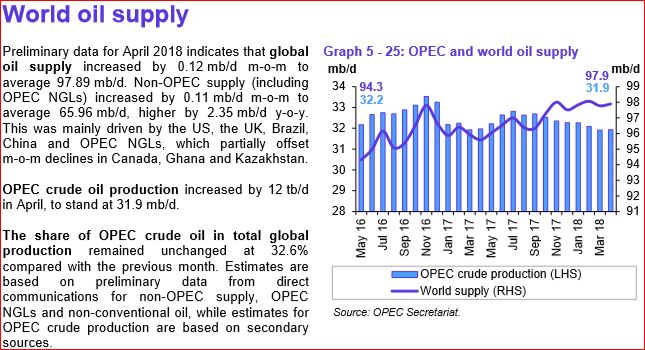
OPEC has total liquids at 97,890,000 barrels per day. The EIA has C+C, for the last six months that they have data, about 16,500,000 barrels per day below that figure. I wonder how accurate that figure is for total NGLs?
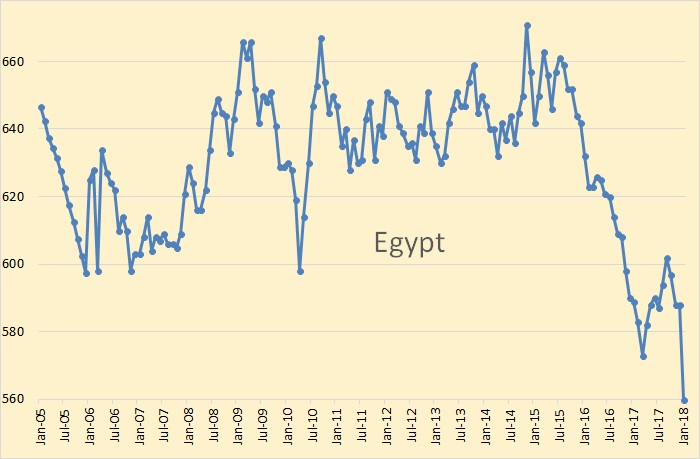
Egypt is not an OPEC member. This data is from the EIA and is through January 2018.
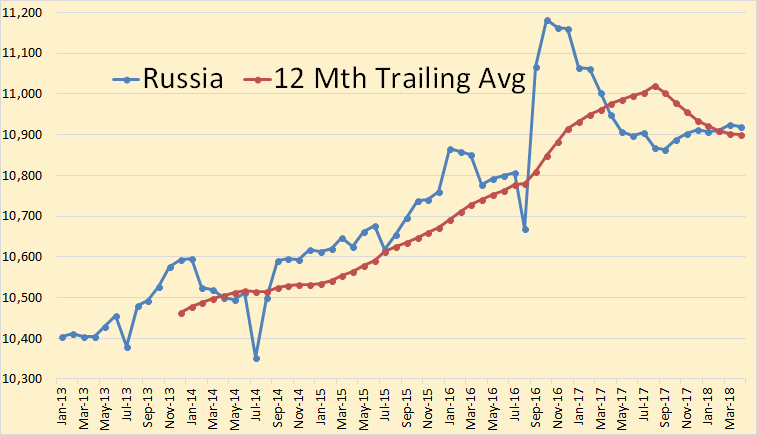
The data here is from the Russian Minister of Energy and is through April 2018. It is crude+condensate. Production in April was almost flat, down 5,000 bpd. Data from the Russian Minister of Energy averages about 400,000 barrels per day above what the EIA reports for Russia.
All the following data is from the EIA and is through January 2018.
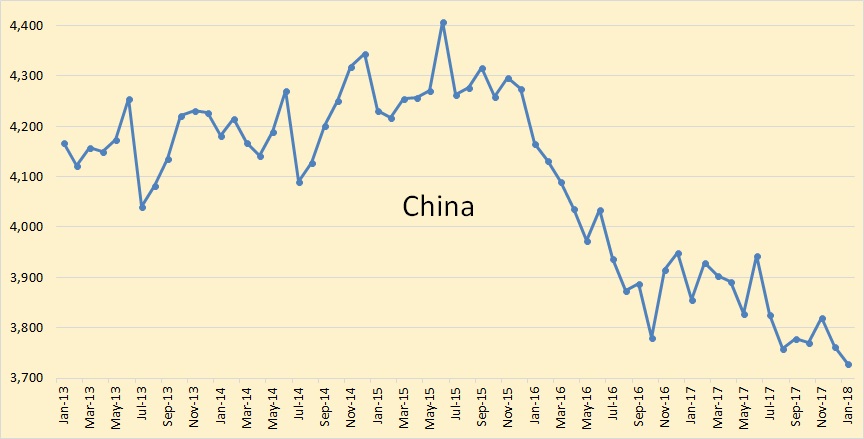
There is no doubt that China has peaked. It is also consuming a lot more oil. So as production goes down imports will go up a lot faster.
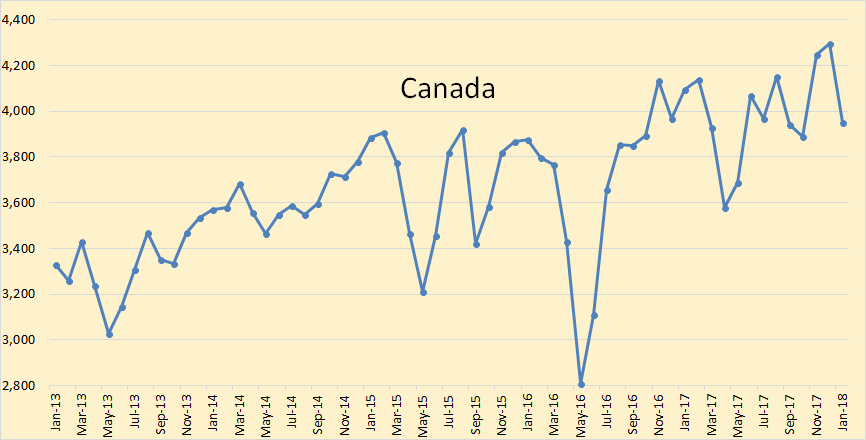
The EIA says Canadian C+C production was down 348,000 bpd in January.
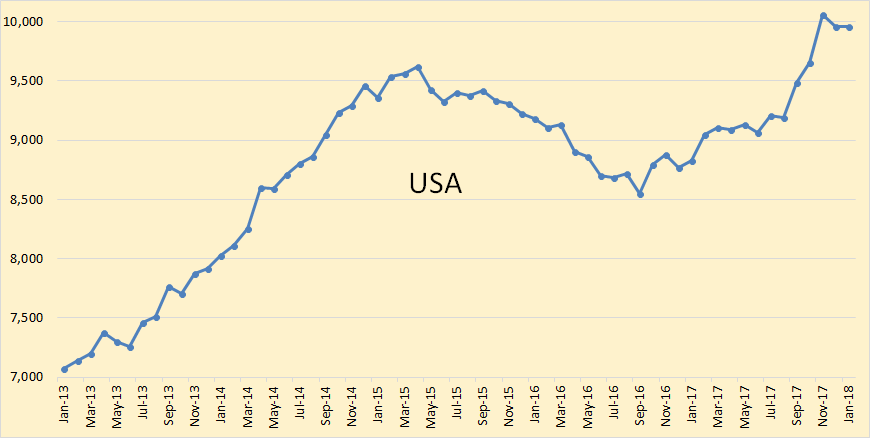
US C+C production was up only slightly in January, 6,000 bpd, but still down 102,000 bpd from an all-time high of 10,066,000 barrels per day in November 2017.
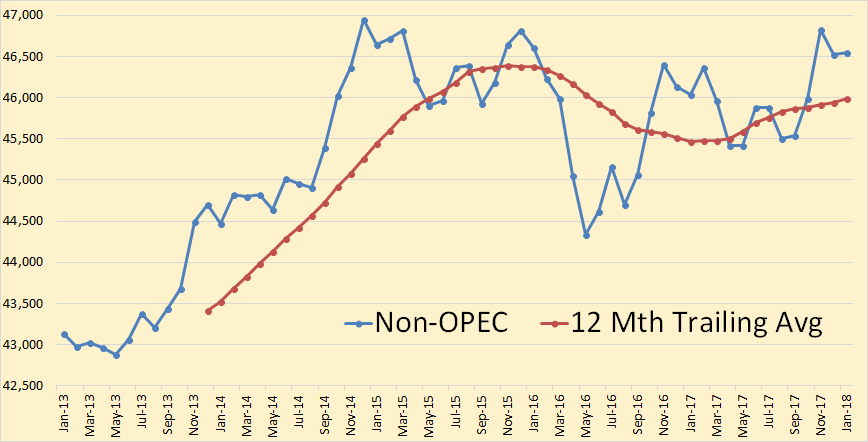
Non-OPEC C+C production was up 20,000 bpd in January but down 275,000 barrels per day from November.
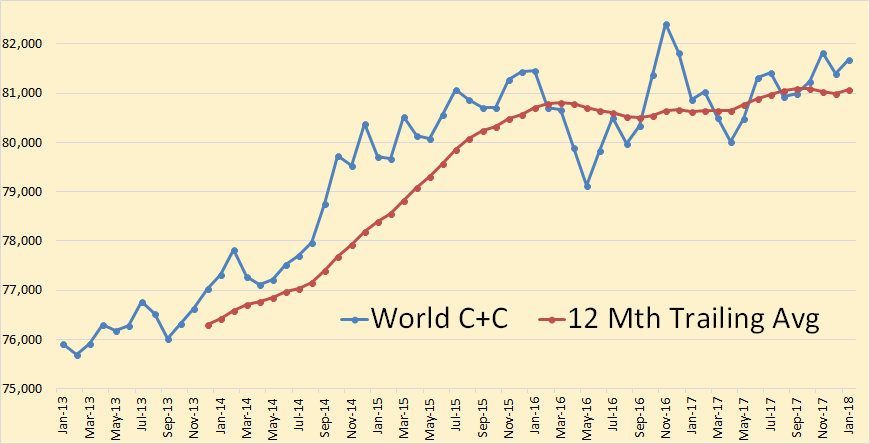
World C+C production was up 136,000 bpd in January but still down 730,000 barrels per day from the latest all-time high of 82,411,000 barrels per day in November of 2016.
I have an updated graph also showing Saudi crude exports, using JODI data:
http://crudeoilpeak.info/saudi-arabia-export-peak
Excellent data/graphs. It looks like Saudi exports have been roughly flat for the past 15 yrs.
Any one have good info that focuses solely on the exports (and imports) of crude by country, rather than production and consumption?
World supply just keeps going up. I am a long time lurker on this blog and can’t believe how Saudi Arabia just keeps pumping at these levels. I read Matthew Simmon’s “Twilight in the Desert” 10 years ago and it seemed like those high and increasing water cuts would make their peak have happened by now. When will declines ultimately overwhelm increases from other fields in Saudi Arabia and the world? And are we just making a world of hurt for ourselves because we are doing so many extraordinary measures to keep up this rate that fields will just crash and we will have a Seneca Cliff as Ugo Bardi says?
Thanks!
Karen
If indeed it’s a Ponzi scheme then the unraveling moment will be very dramatic
They are continually adding new wells and offshore are replacing all wellheads with artificial lift. Khurais expansion was due about now but I haven’t seen anything in the news. They aren’t adding new water injection or handling capacity which is likely the limit overall, and in terms of production capacity their reserves are irrelevant without new facilities to overcome those limits. Like you I’ve been expecting some sort of decline but they seem to be hanging on. There have been a couple of periods in the recent past where they looked like they’ve been hitting a decline curve before new surface facilities have been brought on. Their active drilling rigs have been steadily falling over the past year or so and so have their stocks. If most of their wells are now horizontal then when decline starts it will go really quickly.
They are continually adding new wells and offshore are replacing all wellheads with artificial lift.
I worked in Saudi Arabia from 1980 to 1985. All the time I was there I never saw an artificial lift well. Well, at least I saw no nodding donkeys. There may have been downhole electric pumps, I have no idea, but I never heard of them when I was there. But back then everything was pressure driven. Water injection kept the pressure up and they just opened the taps and the oil just came out. No need for artificial lift.
Ron, beam pumps are less competitive at rates above say 1000 barrels of fluid per day (depends on well depth, gas ratio, etc). I would expect the Saudis to use electric submersible pumps…but they would have to make sure the injection rate keeps the reservoir slightly above bubble point pressure.
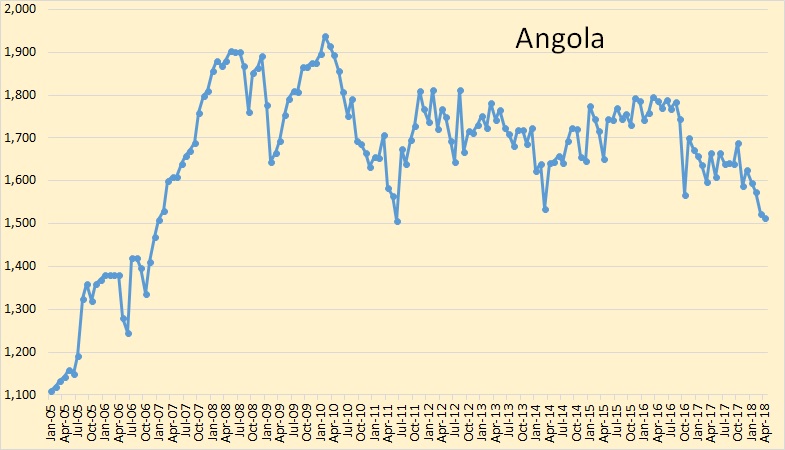
Has Angola left it’s plateau?
2 low production numbers now, let’s see if they bounce back like the 3 times before when they got low value.
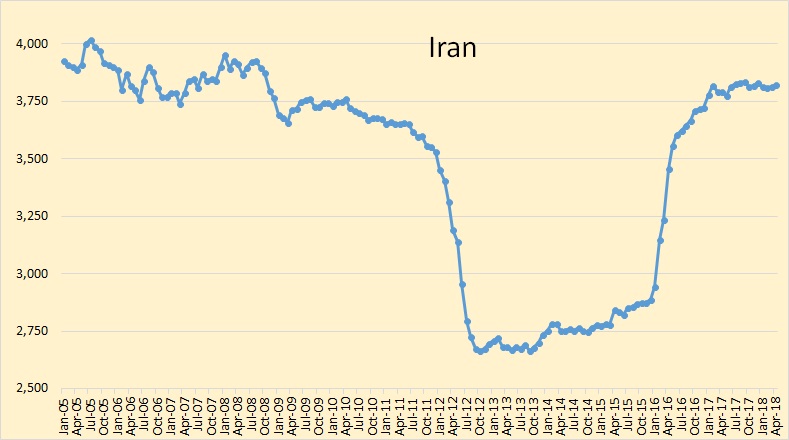
For Iran:
Is the expected production reducement only to the boycott of buying oil of Iran (can be replaced easy by China buying) or is it due to not delivering technology / billions of $ credits for developing new fields / production enhancement?
Later will cause a slow decline, perhaps setting in only after a year.
They have Kaomba Norte this year and Sul next – each at 115 kbpd nameplate so maybe 90 to 100 average in the first year. But they’ve also had some Chevron fields starting up and they’ve still been declining so some of their large, mature FPSOs must be dropping fast (they are due). I think after 2019 they are going to drop like a stone, maybe earlier.
Art’s Graphic of the Week from Tom Whipple’s PO Review email. Anyone care to estimate Diesel consumed to support such Permian production level?
Ron’s layout update.
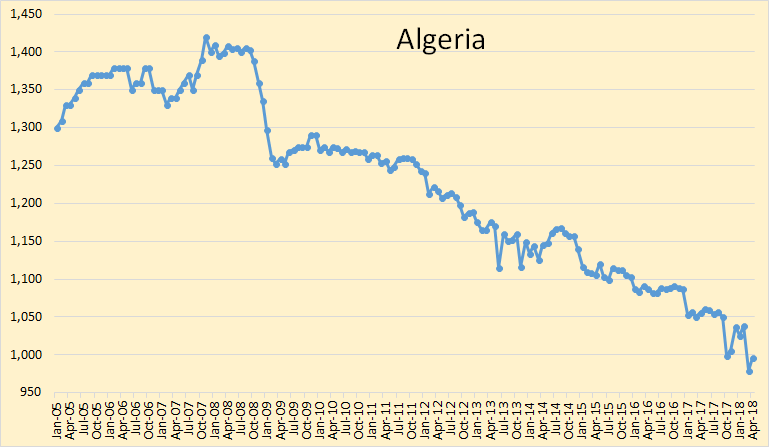
Algeria . . . there’s just no way to avoid noticing they are headed down with no respite.
Egypt . . . not an OPEC member (I wonder how that evolved originally). Their production is falling, and consumption is rising.
Egypt, and it has only gotten worse:
Population 1960: 27.8 million
Population 2008: 81.7 million
Current population growth rate: 2% per annum (a 35-year doubling rate)
Population in 2046 after another doubling: 164 million
Rainfall average over whole country: ~ 2 inches per year
Highest rainfall region: Alexandria, 7.9 inches per year
Arable land (almost entirely in the Nile Valley): 3%
Arable land per capita: 0.04 Ha (400 m2)
Arable land per capita in 2043: 0.02 Ha
Food imports: 40% of requirements
Grain imports: 60% of requirements
Net oil exports: Began falling in 1997, went negative in 2007
Oil production peaked in 1996
Cost of oil rising steeply
Cost of oil and food tightly linked
They’ve got a lot of recent gas though, but also the Aswan Dam is silting up and a relative small sea level rise will take out a large proportion of their food growing capacity in the Nile Delta. They are also still reliant on grants from Saudi and UAE, which I guess are a bit more assured now with higher oil price, but any major upset in either of those countries could cascade quickly to Egypt. They also have a huge proportion of unemployed but well educated young men – always a dangerous situation.
I have just now added Egypt to the main body of the post, just below “World Oil Production”. I thought some of you might find it interesting.
The data is from the EIA and is through January 2018.
I have also added China with data from the EIA.
https://oilprice.com/Energy/Energy-General/The-Most-Underappreciated-Story-In-The-Oil-Market.html
China is heating up.
Would need updating:
23/12/2015
Egypt budget and current account deficits – Can Saudi Arabia bail out Cairo?
http://crudeoilpeak.info/egypt-budget-and-current-account-deficit-can-saudi-arabia-bail-out-cairo
Algeria decline is accelerating and with nothing significant new for oil developments in the offing. Could easily go the way of Syria or Venezuela given the right circumstances.
“The reasons that the USA scuppered the Iran nuclear deal were actually 5-fold. First, a prime aim is to reimpose sanctions on Iran, in order to reduce its oil output, which will help to jack up the price which Saudi and US can then benefit from, with Russia also being cut out by sanctions. Second, its reduced exports will result in the country being weakened, making it easier to instigate a pro-Western Coup there. Third, weakening the arch-enemy of client state Saudi is a way of rewarding it for its fealty to the Empire and more especially the dollar. Fourth, it paves the way for a military assault on Iran by the US, on Israel’s behalf, which brings us to the 5th reason.”
“The 5th reason is this: in order to justify its inflated budget, the Military – Industrial complex in the US has to spirit enemies into existence out of nowhere, hence “The War on Terror” etc. David Stockman in his incisive piece Forget “America”, “It’s Deep State First” estimates that the US Military budget is about US$550 billion in excess of what is required to fulfill its stated purpose, which is to defend the country – that is US$550 billion that they are literally robbing from US taxpayers to line their pockets. But don’t expect the man in the street, the “Goy Cattle” to complain or try to do anything about it – the Zionists are in this respect correct – they are simply too ignorant, insouciant and stupid to do so. They have been taught by Hollywood, which has a mutually beneficial cozy relationship with the Military, to worship the Military, and so in a way they deserve to be fleeced.”
http://www.321energy.com/editorials/maund/maund051418.html
I do agree that the MIC is a major issue–it is one defining element of these modern times.
That said, the single biggest predictor of social unrest is food insecurity (see “The Food Crisis and Political Instability in North Africa and the Middle East” by Lagi, M., Bertrand, K. Z. and T. Bar-Yam, 2011). While not every instance of rioting and revolution in history is linked to food insecurity, the majority of such events are. I do not look at the general population as cattle or sheep, but rather as wolves in sheep’s clothing. The majority will largely keep quiet–e.g. endure any number of indignities such as the steadily increasing suppression of freedoms being shoved down our throats–as long as those three squares keep coming. It is a matter of survival–albeit seeped in short-term thinking. In any event, the moment food becomes a big question mark for many, all hell will likely break loose.
-best
I think trying to find a logic trail in Trump’s presidency is a fool’s errand. If anything you should first look how his ego, his bank account or his family members benefit directly from anything he does, second whether it is to undo anything done by Obama (and I think that has strong racist overtones), and third who was the last person he spoke to or TV program he watched or twitter feed he read before making a decision. He is basically a money grubbing, dumbass, narcissistic piece of shit.
And that makes him different from other politicians in what aspect?
Guym,
So you see little difference between Trump and previous presidents?
Politicians are far from perfect, Trump seems like the least qualified president in my lifetime by a large measure, (a factor of 2 to 3 at minimum).
No, I don’t. Nor, do I see much difference in the parties. Republican Party is far from cohesive ideals, and many of which I don’t agree with. Democrats, how can I phrase this, other than it is the same party that fought for slavery, gave us the Bay of Pigs, and an escalation in Vietnam which pretty much ruined my early life. I vote for the individual, probably just as stupid. I did not vote last time, as I could not determine which one was worse. The last two times I voted was for Obama the first time, and against him the second time. I don’t believe any of them.
Interesting.
You see little difference between Trump and previous presidents.
Strange that.
Of course he is different. Just about the same as some of the other bad ones. In the refined area, he fits in like Andrew Jackson. The one that made me the most comfortable was Reagan. I kept looking over his shoulder for Bonzo. Geese, man, they are all narcissists, or they wouldn’t be in that game. What I find most disgusting in politics nowadays is the extreme polarization. Which is continuing to get worse. Being liberal does not make a person bad, and all Republicans do not dress up in sheets and burn crosses (that was SOME of the old Democrats). There used to be some obvious common ground between conservatives and liberals. Now, it’s only I’m right and your wrong, which is so wrong.
Guym,
I agree with most of what you say. I am not a historian so I don’t know much about Jackson, I am mostly comparing Trump to Nixon through Obama.
He sure seems very different to me than the other presidents elected since 1968.
I don’t need to be much of an historian, because I remember Johnson. By far the worst. To promote himself, he sent 58k young US people to death in a useless endeavor, leaving twice a many permanently disabled, and killing off over one million total people. He was the absolute worst president we have ever had. Trump, so far, pales in comparison.
Much worse – he is in a league with some of the great scumbags of history.
And that makes him different from other politicians in what aspect?
If you think Trump is remotely like any past president then you are a….
No, I am not going to say it. I must stop responding to people who haven’t a fucking clue as to what is going on with this idiot president we elected. Venezuela’s Maduro looks like a saint compared to Trump.
If the democrats under Obama and in cahoots with Hillary, hadn’t thrown Bernie under the bus we could be enjoying a Socialist President at this very moment. The deplorables smelled the poison and came out of the woodwork in defiance. Not that it has helped their cause but at least they didn’t take it sitting down.
Hillary and Trump have much more in common than Bernie, who was a true threat to wealth and class privilege.
Bu this is a hydrocarbon blog– no need to go there.
As far as I know Trump doesn’t commit genocide like Maduro. Trump is simply acting the role of his life, throws in some parody and behaves erratically because he thinks that keeps others on their back foot.
I do like the Wall and the way he focuses in his rather clunky way on reducing unemployment. Getting out of the Paris agreement was useful, and rolling back Obama’s gifts to the Castro dictatorship was nice. His Middle East moves are really bad…but all USA presidents have to be very careful not to upset the Israel Lobby, which happens to be functioning as the political enforcer of the Israeli Alt Right in the USA.
Ron, I have repeatedly said that he is acting like an idiot. He is not my choice, never was. I didn’t vote for him. Now, if I don’t state he is worse than Maduro, I’m a fxxxing idiot. You don’t leave much for rational discussion, do you? He hasn’t led 58k young people to their death yet, with twice that many maimed for life over a political, useless war. Yet. That decision was made by Johnson, who I put as the worst all time President.
Hey, I am pissed off at Trump, not you. No, you are not an idiot and I, as best as I can remember, never called you one. But if I did I apologize.
Johnson did get us into the Vietnam war. He listened to his cabinet and other advisors. They were supposed to be the best and the brightest. Obviously, they had a blind spot somewhere. But Johnson did more for civil rights than any other president.
Every respect. Most politicians do have plans and are capable of thinking at least a few months ahead. TRump cannot.
He is basically a money grubbing, dumbass, narcissistic piece of shit.
Is it the four bankruptcies, or the game show host that defines him?
That article is rubbish HB. How the USA, a net oil importer, would benefit from higher prices more than Russia, which exports 5 million barrels a day, defies rationality. But nothing like a good CT.
The article is about 90% correct. Higher prices help Texas, Oklahoma, and North Dakota developers. This creates a jobs boom, most of the jobs pay very well, and well paid Americans would tend to be happy with Trump. The democrats won’t be able to complain about higher gasoline prices, because that’s what they supposed to want to get the Battery cars sold.
The USA has always had a dumb foreign policy, and trump is just being stupid and pleasing the Israelis as all USA politicians do. It’s simply a survival issue, standing up to the Israel lobby is impossible, and there’s nothing to stop them from using USA troops as proxies to fight whatever wars Netanyahu thinks USA troops need to fight (you won’t see any Israelis fighting alongside Americans, they are busy shooting unarmed Palestinians in Gaza). So this isn’t just about the military industrial complex, it’s a combination of the MIC AND the Israel lobby.
I shall now wait for the stones I know will be flying my way.
Don’t worry about the stones Fernando. People have learned not to take your world seriously. [damaged goods]
Fernando, the author didn’t say anything about helping exploration in Oklahoma, but I’m sure he thanks you for trying to make his thoughts cohesive. He makes a generic statement that higher oil prices help the US, while they hurt Russia, which is nonsensical. He then spends a lot of space talking about head and shoulders patterns, which is more nonsense.
I suspect you agree more with his politics than his economics. And in this we agree: pulling out of the Iran deal is the action of a half-wit.
I didn’t discuss exploration in Oklahoma. I explained that higher oil prices will drive development activity in the oil patch. This leads to lower unemployment…and wages are very good. Higher prices aren’t a big deal to the public at large if the USA is producing 10 mmbopd and importing 5 mmbopd.
I believe we are all in agreement the industry does have many viable investments when prices are above say $70 per barrel. I know the way large companies think, they see Iran dropping between 0.5 and 1 mmbopd, and the low spare capacity, so they’ll start chomping acreage and investing big time because it sure looks like the market is above the hurdle price. So this won’t be just a few mid size companies stumbling along (what I see them do is fairly amateur), it’s probably going to be companies with muscle drilling thousands of wells from neatly laid out multiwell pads, quality gathering systems, central plants, and all sorts of power and treating/compressor stations.
I did explain the article was 90% right. If you wish I can drop the grade to 85. As for the comment about my (damaged goods), that’s the result of the intensive brainwashing Americans undergo since they are around three years old. The latest I hear is that both Mossad and Shinbet are incredibly upset at Netanyahu for his stupid moves. Senior Israeli military are upset at both Netanyahu (they think he’s a coward) and Lieberman (they call him “the Moldavian” and ridicule his lack of military experience).
But in the USA you of course have to goose step in squadrons as you are told what you are supposed to think about Israel. So those two nuts are going to push the USA into a major war, and you all will do lemming duty and dive over the cliff.
Hmm Fenando, if not so much about Venezuela and Cuba, here I find some points I can agree with you.
Must be because you are Alt Left. Reds like to cover for their human rights abuses and stupid moves, and will probably die worshipping Chavez and Castro. This is what makes them the greatest menace to mankind in the 21st century.
I’m really annoyed when I see that my points about USA foreign policy in the Middle East are only popular with leftists.
“I’m really annoyed when I see that my points about USA foreign policy in the Middle East are only popular with leftists.”
Or in reality, popular with no one.
I’m not a leftist Fernando and you are spot on with me and your viewpoints on Israel and US politicians.
I have Fernando on ignore since he is a climate denier and a genocide denying fascist. I recommend that everyone ignore him.
Nathanael, You appear to be a hired poster from somewhere? You comment in waves, they are always very biased, and are normally in regard to electric vehicles. In my opinion it is the height of hypocrisy that you would recommend to everyone that someone else be placed on ignore.
Fernando obviously has a different background than most posters on this blog and different political leanings, but he adds a lot of real knowledge to the discussion about actual oil production. Not just the pixie dust and fairy tale shit that you bring. If anyone needs the ignore feature it would seem to be you.
I’ve always pictured it as a situation like getting access to mommy’s computer for an afternoon/evening/whatever and going wild on the comment threads here.
Otherwise, I agree completely with your comment.
I have been living in the Vancouver Metro (BC) area for the past decade. Yesterday, I filled up the car and paid CAD $1.619/litre for 87 octane (approximately USD $4.75/gal), resulting in a total fill-up cost of CAD $97. This is a new record high fill-up, and per-litre gas price in my records. During the 2007-08 oil shock, I paid around CAD $1.504/litre at maximum on 31 August 2008, and this was for 92 octane–87 octane went for $1.384/litre that day. Before the current gas price spike, my most expensive single fill-up cost happened on 21 August 2008 with a value of CAD $73.90. Nearly a decade ago.
The high gasoline prices today are due in part to the lower value of the CAD relative to the USD. For example, if the above numbers are all converted to USD based on the foreign exchange rates of the time period, then I am paying almost exactly the same price as in 2008–still high. Another piece is additional taxes to support things that mass transit expansion (I support this, BTW). And, of course, oil prices have been edging up–for example WTI and Brent.
What is particularly interesting is that gas prices are already well above the 2007-08 oil shock values and this without the extremely high oil prices of yesteryear. It makes me wonder where gas prices in Vancouver will be if oil prices return to $150/bbl, as I expect they will at some point? This example also goes to show that refined-fuel price increases can be decoupled from oil price to some extent.
Of course, what matters here is how many loonies are being devoured by my vehicle, not USD, and it has become noticeable. There is a significant uptick in average monthly cost of gasoline. In my estimation, the high gasoline prices in the Vancouver Metro area must be having a dragging effect on the local economy–or soon will if these prices sustain through the summer.
Obliquely related is that Vancouver area residents are becoming quite electric car happy. These days, they are a regular sight. Nissan Leafs, Teslas, BMW i3s and more have become almost commonplace. On a typical outing, I will see several being used as everyday vehicles. Charging stations have popped up everywhere, including at public parks. There is a healthy used electric vehicle market in operation. Without a doubt, our next car will be an electric.
-best
Doesn’t the CAD tend to get stronger if commodity prices, especially oil and gas, increase?
Brent at $78.35 and WTI above $71, so your $150 is getting closer.
Yes. But apparently for the CAD to really begin climbing toward parity with the USD (and possibly go higher), it requires significant investments in oil production, namely the “tar sands” operations. Thus, if oil prices rise high enough for renewed investment (and the current oil price increases are interesting), then we can look forward to a stronger loonie, like during much of the previous two oil shocks (2007-08, 2011). We shall see. This would cushion Canadians a little from the effects of rising oil prices.
-best
One doesn’t have to look to hard at the pajama party in Ottawa to figure out why the Canadian Dollar has been under-performing lately. At any rate, not sure why higher crude oil prices would impact the Canadian Dollar when Andrew Weaver says energy is only 2% of Canada’s GDP. lol
It looks like Vancouver has a history of higher gasoline prices
https://www.gasbuddy.com/CAN
Yes, in part due to the tax structure here, and as noted when compared to prices in the US, the value of the CAD is a real factor. What is interesting in the chart you posted is that gas prices in Canada are not at all-time highs, but in Vancouver they are. As I noted, new taxes are a contributing factor.
-best,
“A standing military force, with an overgrown Executive will not long be safe companions to liberty. The means of defense against foreign danger, have been always the instruments of tyranny at home. Among the Romans it was a standing maxim to excite a war, whenever a revolt was apprehended. Throughout all Europe, the armies kept up under the pretext of defending, have enslaved the people.”
James Madison addressing the Constitutional Convention in 1787.
I don’t know about all the deep state stuff, and with no disrespect to anyone who has served, but the military is, at best, a colossal waste of humanity’s and earth’s scarce resources. At worst, it the primary force keeping Americans from being free.
Bingo!
We have a winner
It sounds like a good scenario. Just be sure you shut it down in all countries.
And in the interests of safety, shut it down in others first.
Im sure the French thought the same thing 5 minutes before Hitler took Paris.
Not at all. If I recall correctly, the French invested heavily in obsolete hardware (e.g., the Maginot line). They were fighting the last war, while the Germans were fighting the next.
Exactly what the Americans are doing now…
The maginot line could even have worked – it was the tactical doctrine that killed them. Sitting in a fortress was never enough to win a war – even not against medival knights.
No mobile gap filler reserve armies that reinforce where the enemy attacks in full strength, no combined tank groups – the old tactics instead of the new ones. A fortification system as a backbone of defence would have worked out in this time still.
Against a Blitzkrieg, the precursor of the modern combined arms assault you can only defend with a similar tactic. Fortifications to create artificial botllenecks where no naturally exist (mountain passes that make an attacker vulnerable by condensing the forces) can help when used properly.
They could have used a few guys who knew how to make radio activated IED using a 155 mm canon shell, a small battery and a radio inside a wooden box.
The US military is a paper tiger. Loses every war it gets into.
It is flat-out worthless. We could defend the US better without the current WWII-structure military.
The idea that we are the French and someone else is Germany, and not the reverse, is quite laughable:
Troops deployed in over 150 countries at present:
https://en.wikipedia.org/wiki/United_States_military_deployments
US military consumes as much energy as Nigeria, pop. 140M:
https://oilprice.com/Energy/Energy-General/A-Look-At-US-Military-Energy-Consumption.html
Brent – WTI spread closed over $7 today (78.23 – 70.96 = 7.27)
Bloomberg chart from before the close https://pbs.twimg.com/media/DdLPTaRWsAA9whK.jpg
Ron,
Can I make a suggestion?
The 12 month rolling average would be more useful, and more intuitive, if you used a centered average rather than trailing average. I think if you try doing it both ways you’ll see the difference.
I agree. However, there are problems both ways. 12 months cannot be centered. Also, the average at the end of December is also the average for the entire year. Also, the peak for the 12-month trailing average is the peak for that 12 months, not six months earlier. So there are problems both ways.
12 months cannot be centered.
Well, I fix that problem by using the next month after the middle, in this case the 7th month. It works well.
Also, the average at the end of December is also the average for the entire year.
That’s convenient, but it doesn’t matter to your audience here, which is only viewing the charts and getting a qualitative sense of things.
Also, the peak for the 12-month trailing average is the peak for that 12 months, not six months earlier.
I’m not quite sure what you mean. I think you’re addressing the fact that it can feel a little odd to have the rolling average extend into the future. It means that the rolling average line starts 7 months after the first month in the chart, and ends 5 months before the last. But, it’s still really more meaningful that way.
Think of it this way: the rolling average is smoothing out the data to eliminate the effect of random noise, and the effect of seasonal variation. Such a smoothing curve is most effective if it matches up nicely with the data, as a centered curve would.
Another suggestion for your excellent – and regular -OPEC graphs (a lot of work!): could you include the OPEC production quotas? This could show us which OPEC countries are using the quotas to hide natural declines occurring anyway.
Okay, but I have no idea what the quota is for each country. If you know or have a link, post it.
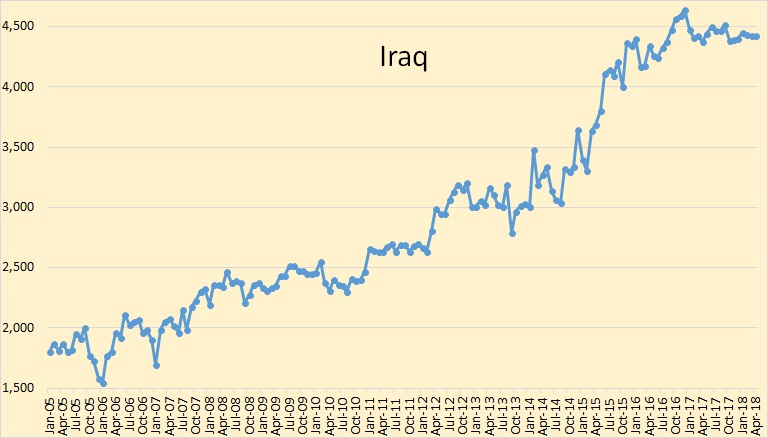
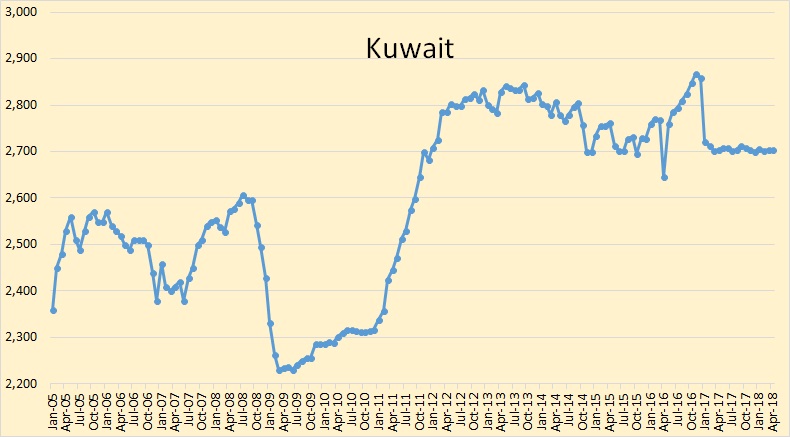
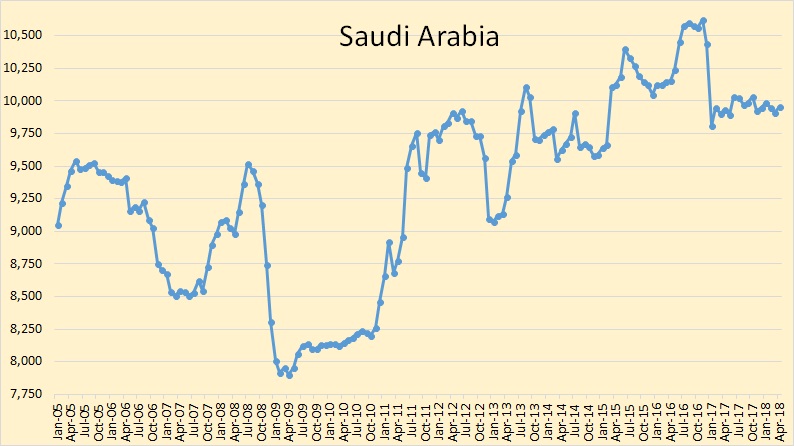
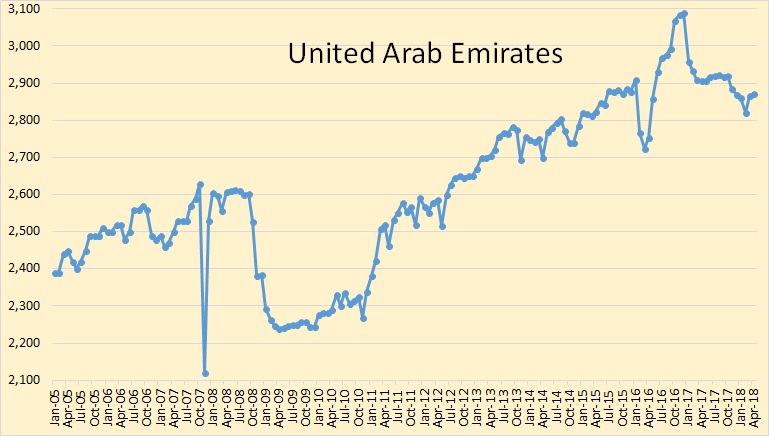
However only Saudi Arabia, Kuwait and the UAE did any cutting. All others are either producing flat out or are in decline. Even Iraq is producing flat out, and I believe the UAE may be also.
Should be some relevant numbers here:
https://uk.reuters.com/article/oil-opec-survey/table-opec-oil-output-falls-by-70000-bpd-in-april-reuters-survey-idUKL8N1S73BI
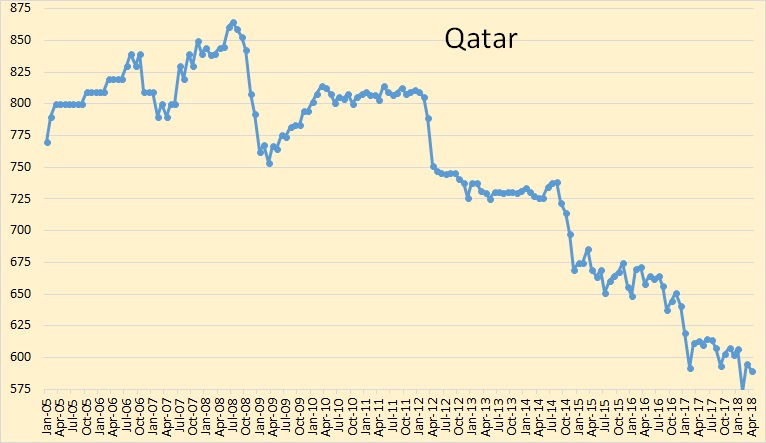
Ok, Angola, Algeria and Qatar are in decline, then. Besides Venezuela which is only in decline because of politics, not dwindling reserves.
There is no reason for them to cut more than the quota – SA is the swing operator who cuts more than promised. They could produce more.
Iraq is producing flat out – but they have perhaps cut back in agressive new developments increasing this number faster.
Iraq will have a new government led by Muqtada al Sadr. He is backed by communists and an Iran backed party. Sadr has his militia, the Mahdi Army, and is quite popular amongst poor Iraqis. I think it’s safe to assume he’s going to focus on identity politics, populist measures, social justice and the other topics of interest to the left. And he’s probably going to help Assad.
He’s certainly fortifying the shiite half moon. That’s probably another reason for Trumps aggressive politics against Iran.
For C&C I think Qatar is still growing.
Then how do you explain their chart? Their crude oil production is most clearly in decline. The decline rate is about 5% per year. You are saying that their condensate production is growing faster than that?
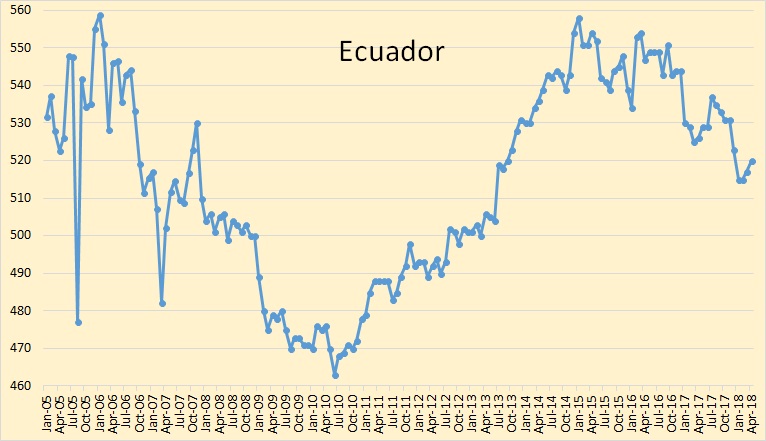
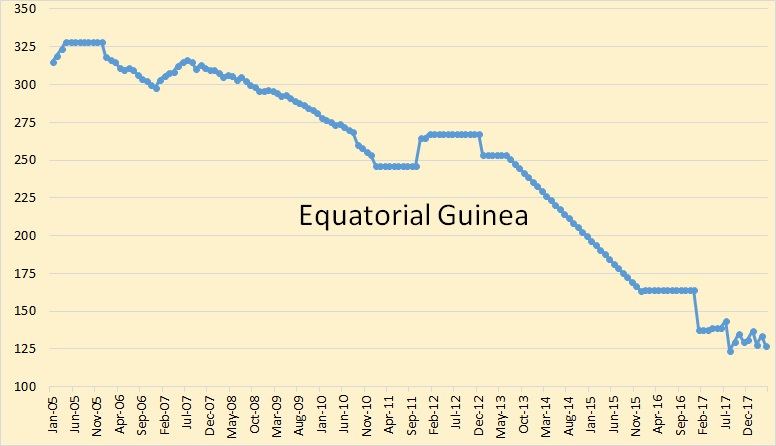
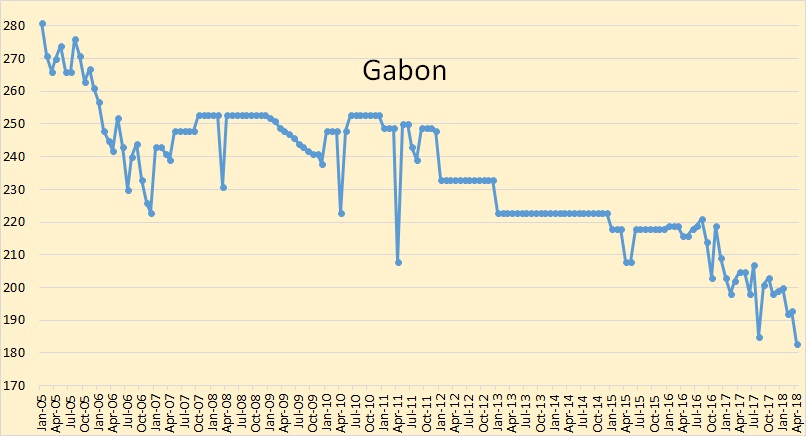
Thanks to Energy News for this data.
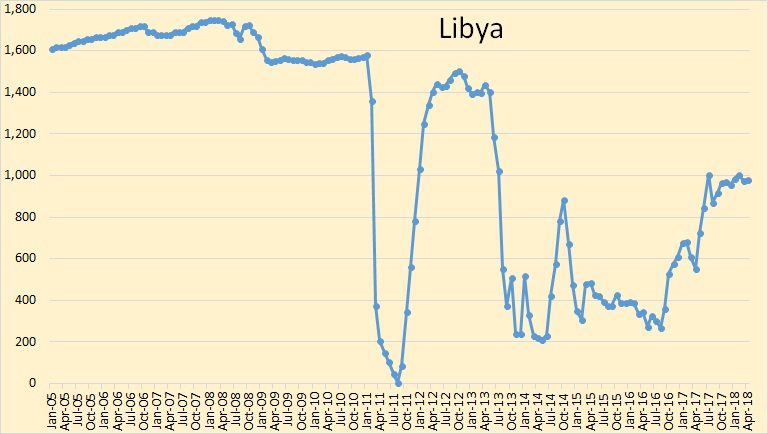
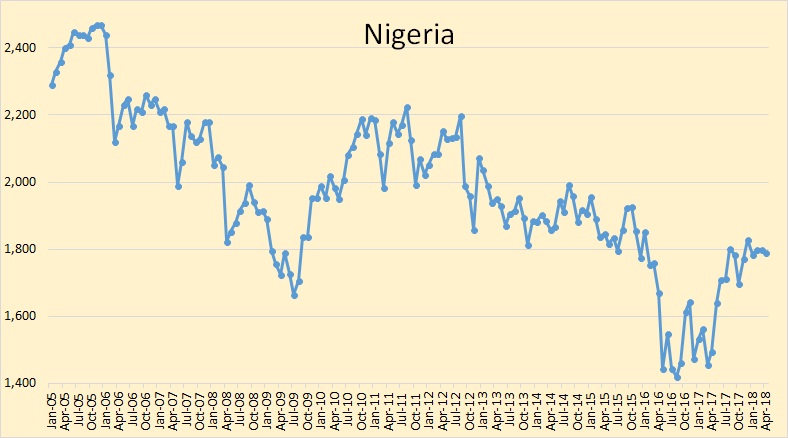
Here it is. Equatorial Guinea, Libya and Nigeria are not shown. Libya and Nigeria are not subject to quotas and Equatorial Guinea was not a member of OPEC at the time. The data is in thousand barrels per day.
Notice that only Iran and Iraq are producing above quotas. Everyone on this list is producing flat out with the possible exception of Saudi Arabia, Kuwait, and the UAE, and I am not so sure about the UAE.
I don’t think this has been posted before on POB. It’s a summary of 2017 exploration results (dry and successful). From ASPO France (in English): https://aspofrance.files.wordpress.com/2018/03/aspo-fc3a9vrier-2018-mbl-presentation.pdf
Westwood seems to have decided things improved – maybe they include the Alaska and Russia discoveries.
https://www.westwoodenergy.com/news/westwood-insight/westwood-insight-the-state-of-exploration-in-2018-a-renewed-optimism/
This year seems worse so far, there was the shale oil thing in Bahrain which may or may not have commercial oil, a couple in Norway and a bit of onshore gas, but what else? The hasn’t been much of a surge in offshore FIDs so far either, contrary to earlier predictions, and lease interest has been average at best.
George,
You keep better track of the global industry than I do. I wouldn’t bet the farm on Bahrain.
The Westwood figure is for “W40 companies”. I’m not sure which are not included. Their figure for “commercial resources discovered” is lower than Rystad’s estimate (I guess Rystad keeps track of more companies).
“The cost of exploring has fallen more than 50% since 2013/14 and there are fewer companies competing for acreage.” (from the Westwood link)
My feeling is that most of the offshore E&P cost reductions are short term cost deflation. Higher fleet utilization (combination of decommissioning rigs and using the ones that are stacked) will result in cost inflation, just as it always has.
I can barely keep track of my keys these days, let alone the oil industry. I know Westwood charges a lot of money, probably so does Rystad and, like all such companies, their employees’ future career prospects (and comfortable salaries) depend on the continued growth of the oil and gas industry, which almost certainly skews how they present things. It looks like a lot of the 2017 discoveries were in the Westwood companies’ pool, but they have different criteria and some might end up non-commercial; Rystad seems to be pretty rigorous.
I think 2013/2014 was an extreme bubble year so comparisons with, say, 2011 to 2014 might be more illustrative, and I’d guess that a lot of reduction last year was because so many companies gave up on expensive deep water frontier wild cats and switched to lower risk, but lower upside, near field prospects. That also explains the higher per well success rate. That behaviour is certainly related to the price but doesn’t have to be so exclusively: a long string of failed, expensive wildcats would probably induce the same thing, especially if the available prospects are getting into less attractive areas, as would improved technology that can better quantify the location and scale of a resource (both things also happening over the last few years).
Brent reached $79 briefly this morning. The Brent/WTI spread is close to $8. Curious to see how much exports will increase.
Looks like the traders are pretty twitchy, maybe the API US storage numbers?
I look for the spread (Brent/WTI) to increase. While, I don’t think the production increase in the US matches the wild assed projections of the EIA, it still is substantially more than last year. Yes, demand will increase for US consumption and for product exports. However, I don’t see the inventory drops in the US like last year. Brent will increase, but WTI not so much, until it is drawn down by exports. Permian discounts will continue to rise. Just think of the profit some enterprising traders could make if they got it from the Permian to the ship. In the meantime traders will still try to concentrate on API and EIA weeklies while the rest of the world circles the drain. What good would a huge US increase in production would be for world supply, if they can’t get it to, or out the front door??
The US will continue to import about the same amount, no matter what the increase in US production will be. Refineries need the lower API oil to function.
Is there a pipeline shortage from the WTI hub?
With a price like this buying cheap at WTI and shipping it to the spot market in Rotterdam (or elsewhere) would be a good deal with this big difference.
I assume you are referring to the Cushing storage area. I have no idea how much is actually WTI there. It’s a huge mixture. It’s a holding conduit for heavy oil from Canada going to the Coast. At its high point, when it was topping off storage, I read about half of the oil was from Canada. They mix oil there for refineries, and for shipment now, I assume. How much of that is at the 46 API coming out of the Permian is unknown to me, and probably to most. Storage there is leased by many companies and traders. Genscape can estimate barrels, but don’t report on type. It recently started dropping when they opened a pipeline to a Tennessee refinery to the tune of about 300k a day. Some of the most recent uptick in storage may come from the fact that Canadian pipelines have been restored some. Quien sabe?
Most of the new pipelines of 1.5 million scheduled after fall 2019 out of the Permian are going directly to the coast. From what I can guesstimate, not all of that is going to be able to get on a ship for a couple of years more. But, this story hasn’t been completed yet. Maybe, some can ride the rails to the Eastern or Western refineries.
North Dakota directors cut is out.
Oil Production
February 32,908,840 barrels = 1,175,316 barrels/day (final)
March 36,024,209 barrels = 1,162,071 barrels/day (preliminary)
(all-time high was Dec 2014 at 1,227,483 barrels/day)
1,106,836 barrels per day or 95% from Bakken and Three Forks
55,235 barrels per day or 5% from legacy conventional pools
Gas Production
February 58,971,398 MCF = 2,106,121 MCF/day
March 65,605,128 MCF = 2,116,294 MCF/day (NEW all-time high)
Even with slightly more rigs running, oil seems to be slowly declining. They do have a new high in gas production.
A bit bigger and earlier than expected, but there didn’t seem to be much in the way of unplanned outages that could give a short term dip. Maybe Freddy W’s and Enno’s charts will give more insight.
Here is the per well average oil production graph grouped by year. Number of new wells were 81 (shale plus conventional) in March compared to 69 in February. This month the initial production of the new wells were quite good but the decline from older wells were higher. Last month it was the opposite.
Production from last month wells recovered and produced better this month (479 bopd). It was quite bad last month if you remember. Now the 1 month after completion production is good compared to 2015 wells and earlier, but still not so good compared to 2016 and 2017 wells.
Average number of production days increased in general except for the 2016 wells for which it decreased by 3%.
Note that because wells produce on average only half of the month the first month, most of the production contribution will actually be the month after. So the quite good wells completed in March will probably cause total oil production to go up a bit in April. This also means that the bellow average wells from February contributed to the total production decline in March. This is an effect of the data being monthly.
So there is maybe a trend showing, with the newer wells appearing to be less productive, and with 2016/2017 wells the best (at least for initial production, ultimate recovery is still to be seen). Is that fair to say?
Because I don´t know which wells are Bakken wells until they are non-confidential, I just use all wells. In bellow graph you can see that it gives a very good approximation if you compare to the “Bakken wells” curve as most wells are Bakken wells anyway. The “Bakken wells” curve is not perfect either as it uses sales instead of production for confidential wells, but it should be ok.
In the graph you can see that there was a peak in 9/2017 and that it has gone down since then. But the curves goes up and down, so there is always a possibility that it goes up again. There could be many reasons for why it has declined, like more wells outside the sweet spots, as someone here mentioned smaller companies drilling more wells or higher wells density in sweet spots.
That’s an interesting chart, I’d be interested to see it updated each month if you have the time. Have you ever fitted a trailing average to try and smooth out some of the noise and/or looked at what the pattern looks like for, say, 13 and 25 months?
Yes I can probably do that. I used to share graphs with different months from first production. But not right now.
Here are 2 more graphs. First oil production, water to oil ratio, gas to oil ratio and middle Bakken share 12 months after first production.
The same graph 24 months after first production.
The GOR graph.
Thanks for the update Freddy W
A Bakken scenario, 33,000 completed wells (12,600 Bakken/TF wells completed in North Dakota through March 2018).
New well EUR starts to decrease in Jan 2019, EUR in Jan 2017 estimated at 370 kb, EUR assumed unchanged from Jan 2017 to Dec 2018. EUR decreases at a maximum annual rate of 12.6% per year in 2022, when the peak well completion rate is 2520 wells per year.
Peak output is 1654 kb/d in Dec 2021. No more wells are added after June 2032 and the EUR of the final wells added is only 129 kb. At the end of the peak completion rate in Dec 2022, EUR has decreased to 226 kb and by July 2024, EUR is half of the Dec 2018 level at 185 kb.
The rate of EUR decrease is proportional to the number of wells completed each month and thus varies with the completion rate.
Economically recoverable resources in this scenario are about 9.1 Gb. Oil prices rise linearly from $67/b in Jan 2018 (all oil prices in 2017$) to $150/b in Feb 2027, remain at $150/b until Jan 2030 and then decrease linearly to $120/b in July 2042.
Alternative scenario with lower oil prices (maximum $111/b in 2017$) high oil price reached in Jan 2023, prices flat thereafter. Fewer wells (22,000) and faster decrease in new well EUR (14% annual decrease in EUR at maximum completion rate of 140 wells per month vs 8.6% at 140 well/month in high scenario [ERR=9.1 Gb]).
Peak in 2021 at 1264 kb/d, ERR is 6.8 Gb which is about the same as proved reserves plus cumulative output at the end of 2016, this is the minimum ERR that I would expect.
Freddy, please; is this frightening GOR graph Bakken and Three Forks or just Bakken?
It´s both middle Bakken and Three Forks. The ratio has been about 60/40 MB/TF since 2013.
Thank you, sir !!
No problem :).
https://www.freightwaves.com/news/driver-issues/economics/truck-driver-shortages-expected-to-increase-oil-prices-and-constrain-supply
400 truckloads of sand required per well. Article stumbles in regard to economics. Lack of drivers is not a direct connection to higher oil prices. Lack of oil would be. Sand is a one time occurrence. Number of trips per day for oil hauling at 200 bbls a trip is not a one time occurrence.
2018-05-16 Inventory levels at the Fujairah fuel supply hub (Source: FedCom/S&P Global Platts)
There is a higher level of light distillates but lower middle & heavy than last year
https://pbs.twimg.com/media/DdTQskTW0AASV-6.jpg
Chart showing the total
https://pbs.twimg.com/media/DdTQEP3XcAIViP8.jpg
(I seem to remember that due to the dispute with Qatar they no longer refuel Qatar flagged ships)
IEA revises down oil demand growth to 1.4 million b/day from 1.5 million b/day, due to higher oil prices
OECD commercial stocks declined counter-seasonally by 26.8 million barrels in March to 2,819 mb, their lowest since March 2015
Global refining throughput is expected to hit a record 83 mb/d in July/August. IEA sees “modest” inventory draws in Q2 that will accelerate in Q3
IEA increases 2018 non-OPEC supply growth forecast to 1.87 mln bpd from 1.8 mln bpd previously
https://www.iea.org/oilmarketreport/omrpublic/
OPEC table https://pbs.twimg.com/media/DdTa3MpWsAAIZVb.jpg
This is the beginning. IEA underestimates the demand destruction IMO. Last time prices went this high, the shift in car sales was massive.
This is a very good summary if you haven’t got time to read all the news articles. Also 5 million barrels of refinery capacity coming back online from maintenance, it should all be back by mid June.
(7 min Video) The outlook for oil after Trump pulls out of Iran nuclear deal – Part 1
Amrita Sen, chief oil analyst with Energy Aspects, discusses the outlook for oil after U.S. President Donald Trump withdrew support of the Iran nuclear deal.
https://www.bnnbloomberg.ca/video/the-outlook-for-oil-after-trump-pulls-out-of-iran-nuclear-deal-part-1~1392828
The outlook for oil after Trump pulls out of Iran nuclear deal – Part 2
https://www.bnnbloomberg.ca/commodities/video/the-outlook-for-oil-after-trump-pulls-out-of-iran-nuclear-deal-part-2~1392840
Twitter: https://twitter.com/energyaspects
We were expecting about 1.5 mmbpd growth, now we’re losing 0.5 from Venezuela, 0.4 from Brazil, at least 0.4 from Iran (and I’d say more than expected from Norway, Mexico, China and maybe EF, Niobrara and Bakken), and yet we’re still going to get 1.1 mmbpd. How does that work – all from the new “call on Permian I guess”? Also interesting that there was nothing much in there about other OPEC covering for Iran.
Keep in mind that IEA demand is demand for “liquids” rather than C+C, some of that is likely to be NGL.
In fact, using EIA data from STEO and non-OPEC other liquids (not C+C) and OPEC non-crude liquids from Jan 2014 to Jan 2018 the trend of increased supply of “other” liquids has been about 520 kb/d each year.
If we assume the C+C demand would be total liquids minus other liquids then the result is about 1000 kb/d. Perhaps Bakken and Eagle Ford combined will be flat, Permian and Niobrara will continue to increase and the rest of the World and OPEC will make up for declines in Venezuela and Iran.
Also the IEA assumes oil prices will remain low due to expanding US LTO output, but they overestimate the future increase. Lower US LTO output (800 kb/d rather than 1300 kb/d increase) may lead to higher oil prices and a smaller increase in C+C demand than forecast (perhaps similar to the long term trend of 800 kb/d rather than the IEA estimate of 1000 kb/d (C+C only). Also it occurs to me the IEA non-OPEC liquids supply increase would be about 500 kb/d lower for C+C increase because a lot of the increase (500 kb/d) is probably NGL. So perhaps a 1.37 Mb/d non-OPEC C+C increase estimated by the IEA which needs to be adjusted down by 400 kb/d because Brazilian output is going to increase 400 kb/d less than the IEA thinks. Maybe an 800 kb/d non-OPEC C+C increase because Permian output is also likely to be lower due to transport problems (not enough pipeline and rail capacity).
Higher oil prices will be needed to match supply and demand for C+C.
She said we’d get 1.1 mmbpd – are you saying you don’t think we’ll get that, because that was my question? I got a bit lost.
Hi George,
I think we may get a bit less that she believes, maybe about 800 kb/d of C+C output. I don’t know if she means 1.1 Mb/d of “all liquids” or just crude plus condensate.
My claim is that demand for C+C will be about 900 kb/d (the other 500 kb/d is “other liquids” demand). If US LTO increases by 800 kb/d as I expect, we will be about 100 kb/d short at current price levels, so oil prices will need to rise enough to destroy 100 kb/d of demand.
I have no idea what price level would accomplish that level of demand destruction.
So before the Iran deal and Brazil issue you were assuming we’d get 1.6 to 2.1 mmbpd more, depending on how you treated Venezuela. Is that right?
George,
No I never expected a 1.6 to 2.1 increase in World C+C output. I thought the World would be short and that prices would need to rise.
Then later I realized the long term trend for annual C+C demand increases from 1982 to 2017 has been about 800 kb/d on average each year. For the past 4 years or so it has been a bit higher maybe 1000 kb/d so somewhere 800 to 1000 kb/d was my expectation.
For this reason I expected further oil price increases might be moderate for the next few years (maybe a slow climb to $90/b over the next 5 years, with the usual ups and downs along the way). The change with Brazil and Iran have made me think oil prices will rise faster than I previously believed.
I also thought Brazil and Canada increases would offset declines from other non-OPEC (not including US). I expected other OPEC producers would fill the gap from Venezuela declines, and expect they will take care of declines from Iran as well. Essentially my assumption was flat OPEC output.
Originally I thought we needed an increase of 1.3 Mb/d of C+C output based on IEA demand estimates. I expected US output increase would be about 800 kb/d.
I later realized the IEA’s demand increase estimate is “all liquids” rather than C+C, so the demand increase estimate was revised to 900 kb/d because the increase in “other liquids” demand has been about 500 kb/d (from 2014 to 2017) 900+500=1400 kb/d of all liquids demand increase.
So with this revision and the decrease in Brazilian output by 400 kb/d (no increase vs previous forecast of 400 kb/d increase), if US output increases by 800 kb/d and OPEC output remains flat (increases by KSA, Kuwait, and UAE cover declines in other OPEC producers) the World is only 100 kb/d short in 2018. Oil prices need to rise enough to destroy 100 kb/d of demand, a WAG would be $85/b would do it, maybe as much as $100/b.
Scotiabank sees inventory draws
https://pbs.twimg.com/media/DdVBR3IXcAIPgck.jpg
pdf file: http://www.gbm.scotiabank.com/scpt/gbm/scotiaeconomics63/SCPI_2018-05-16.pdf
https://twitter.com/ScotiabankViews
Is that pattern possible, I’d have thought price would go super-exponential fairly early on and then anything could happen?
George,
It seems the expectation is that KSA, Kuwait, and others may be able to fill in for drops in Iranian and Venezuelan output, there may also be help from Russia and other FSU oil producers in filling the gap.
My view is that is an overly optimistic outlook, but that may be the majority view of the oil futures market which tends to influence the price of oil over the short term.
But that is not relevant to my point. Their predictions for stock draws include those assumptions. I’m saying something will happen on the demand side in a long pattern like that.
George,
I assume that their assumption for stock draws is based on flat OPEC/Russian output. I agree that oil prices are likely to increase to destroy demand, I also think the assumption that OPEC/Russia will not increase output may prove false as oil prices increase, there will be more development and “cheating” on the deal with higher oil prices.
So it will be a combination of reduced demand and increased supply as oil prices increase (though I expect demand might be the bigger factor over the short term).
Yes I guess that continuous large draws would raise the price high enough to stop demand growth. But as you know most forecasts are like this.
Thanks for posting these links Energy News!
Basically Amrita is saying the only way we balance the market next year is with demand destruction because the supply won’t be there. From 2011-2014 with oil over $100/barrel we didn’t get much demand destruction until the end of 2014. Do we need three years of oil over $100/barrel to start seeing demand destruction? Or does it happen faster this time? We are expected to draw on inventories the rest of this year(400-600kbpd) and it sounds like Amrita thinks we will be drawing on inventories most of next year(at least the first three quarters) also unless demand really comes down.
Main reasons for limited supply growth next year
1) Iran sanctions
2) Brazil not production what everyone thought
3) Permian pipeline and infrastructure issues
4) Venezuela
5) Canadian pipeline capacity
Don,
Agree those links were great. Thanks Energy News!
Note that Brazil’s output is expected to be flat yoy, Canadian output is expected to go up in 2018 and then be flat in 2019, she expects Permian output will far below the EIA forecast due to transportation contraints and estimates oil prices will need to go to $85 to $100/b to destroy demand and balance markets around 2020 or so, it probably takes until 2023 or later to see new deep water project output to hit the market, in the mean time US LTO may see some increase as pipeline constraints ease by 2019.
What deep water projects do you think are going to hit the market in 2023?
George,
Perhaps nothing at all, I don’t know the details like you do.
My thesis is that oil prices at $85-$100 (or perhaps higher) per barrel may lead to more projects being sanctioned than would be sanctioned at $40-65 per barrel.
I am also assuming about 5 years to get a deepwater project up and running, so if there are a few projects that get the green light before the end of 2018, some output from those projects may begin to hit the market by the end of 2023.
Bonga (Nigeria), Anchor and Tigris (GoM), two or three in Brazil and Rosebank (UK) are likely to be approved even at $60, and there are still a few small tie backs around that will be done before 2023, but together these aren’t enough to prevent overall decline even in their own basins. After that there are some difficult, large projects that didn’t go anywhere with oil at $120. There have been few discoveries since and most decent ones have been fast tracked, so anything else would need to go through a lease/discover/appraise/develop cycle, which is more like 10 to 15 years, assuming there is something to find.
In 2023 a lot of the short cycle projects bought on in the boom from 2012 to 2016 will be at end of life and the larger ones starting a bit later might be coming off plateau, so decline rates could be picking up, especially if the last in-fill opportunities are used before then to try and maintain production.
George,
Thanks for the info. What kind of decline for offshore output do you expect from 2017 to 2023? 2017 output divided by 2023 forecast for offshore C+C (or C+C+NGL if that’s easier data to work with).
Offshore I don’t know, because there is not enough data for OPEC. I have posted projections for Brazil, Mexico, UK, Norway and GoM over that past year. Angola I think will drop like a stone after the second Kaomba vessel is ramped up (I think I’ve posted comments for that at some time as well). I’m not sure about Nigeria but their existing big FPSO’s will all be well off plateau in that period and only Egina and Zabazaba in construction at the moment. In general deep fields tend to have short plateaus and post plateau declines of over 20%; continual new projects are needed to maintain production, and so the recent investment collapse will hit there hardest. There are some newer basins that may do well, but there’s not much history to base trends on – e.g Guyana and North West Africa, maybe deep water Mexico as well, but there might be a bit of overexuberance there.
Thanks for you insights.
A post putting all your forecasts together might be interesting.
My thesis is that $85-$100/bbl oil will lead to a flood of investment in electric vehicle manufacturing. Takes about 3 years for an existing EV maker to build a factory and start producing cars; 5 for a startup. Takes about 3 years for a battery factory. Takes about 3 years for a lithium extraction operation, maybe 2. 3 to 5 for nickel or cobalt.
So if we have high oil prices in 2018, we should see a boom in EV production circa 2021.
Only an idiot would invest in expensive oil supply in this situation. I don’t know who to figure out how much dumb money there is though.
There aren’t enough stocks in storage to handle a 1 mmbpd excess demand for three years so the demand destruction would have to be more dramatic (or maybe all the strategic reserves get used). Maybe well get further clarification as to whether a fast oil spike can cause a recession, especially as the central banks don’t have many arrows left in their quivers now, plus the latest tech. boost might have run it’s course and climate change damage impacts and costs are noticeably starting to ramp up.
George,
I don’t think Amitra Sen believes that there will be no increase in Permian output (it has already increased by about 200 kb/d in the first 3 months of 2018), just that it will not be as large an increase as predicted by the EIA (about 1100 kb/d for all US LTO in 2018). My estimate is that it will be about 800 kb/d this year and increase to 1000 kb/d (for all US LTO output) in 2019, increases will be slower from 2020 to 2022 (about 400 kb/d each year on average or 1200 kb over a three year period).
After 2018 there will be more pipeline capacity in the Permian basin (and possibly Canada as well) to handle some of the increase in demand and higher oil prices may also lead to more rapid brownfield development, it may be that oil prices rise far beyond $100/b to $150/b or even $200/b. The higher oil price is the greater oil supply will be (relative to a lower oil price scenario) and the lower demand will be. At some point the market becomes balanced. It’s also possible the higher oil prices could lead to slower economic growth, which also tends to reduce demand for oil.
The specifics are beyond my ability to predict.
How much of that Permian increase can be exported? The spread has been pretty healthy for quite awhile. Now, approximating $8, yet the high export was last week at around 2.5. I’ve read various amounts for a projection, and the most common amount is around 3 million. Increases to that are not due for several years.
DC,
As for Canadian pipeline capacity: Trudeau’s government announced that it would reimburse Enbridge for loss caused by “politically”…motivated, I think was the word “problems”.
That sounds like pretty much what Enbridge wanted to hear, so they won’t pull out of the TransMountain pipeline project as they said they would do by the end of May if there were no help in dealing with delays imposed by BC and her allies on the matter.
(Grammar? Who needs grammar?)
I am thinking the TransCanada XL to the US will be completed at some point, I would also think the bitumen could be moved by rail.
Not really sure the best solution, but in time the problems might be reduced, especially as oil prices increase over time.
Kinder Morgan, not Enbridge.
doodles,
Correct.
I was beginning to lose hope that someone would notice. Thanks.
But the question was, given these assumptions what is likely to happen to demand, not what things on the supply side are likely to validate or invalidate those assumptions.
George,
Price will rise high enough to destroy the appropriate amount of demand so that supply and demand match at the new price level, note that I think of stock draws as a component of “supply” that is used to satisfy “demand” aka consumption of petroleum products.
As stocks fall below some critical level (enough to fill the pipelines and maybe another 14 days of demand as stocks in commercial storage) then output must match consumption and oil prices will rise to a level which will make this a reality.
Whatever assumptions one makes about supply, demand must match and the oil price makes it happen.
Dennis, the dominant effect is substitution. My current projections point to demand destruction from EVs etc. outracing supply decline by 2023-2025.
Unlikely
Nathanael,
I expect maybe 2035-2o40, it will not happen overnight in my opinion, replacing 1 billion cars in 5 to 7 years would be a challenge, currently about 70 million light duty vehicles are sold per year, even if that went to 100 million, we would only have 600 million plugins in 6 years if that transition happened “overnight”.
It just is not likely to happen as quickly as you envision.
And talking of Norway, still falling and still well below forecasts:
http://www.npd.no/en/news/Production-figures/2018/April-2018/
Preliminary production figures for April 2018 show an average daily production of 1 868 000 barrels of oil, NGL and condensate, which is a decrease of 34 000 barrels per day compared to March.
…
Oil production is approx. 4 percent lower than the NPD’s forecast, and about 3.0 percent below the forecast this year.
…
The main reasons that production in April was below forecast is maintenance work and minor technical problems on some fields.
I think the NPDy need to be factoring in technical problems in their forecast – it’s a mature basin, and likely had some cut backs in planned maintenance as the price fell, they need to reduce their expected average availabilty.
Thanks George.
Using data from
http://www.npd.no/en/news/Production-figures/2018/April-2018/
and considering C+C output only (leaving out the NGL) we have the following from Jan 2017 to April 2018, C+C output was 1521 kb/d in April about 66 kb/d below forecast. For the remainder of 2018 the average monthly C+C output is forecast to be 1566 kb/d, for the first 16 months of the forecast C+C was an average of 40 kb/d above actual output, so potentially the final 8 months of 2018 might also be below forecast at a similar level which would be about 1526 kb/d roughly similar to the output level in April 2018.
Exactly, they need to use better availabilty estimates.
George,
No doubt you are right, but forecasting is a tricky business. I think the NPD did well to get the previous average forecast for the past 16 months at within about 2.5% of actual.
Generally the NPD seems to do a great job with their data, but I have not looked closely at their previous forecasts.
Looking back at Dec 2016 and Dec 2017 reports, for Dec 2016 the forecast was 5% too low over 24 months and for the Dec2017 report the forecast was 2% too low over 24 months (comparing 24 month average of actual and forecast output).
EIA US weekly exports – rose to 2.56 million barrels a day, a new weekly record.
http://ir.eia.gov/wpsr/overview.pdf
Bloomberg chart https://pbs.twimg.com/media/DdU4p2xUQAAW-ap.jpg
Those 2.56 Mb/d of exports are crude oil exports.
Big drop in distillate again for twip. By that EnergyAnalysts piece there are supposed to be a lot of refineries off line, but I don’t think they are in the USA. We could see $80 Brent touched tomorrow.
I noticed in the weekly report that they released some oil from the SPR. Could it be heavier oil refineries could not find elsewhere?
https://www.energy.gov/fe/articles/doe-announces-notice-sale-crude-oil-strategic-petroleum-reserve
Not sure what flavor or location on this one.
I don’t know, lots of noise month to month.
“The Notice of Sale announced today includes a price-competitive sale of up to 7 million barrels of SPR crude.”
Ok so then it can continue for close to 4 more weeks at that rate. Anyway, with consumption rising in 2H2018 and takeaway capacity problems in Permian basing and declining production in other places, I think they will have to release more oil from the SPR sometime this year anyway.
By the way, this in the latest iea monthly report caught my eyes:
“Global refining throughput is on the rise with runs expected to hit a record 83 mb/d in July-August. Throughput growth, however, is not sufficient to cover all refined products demand, with stock draws expected to persist through 2Q18 and 3Q18”
That doesn´t sound very promising.
“We could see $80 Brent touched tomorrow”
Bring it on George, I still have another thousand shares of CRC I want to unload before the price turns around later this year. CRC supplies the west coast and sells product at Brent prices. Any predictions on the peak and when ? This shortage of distillates has been in the making since the beginning of the year. I would expect a larger delta between gasoline and diesel price before this problem is back in balance.
I pointed out this trade to Dennis less than 3 months ago. When CRC was trading at $20. Now it’s at $35.
Sorry Dennis, but there is a reason to follow the weekly balance sheet.
Hope it works out for you. I am less confident of my ability to predict future prices, so it seems like betting on the ponies from my perspective, too many variables even for an expert (which I am not).
Oh ponies are not so bad with $2 bets for the horse to show. Never win much, but standing in line to cash in looks good.
May I suggest Disneyland for you Guym. For a hundred bucks, you can stand around all day and they will take you for a ride.
The difference between a man and a boy, is the price of his toys
Ah, at sixty nine, you can’t get me to take that bait. Besides, your investment is stock, mine is derivatives. Ponies are $2, because of the odds, and I haven’t done that in about twenty years, either. The derivatives are leaps. Started of at 7k, transferred into 2020 USO at 11k, now at 17k. And each time USO goes up a $1, the 11k doubles. Until 2020. And I can lose it all if oil drops below 65. My idea of a small bet. By the time your 20k investment doubles, mine will make 20k, too, with a 7k investment. Or, lose it all. Never come to the table with blood money.
So you prefer Russian Roulette
*******
“you can’t get me to take that bait”
“And I can lose it all if oil drops below 65. My idea of a small bet”
So you do comedy too ?
No, but I do ignore.
Remember back when lifting the US oil export restriction law was going to eliminate the WTI/Brent spread?
North American crude & condensate production is already up 1 & 1/4 barrels million barrels per day from the 2017 average
Average Canadian production in 2017 was 4,203 kb/day. The average for January & Febuary is 4,469 kb/day.
Average US production in 2017 was 9,353 kb/day. And so by that measure US production is no doubt already up 1 million barrels per day in 2018.
2018-05-17 (WSJ) American shale drillers are still spending more money than they are making, even as oil prices rise.
Of the top 20 U.S. oil companies that focus mostly on fracking, only five managed to generate more cash than they spent in the first quarter, according to a Wall Street Journal analysis of FactSet data.
WPX Energy Inc. reported an adjusted net loss of $30 million last quarter, which it said was driven by $69 million in losses on its hedges due to higher oil prices.
https://www.wsj.com/articles/oils-at-70-but-frackers-still-struggling-to-make-money-1526549401
https://pbs.twimg.com/media/DdZD2qwWkAA3BAx.jpg
Demand has grown the most in some of the lowest per capita income countries. And many countries used the period of low fuel prices to lower fuel subsidies.
2018-05-17 SINGAPORE/MUMBAI/MANILA (Reuters) – Oil prices are poised to break through $80 per barrel and Asia’s demand is at a record, pushing the cost of the region’s thirst for crude to $1 trillion this year, about twice what it was during the market lull of 2015/2016.
https://www.reuters.com/article/us-asia-oil-demand-costs-analysis/asia-oil-thirst-tab-1-trillion-a-year-as-crude-rises-to-80-idUSKCN1II0I5
https://pbs.twimg.com/media/DdYap4jXUAI93B4.jpg
US Weekly Ending Stocks
Crude oil stocks are down -1.4
7 oil products are down -1.9
The SPR is down -1.5 million barrels (not show on chart)
Propane & NGPLs are up +3.2 (not show on chart)
I don’t know but I guess that due to the large increase in exports, a crude inventory level that is 50 mb above the 2014 level could be considered the new normal level?
The price curve is starting to look like early stage panic contagion. Maybe tomorrow’s drilling numbers will cool it off a bit.
This jump is higher in OPEC basket, and other international. At some point, what EIA and IEA think or the increase in DUCs, becomes irrelevant.
I don’t know, I’m going to wait and see what happens during peak demand. As everyone knows – June, July and August usually all show draws.
https://pbs.twimg.com/media/DcGFnTVW0AAyNPS.jpg
I think it might be the distillate going below the five year averages that is getting people nervous. The summer driving season in USA and A/C season in the Saudi are likely to push things further that way for the three main reported numbers. It’s interesting to watch – I always wonder if these things are deterministic, i.e. would it always turn out about the same from here, or could one trader missing his alarm clock one morning end up adding $20 to the average annual price that wouldn’t have happened otherwise.
Or, in this age of computers could you still make a keystroke error?
North Dakota – update through March 2018 by Enno Peters
In the final tab the performance of the 5 leading operators is shown. EOG, the largest US shale oil operator, hasn’t completed any new wells in North Dakota since October last year , and produced just 43 kbo/d in March, vs 70 kbo/d in June 2017.
https://shaleprofile.com/index.php/2018/05/17/north-dakota-update-through-march-2018/
and only one since June
Per their first quarter results, they drilled four wells, and deferred completions until later in 2018. Their big area is the Eagle Ford, and now the Permian. Holdings in Bakken and Powder River, but much smaller. Their plans were to complete almost as many in the Permian as the Eagle Ford. However, it looks like the Eagle Ford is more the primary this year. Probably, bunches of DUCs. It was one of the companies with a substantial profit for the first quarter (around 638 million) and free cash flow. Completing a bunch of Permian wells that would be subject to huge discounts would be unnecessary for them.
Which brings me to the topic of Energy News post above about oil companies that continue to lose. The hedges are a big drain now, and the discounts will make it worse for some. I believe I read in a Platts article, that the Permian is creating a huge situation of haves and have nots. Many of the more knowledgeable secured pipeline contracts to cover most of what is being completed this year. Then there are the Mavericks who didn’t, who may wind up getting gobbled by the haves. All we hear is the Permian song, and not the sobbing of the have nots. Absorbing losses on hedges, and then dealing with a huge discount must be painful.
https://www.forbes.com/sites/davidblackmon/2018/04/27/the-u-s-oil-boom-is-starting-to-see-some-limiters-to-growth/
Sees more modest growth in 2018.
In recent weeks, there have been announcements of two new Gas To Liquids plants to be built in Kentucky, one in Floyd and one in Pulaski counties.
These plants are the vanguard of new, smaller, modular units that are poised to have enormous impact both on the upstream (producer) side and the downstream side as a supply of high quality products.
Any idea how the cost of the end product in these GtoL plants compares to Liquid straight from the ground? Expensive process? Is this kind of plant in effect a refinery, or does refining follow up?
H/GK
This whole GTL thing is fairly new to me so I cannot offer much in the way of reliable info.
The Appalachian Basin area – primarily Pennsylvania – has had a few companies tentatively float plans to build, but do far nothing going on.
This Kentucky stuff surprised me as one company was talking about it and now 2 seem to have made the plunge.
The bigger factors seeming to be in play are:
Modularization where trains of 700 bbld are produced in factories and then shipped to location.
New catalysts and processing techniques (micro channels?)
Price spread of WTI to HH
Amount of supply gas available.
The companies involved disseminate the usual hype so it can be difficult to make objective evaluation.
However, hundreds of millions are being spent so something substantive is probably taking place.
I’d guess they are designed for around 200 to 300 bpd and will never achieve nameplate.
From the Forbes article
The one Shell was looking at in Louisiana was going to cost 12 billion and produce 100,000 b/d. They scrapped it when price got to 20 billion. the article mentions Tens to hundreds of millions for the projects.
They better get more than 700 b/d barrels a day for that price.
The ones mentioned cost $75 million, probably only for a few wells that would otherwise be flared and I’d guess highly inefficient. Shell did Pearl in Qatar, but I think ended up wishing they hadn’t. GTL and CTL goes back a long way, before WWII, and there was quite a bit of interest after the 70s oil crisis with a US government, under Carter, led initiative and various research projects (if I remember correctly at Argonne mainly). But the plants are really complicated with a lot to maintain and go wrong, and inherently inefficient – there really has to be someway of using the waste heat (e.g. for desalination or combined cycle turbines) for them to be attractive at any scale.
RT/GK
The modularization approach should not be minimized as the big players are currently investing hundreds of millions in implementation.
This implementation is taking place with SAGD plants in Saskatchewan, LNG plants from Elba Island to Corpus, as well as the aforementioned GTL units in Kentucky.
The Corpus Christie (Cheniere) trains #4&5 were switched from standard 4.5 million tons per year to 7 smaller 1.4 mta for the specific purpose of flexibility, cost/operational control, and the experience of implementing for future development potential.
The hardware world dealing with gas and gas products is rapidly evolving with the WTI price of 70 bucks a barrel versus HH going under 3 bucks per million btus.
That energy/cost spread is huge.
Coffee,
I am not sure if this is the GTL plant manufacturer, but it sounds like it could be.
https://www.velocys.com/
They seemed to have moved away from straight GTL and more into biomass, but was before the recent oil price rises, and restart of construction of pipelines out of the M/U basins. From memory, 10 mcf of gas produces 1 barrel of oil. One barrel of oil contains the same energy as 6 mcf. So not the most efficient, but with gas/oil price spreads that current exist, and oil still climbing. You can see the economics coming into play.
It appears natural gas in the form of, either CNG, LNG, Dimethyl ether, or GTL will be the replacement/adjunct for diesel in the near future. Trucks, train and shipping are looking and building engines to consume Nat Gas, in preference to diesel from oil. How far this goes, will depend on the price of oil.
Push
Great to hear from you. Hope all is going well.
Yes, that velocys outfit was the one making the noise in the Pennsylvania area awhile back.
From memory, I think a part of the attraction – for them, anyway – was the ability to process stranded gas. That sounded good to an outsider, but it never took off.
Going forward, the price spread between oil/gas may have significant repercussions.
Best wishes again, push.
OPEC MOMR Table 9 – 5: China’s commercial oil stocks, mb
Seasonal chart: https://pbs.twimg.com/media/DdgWfwCWAAAaSc2.jpg
The point for May is the latest weekly data
Seasonal chart: https://pbs.twimg.com/media/DdgWp4iXkAUjr76.jpg
Looks like they are below the five year average, too. With demand being significantly more, so far, this year.
https://m.nasdaq.com/article/eagle-ford-not-permian-hogs-the-shale-boom-limelight-cm965732
Switch to the Eagle Ford for some, soon.
https://m.chron.com/business/energy/article/ConocoPhillips-going-slow-in-Permian-focused-on-12918686.php
Actually, Conoco said in the beginning of 2018, they were putting off their Permian operations until the infrastructure was more built.
https://www.oilandgasinvestor.com/ep-energy-modifies-permian-jv-focus-eagle-ford-instead-1700306
From the first article:
“From minimal production since the start of 2009, daily production of oil in the Eagle Ford region is now headed toward 1.5 million barrels, per the EIA . This has been supported by an uptick in rig count in the shale play.
The weekly rig count in Eagle Ford was mostly in the range of 188 to 214, per data provided by Baker Hughes BHGE , a GE company. The count fell to below 30 in mid-2016 and is now treading toward 70, reflecting increasing focus on the shale play.”
This is bullshit. The rig count in EFS is currently at 65, and has been in this area since March 2017. Production of EFS increased by 100kb/d in 2017 and was at 1’300 kb/d in February 2018… OTOH, the Permian rig count is at 467, 100 higher than last year and 67 higher than Jan 2018.
There is no data that support an switch of operations from the Permian to EFS. Maybe it is announcements to attract investors to bet on EFS, but it is currently not happening. Maybe in the future, we’ll see.
Goldman: Don’t Bet Against Oil:
https://oilprice.com/Energy/Energy-General/Goldman-Dont-Bet-Against-Oil.html
“Without aggressive action by OPEC/Russia, markets would likely remain in deficit and inventories would draw to critical operating levels by 1Q19,” Goldman Sachs analysts wrote.”
I wonder what they consider “critical” to mean. There is usually a big gap between what the refineries like to maintain for crude and when things get particularly difficult, and then another fair buffer before there would be a major impact on uptime, provided there are no more supply disruptions (maybe a big proviso as there could be unknown political disruptions, increased declines like Angola or unplanned downtown from a major accident anywhere – and with low stocks there would be rapid cascade issues). On the other hand if decline keeps rising without matching supply increase the critical level could happen with the product stocks and retailers, which would mean gas lines as headline news and the end of the world in many motorists eyes.
“Critical” is, no doubt, poetic license. No way, would they be critical by 1st qtr 2019. At a level to start worrying about, maybe.
“critical operating levels”
I interpret that as levels where refineries start to see problems.
I read this in the IEA monthly report from Jan 2004:
“It remains unclear whether the US crude oil stock draw in December and early January below the
deemed Minimum Operating Level of 270 mb was entirely driven by tax-related year-end stock
reductions and lower imports ahead of heavy first quarter maintenance. ”
So deemed Minimum Operating Level was 270 mb in the US in 2004. But now there are more pipelines and higher refinery output than then, so the number must be bigger. How much bigger, I don´t know. Lets say it´s 300 mb now. Currently the commercial oil stocks are at 432 mb. If they declined by lets say 0,5 mb/d it would take close to 9 months to reach that level, close to 4,5 months if they declined by 1 mb/d. We could get there quite fast in other words. But then of course we also have the SPR which I expect will be used before we get any problems.
Is OPEC Russia capable of aggressive increases? I guess we will know sooner or later but my guess would be not so much.
Bakken rig count seems to respond to the local oil price with about a four month delay, although recent responses look to be getting a bit slower and smaller than previously, certainly than during the decline period.
Investors have not flipped into panic mode, and won’t until EIA keeps projecting a supply glut into 2019. As reported, 10 of the top 15 producers reported a negative cash flow the first quarter. Mostly as of the result of the $50 derivatives they loaded up on. They are under the gun, so where is the Capex going to come from to drill more yet? The budgets are set for 2018. I’d guess a large pickup in activity the first of 2019 in most of the other shale areas, and more activity in the Permian towards the latter half of 2019. Overflowing with DUCs now. Still, completion crews are reporting employee shortages. I am guessing that EIAs weeklies are far over what is actually happening now. Big banks like Merril Lynch and Goldman are contradicting EIA’s projections now, as all of the rest get on board, EIA will get its head out of its ass.
Russia. Production problems in the new frontier and increasing domestic demand for crude.
http://www.youroilandgasnews.com/vankor+sees+production+slide+by+15%25+in+2017_147257.html
http://www.hydrocarbonprocessing.com/news/2018/05/russia-eyes-petrochemicals-as-answer-to-crude-oil-reliance
Mark Papa on the last Centennial Resource Conference Call (26 april 2018)
“I continue to believe that the overall US supply response in 2018 and later years will be less than currently predicted by the EIA, IEA and OPEC, resulting in more severe supply demand tightening than currently forecasted by these agencies.
CDEV’s response is to continue to remain unhedged regarding oil. We will employ some tactical oil basis hedges from time to time, but it’s unlikely we will hedge WTI anytime soon. Given our macro view, we see no need to change our industry-leading targeted growth trajectory towards 65,000 barrels of oil a day in 2020.
(..)
As I have stated many times we don’t aspire to be the biggest company in the Delaware Basin, we simply want to be the most technically competent pure play and generate some of the highest GAAP ROEs and ROCEs.
(..)
Yes just a overview Scott, as you the IEA and EIA are forecasting total US oil growth this year of the range of 1.3 million to 1.4 million barrels a day. My forecast is about 0.95 and my forecast for 2019 is lower than that. And I think that with that in 2018, 2019 will see a further constriction in global supply and demand even if you exclude the Iranian sanctions situation. So even at the current $70 WTI price level I see a strong possibility of further strengthening in WTI over the next couple of years. So we would intend to remain unhedged. Yes there is certainly a price when we would lay on some WTI hedges, but at this point I wouldn’t divulge what that price it would be a fluid situation. But I can tell you that price is not $70.
And as far as the futures curve with the severe backwardation I would say it’s laughable that would be my term for it, it’s ridiculous. So that’s kind of my view on macro and then CDEV’s strategy is simply, we would intend to be one of the fastest oil growth entities in the US in what we believe will be a very strong WTI pricing environment over the next multiple years. And the last comment I would make to you is one of the group think items there is out there is short cycle times.
The concept is you have strong oil prices that turns on the shale machine and the shale machine generates a vast amount of oil, which pushes all prices down, i.e., short cycle times and I believe that that group think is 100% wrong, and the concept of short cycle times is incorrect because even if capital gets poured into the shale machine, the shale machine will disappoint in terms of aggregate oil production growth. So I think the industry and the world is going to have to conclude that the short cycle time group think is an incorrect way of looking at global supply and demand over the next multiple years.”
Thanks, Tita. Good info. In regards to the EF being as high as the article goes, I agree it is nowhere near that now. More EIA BS. However, for the future (2019) it will increase, so will the others. Probably, no where near the range EIA can estimate, but probably higher.
Reminder. Iran.
Presently about 4.6 mbpd.
2011 pre sanctions 4.5 mbpd. Lowest output post sanctions 2013 was 3.6 mbpd. Sanctions cost them less than 1 mbpd.
The impact was so low because Iran shares the big gas field with Qatar and condensate was not included in the sanctions. China and India bought a lot.
Plus, they can have Saudi Oil structure in flames in 15 minutes, with current missile technology.
The Saudi’s are having trouble stopping midlevel 1970’s tech.
https://www.slb.com/news/press_releases/2018/2018_0420_q1_earnings.aspx
We know about the constraints, but in paragraph five, Schlumberger gives some drilling results problems that are not being mentioned much in the Permian.
If someone would like to offer advice, that would be great.
I’m an old-time peaker who became disenchanted with the whole business in 2009, when the doom-prediction industry collapsed. Lately, I’ve been trying to reorient myself now that I’ve been out of the loop for most of a decade.
We lay observers are really screwed: The topic is more complex than we imagined, and the subject is populated with cranks and bloviators who have discredited the more sober professionals like Deffeyes, Bartlett, Bahktiari (RIP to all), and to a lesser extent, Simmons. Campbell, and even Hubbert himself, deserve mention for maintaining integrity and level-headedness in retrospect.
Through all my disenchantment, I’ve been considering that none of the basic assumptions about peak oil have changed,–other than its predictability.
1. Petroleum is still finite, and it is not being regenerated (as the abiotic/creationist types think).
2. Reservoirs still generally peak and decline, even whole provinces. (I grew up in Ohio–oil country, once upon a time.)
3. Production peak lags behind discovery peak, and discovery peaked long ago (and is worsening, as 2017 figures show).
4. “Conventional” oil (this is where it starts getting too complicated for a lay person) really did peak and plateau in the last decade, and it’s the vast “bottom of the barrel” that is currently delaying decline.
5. Tight oil, oil sands and other expensive, out-of-the-way sources are propped up by mountains of debt.
6. The situation is actually worse now, it occurs to me, because the onset of decline is utterly unpredictable as the result of interactions with cultural factors.
I ask, first: am I right in the above observations?
Second: are there key posts here, or other sources that you can recommend, to help me get back up to speed?
Thanks.
Yeah, I’d say your statements are valid. As for here, I’d go back and review Ron’s posts on oil, and definitely George Kaplan’s posts on offshore drilling. George is not into projections, but you can determine direction pretty easily from his posts. The level of detail to overall is pretty amazing. Ignore mine, because Ron frequently accuses me of being an idiot. There are other posters on the discussions that provide a lot of information, and Dennis Coynes’ (moderator) comments are good. Energy News provides constant information. There is just a lot here, with constant links to information. There is nobody with all the answers, obviously.
Ron frequently accuses me of being an idiot.
I really don’t think so. I don’t recall calling you an idiot even once, and certainly not frequently.
But if I did I apologize. You are definitely a very intelligent person and as far from an idiot as one can possibly get.
But Trump, now there is an idiot.
I never took offense, just kidding. But as for Trump, and the whole concept of desrtroying, rather than improving, tweeting, and in general stating incorrect facts, that doesn’t place him very high on my ladder, either.
“George is not into projections, but you can determine direction pretty easily from his posts.”
If I ever decide to engage this topic with people again (pretty unlikely), I think my main vow would be to take George’s tack and never repeat anyone’s projection, nor make speculations about what the effects of peak would be.
I would hope to simply state what I know about the present and leave the predictions to the sorcerers:
Conventional production is still flat.
New discoveries continue to decrease in frequency and size.
As Stephen H. says below, “Shale” is propped up by +300 billion in debt, and the wells decline at 60% per year.
I also just read that 75% of revenues in that industry go to service the debt. Can anyone verify?
What other significant current facts would you draw attention to?
Peak oil is actually not discussed very much here. Some, but not much. I never reached this site in regard to peak oil. I arrived here following informative posts on oil, mostly on oil price.com. The reality of peak oil, is that you will only find out when, from looking in the rear view window. I really don’t want to discuss what will happen when it arrives. Pretty much an ostrich that way. I wouldn’t say conventional is flat, rather declining. The balance sheet and income statement of every E&P is different.
Projections of a shale oil well over 20 to 30 years is about the most ludicrous assumptions I have ever seen. Many are stripper wells after 5 to 6 years. Not all, but many. As George stated, it’s in the best interest of associated companies to over hype. It’s their bread and butter, for now.
Hi Michael B,
This is a good summation. I would add one more concern with tight oil – it raises the overall depletion rate. Avoiding peak oil now means maintaining 7-8M bpd of tight oil that declines at 60% annually. Maintaining this sisysphean task takes massive continuous investment, and is propped up by something like $300B in debt. Rising interest rates make this continuous debt increase to support tight oil drilling all the more likely to collapse because of low profitability.
Avoiding peak oil now means maintaining 7-8M bpd of tight oil that declines at 60% annually.
Jesus. So I guess I was right–things are worse now.
Thanks to you and the others for responding.
Probably, worse than that. Mark Papa (former EOG Chairman and current owner of Centennial in the Permian) contends that Tier One sweet spots are due to start running out soon (one to three years?), at that point decline is soon to follow. They will keep producing lesser EURs, but to keep it at 7 to 8 million barrels would require massive capex, and probably not possible. He is not the only one who sees that happening. The biggest proponent of continued shale growth is the EIA and their obviously massive stash of ganji.
Maybe, but I see that there is an opportunity left to add some production capacity in the near future: time has come to democratize venezuela und give that country a prosperous future, free from state reprisals, taxes und so on. There will be just freedom and isles of intense oil production, guarded by us marinse and blackwater. Just like iraq.
A big problem with predicting peak oil is the lack of data, not just data known to be missing (e.g. details on OPEC reserves) but a whole lot that is unknown (e.g. future discoveries). Another is that if the prediction of the peak is wrong there is a tendency to dismiss all the other arguments (most of which might be right) that go along with it. And another is that it is so obvious and simple that commentators seem to need to make it complicated so there is something to fill out their columns. I have made some limited projections, more guesses, but only where there is reasonable data and have tried to avoid guessing future discoveries, and as Guy says, I try to put quite a bit of detail in so readers can get an idea of the uncertainties and make up their own minds. The smaller the entity being considered the easier it is to get right – i.e. a well or a field is not too difficult for an operating company to model (and yet even with all their sophisticated technology they will still carry high, median and low estimates for a long time after production start-up), a planet a bit tougher (maybe a lot tougher than was estimated by some of the peak oil proponents previously, but it’s worth reading their comments carefully – usually there are a few proviso’s that have tended to be forgotten).
However I’ll make two predictions now: 1) “Peak Oil” as a search term will grow back to the levels in 2008 and that will probably lead to more new visitors here; and 2) all the “experts” who have been going on about “lower for longer”, “peak oil demand”, “OPEC has lost it’s power … oops no it hasn’t”, “tight oil is profitable at $X, $Y, $Z etc.” will continue to spout out the same demand side, rose tinted crap, without having a clue how oil is produced and, amazingly, will keep their jobs.
Guy’s stuff and many others here is worth a perusal and each has an area of interest and knowledge (e.g. Guy for Texas), but we are all looking through a fairly small window, and we all tend to repeat ourselves. Following the links that are provided is worth it as well, especially if they go to original data rather than op-ed pieces. Also I try to keep in mind that most articles from trade papers and sites linked to recruitment agencies are written by people whose job partly depends on there not being a peak. And one other issue that seems to be getting worse is how oil and gas gets mixed up – if numbers are quoted without it specifically stating they are for oil (and even sometimes when it does) then it probably means oil and gas combined, which could just be gas-condensate.
What I know about geology, and the actual drilling you can fit into a thimble. However, as to peak demand, it will probably be the same as peak supply. Demand for oil is what is consumed by the definitions being used now. If you don’t have it to use, then what is consumed is the same as supply. Who came up with the term peak demand, anyway.
My wild guess is that we are only within three years of peak supply, now. I wouldn’t take that to the bank, just yet, but my guess is that shale will be decreasing at a faster rate than OPEC could keep up with.
Thanks to you both.
My two cents comes from being a member of a family that has operations in a 110+ year old conventional field that has been under secondary recovery for more than 70 years.
The majors bailed out of our area in the late 1980s and early 1990s because it was too costly in terms of LOE and there was too little room for growth.
One of our wells costs around 1/100 th of what a “major oil basin” shale well costs to drill, complete and equip. We expect 8,000-16,000 BO of recovery in a 30 year period from these wells.
I seriously doubt you will find many shale wells on shaleprofile.com that look to be hitting cumulative of 800K-1,600K BO in 30 years. Sure, there are some, but a very small percentage.
Shale is all about volumes. Economically, it stinks without high oil prices.
However, look at all the large US companies flocking to US shale. This speaks to the lack of other large volume options.
When wells in a tired out old field like ours are more economic than the shale wells the big boys are drilling, that should speak volumes about the oil left to produce on earth, at least that not controlled by NOC’s.
One thing I’d add concerning point 4: In the 2000’s oil went above $25, which had been considered a threshold for new sources of oil (there had always been talk that OPEC tried to keep a grip on the market by keeping the price below this). That and new technology allowed deep and ultradeep water fields and oil sands to get going, and then the price spikes from 2008 to 2014 gave them a big acceleration. Those high prices also resulted in a lot of in-fill drilling and development of some older, difficult shallow water fields. What it didn’t really do was increase discoveries, despite more money going on exploration, which have now been steadily declining since 2010. At the same time gas development was growing and so a greater proportion of total liquids was going to condensate and NGLs. So it wasn’t just tight oil that delayed any peak and led to the glut. A coming issue is likely to be that many of these sources – deep water, tight oil, infill wells, shale gas NGLs – tend to have high decline rates, so once tight oil can’t keep expanding then the supply curve is likely to suddenly become asymmetric with a precipitous drop, and the short cycle options that could ameliorate it (again infill, tiebacks etc.) have been used up, with only oil sands and maybe some frontier offshore plays left, all of which take many years to develop.
Thanks, George, that is good info for all of us.
Very sobering. Thanks.
(And very complicated.)
https://www.usatoday.com/story/money/columnist/2018/05/20/gas-prices-wont-keep-rising/624390002/
Penetrating analysis. $40 oil profitable, keeps coming back, no matter how obviously wrong the statement was.
MSM theme song: I’m Happy (and I’ll punch the man who says I’m not)
https://www.youtube.com/watch?v=VBpSWS31xYs
MSM same in your country as ours:
https://www.theguardian.com/business/2018/may/20/oil-prices-rising-but-set-to-fall-in-2019
All MSN following EIA’s projection as a supply glut in 2019 vs a dearth. I guess everyone is ignoring IEA.
Preliminary production out for Texas today for March. 86,436,682 bbls oil, 9,873,831 bbls condensate, 96,310,513 total making 3,106,791 daily. A 82,454 daily increase from Feb initial daily. Probably have pending file this week for some guesswork. Last two months pending has been on a decrease. Meaning that the reduction in the prelimary pending is reported as in increase in the preliminary production. Or, more simply, there is an increase, but how much it is I can’t guess at, yet. I nailed it last month, but, give a monkey a typewriter, and a word will come eventually.
Guym
Does the pending file just include new leases or is there also data for reactivated leases that have been dormant for many years?
Pending lease file contains those leases that have not yet been assigned a lease number by the RRC. I don’t understand all of the details why. However, change of operator seems to be one reason they would be included. The old wells under the old operator still are included in the regular file, but new wells could be in pending. If you are looking for a particular lease, then you can look it up individually, if you have the operator number, or RRC identifier under queries new lease and click the pending button.
Looking up an individual lease under the pending lease file would take some real work. There are two files supplied. The lease name data, and the production data. Both have to be unzipped and converted into text file with excel. Then, you would have to connect them, which I don’t do. I just use the production data. Files are close to 20k lines long, as they go back to 2005. It’s much, much easier to use the query system for individual pending leases. The weakness in the query system, is that there is no way to get to total pending lease production. Though, theoretically you could. Just run a pendin lease query for each operator for each district, which may take a year or so. They probably do not add this option to the statewide query, because after the first two months, the pending data loses its credibility. Operators do not always indicate correctly that it has been transferred into production.
https://oilprice.com/Energy/Energy-General/IEA-Ready-To-Act-To-Keep-Oil-Markets-Well-Supplied.html
Get serious! If they don’t produce, then IEA will give a daily report on how fast the grass is growing. Or, do they have a ninja economist? If so, they need to send him over the pond to deal with EIA, because EIA says everything is roses.
Brazil Petrobras FPSO P-74 has started and is reported to be producing
The list of new projects https://pbs.twimg.com/media/DY0N225WsAA1zzm.jpg
May 16, 2018 (Petrobras) The average oil production in the country was 2.09 million barrels per day (bpd), 1.0% higher than the volume produced in March. This result was mainly due to the end of the maintenance stoppage of FPSO Cidade de Angra dos Reis, located in Lula Field, and the start of production of the FPSO P-74, located in Búzios Field, both platforms that operate in the Santos Basin pre-salt.
http://www.investidorpetrobras.com.br/en/press-releases/oil-and-natural-gas-production-april-1
Interesting. Could see some more production this year. 2019 and 2020 looks pretty bleak.
All I know is that the CEO of Petrobras was interviewed in April and he said that he expected a few new projects would be ramping up at the start of 2019. And so I thought that production for 2018 might be flat?? And a big increase in 2019?? I guess that the subscription data services will know whats actually happening.
The latest on Permian pipelines
2018-05-20 (RBN Energy) Scrambling For Permian Crude Takeaway Options
..with Permian production rising by 70 Mb/d or so each month, (the use of) Drag Reducing Agents on its own is unlikely to solve takeaway constraints or do much to deflate the still-ballooning differentials between crude in Midland and in Cushing or the Gulf Coast. What other short-term takeaway options are out there? It really comes down to those old standbys: trucking and crude-by-rail.
https://rbnenergy.com/no-time-scrambling-for-permian-crude-takeaway-optiions-as-available-pipeline-capacity-vanishes
The way I read this, only around 200k additional could be added until late 2019? And that toward the end of 2018. Be interesting to see what they come up with on rail and truck takeaway. I think truck is a lost cause. Good info, thanks. It also, indicates what my estimation was, in that around 70k increase a month would be expected. Which, further indicates that EIA weeklies are totally out of bounds. Unless, the GOM is pumping far outside expectations.
January is negative increase for Texas. Leaves 3.5 month’s at 70, or 245k, plus 100k from the Gulf, which will probably decline later. Weeklies appear to be doubling production, which is about par. Getting to 600k would take a hell of a lot of rail. Theoretically possible from what I have read, but sand for completions and oil transportation compete for the same rails. Logistical nightmare.
Ok, humbled again. Don’t think weeklies as of the end of March we’re really off. Pending lease initial for March was 674. Second month pending and production was actually 18k over EIA and my estimate of 4012. So, adding 3107 preliminary production plus 674 plus 362 (estimate from last month) plus 18 gives 4161 for my estimate of Texas. Up 149k. Adding 149 to US total Feb, gives 10,413, or close to the 10,460 weekly Apr 4. 10k either way, and I count it as a ringer. Notice that that is pretty close to Dean’s. He looks to be about 50k over mine on corrected last month vintage. His may turn out to be more correct in about ten months. 50k would be nominal in this game. Ok, sorry we have not posted Dean’s yet. Dennis is better with charts, so we’ll ask him first?
April’s World production from the countries that release their numbers the earliest.
April 2018: 51,007 kb/day.
Average 2017: 51,717 kb/day
Average 2016: 52,021 kb/day
https://pbs.twimg.com/media/Ddurb22VMAI7nnN.jpg
Maduro wins the election in Ven. Congratulated by Cuba, Bolivia, El Salvador, China so far. Because of the latter, far more people accept the result than do not. If India signs on, too, that won’t even be close, globally.
Russian congratulations not yet in the headlines. They will be. Probably others as well.
Carter observed past elections, and gave them thumbs up. Don’t have a any primary info on this one, but with other parties failing to run, what is the point?
We are not going back to a State controlled by foreign capitalist interests, dictating their policies.
The lockout of Chávez by the attempted coup opened up too many eyes.
This is messy, and it will be interesting to see the outcome.