The NDIC Bakken Production Data and the NDIC North Dakota Production Data is in. Production in the Bakken was down 11,941 barrels per day and production in all North Dakota was down 14,104 bpd. The numbers for January were revised slightly. January Bakken was down 35,064 from December and all North Dakota was down 36,331 bpd from December.

As I have pointed out before, the EIA’s Drilling Productivity Report, for some unknown reason, estimates the last six or seven months, when the actual data is available. In the above chart they estimate from October on. This throws their current numbers way off. The DPR data includes the Montana Bakken therefore their numbers will naturally be higher than the North Dakota data.
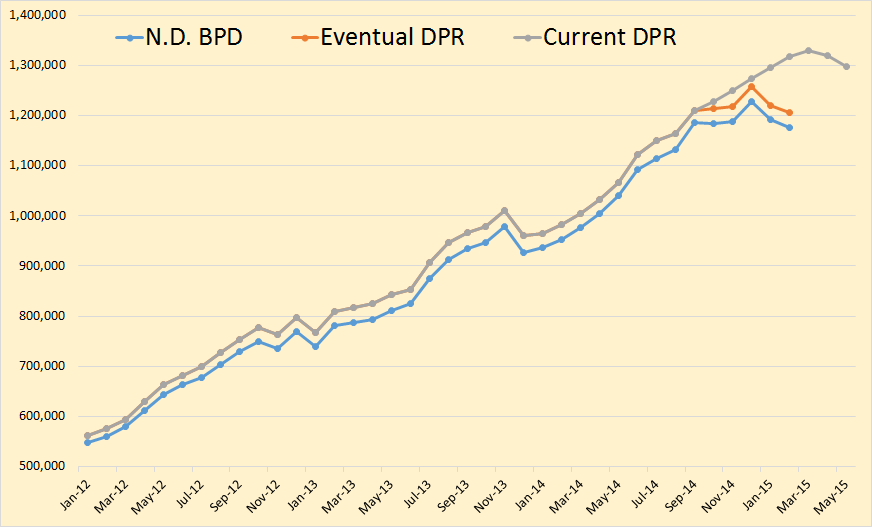
Of course the EIA DPR will eventually bring their numbers into what North Dakota is reporting. The above is what the eventual Drilling Productivity Report will look like. (In Orange). Here is the amount the historical DPR is off.
Month Amount in BPD that the DPR is too High
Oct-14 15,085
Nov-14 32,514
Dec-14 16,096
Jan-15 76,031
Feb-15 112,075
From the Director’s Cut
Jan Producing Wells = 12,197
Feb Producing Wells = 12,198 (preliminary)(NEW all-time high)
9,208 wells or 75% are now unconventional Bakken – Three forks wells
2,990 wells or 24% produce from legacy conventional pools
Jan Permitting: 246 drilling and 0 seismic
Feb Permitting: 197 drilling and 0 seismic
Mar Permitting: 190 drilling and 0 seismic (all time high was 370 in 10/2012)
Jan Sweet Crude Price = $31.41/barrel
Feb Sweet Crude Price = $34.11/barrel
Mar Sweet Crude Price = $31.47/barrel
Today Sweet Crude Price = $36.25/barrel (lowest since Feb 2009) (all-time high was $136.29 7/3/2008)
Jan rig count 160
Feb rig count 133
Mar rig count 108
Today’s rig count is 91
The drilling rig count dropped 27 from January to February, 25 more from February to March, and has since fallen 17 more from March to today. The number of well completions dropped from 63(final) in January to 42(preliminary) in February. Oil price is by far the biggest driver behind the slow-down, with operators reporting postponed completion work to avoid high initial oil production at very low prices and to achieve NDIC gas capture goals. There were no major precipitation events, 7 days with wind speeds in excess of 35 mph (too high for completion work), and 9 days with temperatures below -10F.
At the end of February there were an estimated 900 wells waiting on completion services1, an increase of 75. Comparing December, January, and February completions and production increases results in a requirement of 110-120 completions per month to maintain production near 1.2 million barrels per day.
Notice Helms says wells producing increased by only 1 while well completions were 42. A lot of wells were shut in. And now there are 900 wells waiting completion. The fracking crews are not even working as fast as the drilling crews. And the rig count is down by over 50 percent.
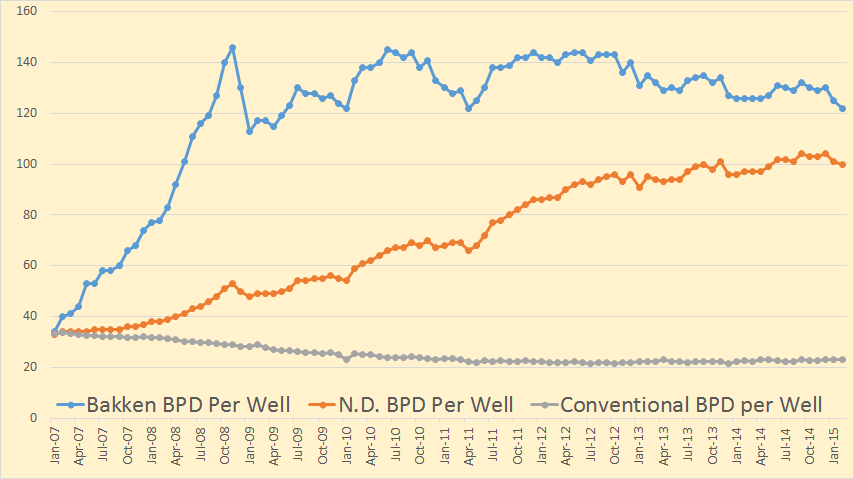
Bakken barrels per day per well dropped to 122. That is the lowest since April 2011. All North Dakota bpd per well is at 100.
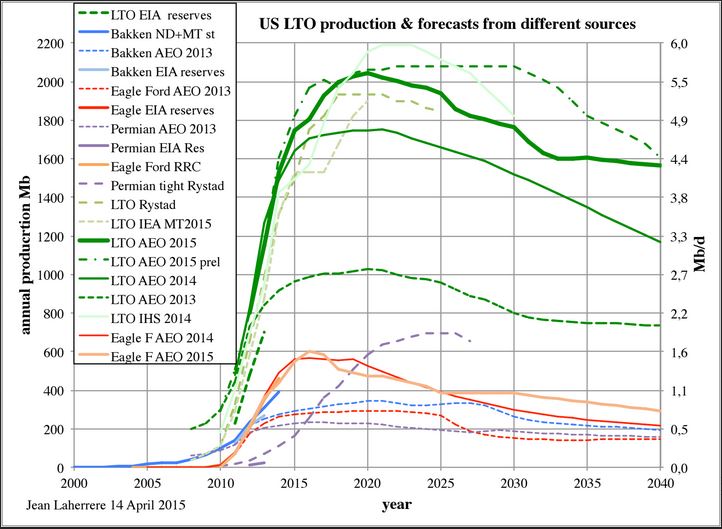
Jean Laherrere sent this and the below chart today. I found them interesting in light of the latest data from the LTO basins. The big one up top, LTO AEO 2015 preliminary, is interesting.
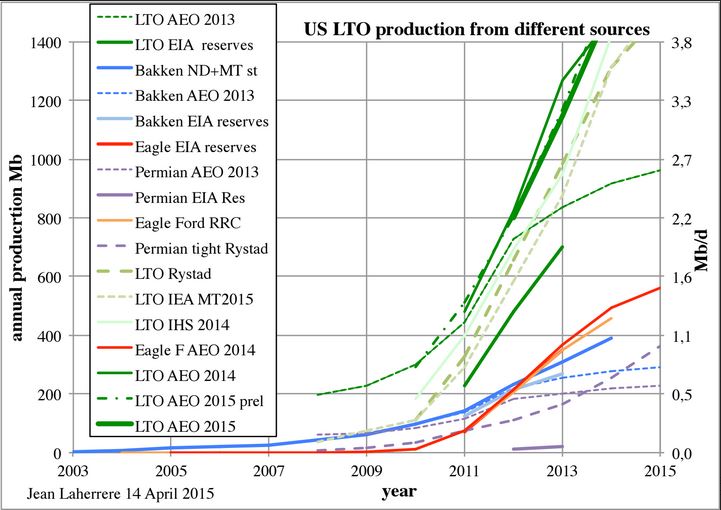
AEO 2015 just came out and both these charts have been updated with the latest data.
I am at a loss to explain the EIA’s overestimation of US LTO production. The data for January was in from Texas and North Dakota yet they still have LTO production increasing through February and flat for March. They have to know that data is way off.
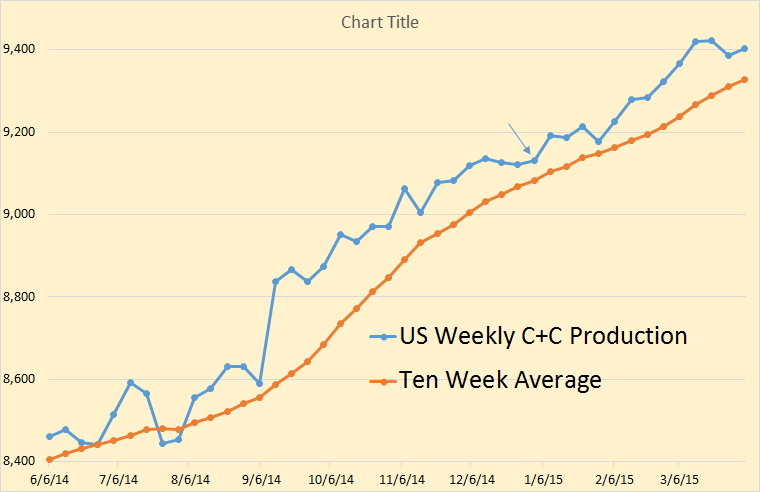
Here is the weekly C+C production data as published by the EIA. The arrow marks January 2nd. And as you can see the weekly data has production increasing right through January and February. It did not and the EIA had to know that fact. The latest weekly data is at least 100,000 bpd too high and perhaps 200,000 bpd too high.
_______________________________________________________
Note: If you would like to receive an email notice when I publish a new post, then email me at DarwinianOne@gmail.com
There was a lot of geographical examination done when production was percolating along.
There could be a lot of information to be had now based on where companies are choosing to complete, at least in the context of where they either must complete for lease holding or where they think they can make money at $31.
Yo Ron
Notice Helms says wells producing increased by only 1 while well completions were 42. A lot of wells were shut in. And now there are 900 wells waiting completion. The fracking crews are not even working as fast as the drilling crews.
How can this result in only an 11K bpd fall. Why didn’t the decline rate eat up that 1 lousy additional well?
Well wait, okay the wells shut in to get down to 1 additional were producing very little anyway, so shutting them in cost not much flow. But still, 42 new completions only dropped output 11K bpd? Isn’t there a 70ish K bpd decline rate per month going on?
Edit, or wait rev 2.0, maybe the decline rate is crashing as the number of new wells with their steep decline is also crashing.
Nevertheless, hmmm, 11K bpd is less fall than those numbers would suggest.
There was a brief exchange with Mike about rework rigs. Rigs that don’t drill new wells, they open or fix or whatever, old wells. They are in the count?
Is it true that completion is the last process for a well before it is contributing to the production numbers, or is there another step to tie oil and/or gas into some kind of collection systems.
Substantially trucks in the Bakken. Takes a long time to lay pipeline and the wells are dead by then. Some is collected that way, as pipe is routed to nodes and drilling happens to occur nearby, but latest numbers seemed to be > 50% trucks.
I suspect they have a requirement to collect gas. This requires a separator, and a gas dehydrator, sometimes they have to add a compressor.
I don’t like to criticize too much but the North Dakota industry practices seem like something out of the 1930’s. This appears to be getting fixed.
So, assuming they use a more rational approach they would have to lay a well flowline to a gathering manifold, feed the collected production to a separator, take the gas into a dehydrator and then feed the dry gas into a gathering line. If they haven’t been thinking thus way they’ll have to learn the ropes. I’ve managed projects done to have the wells flowing within 72 hours after we nipples up the tree valves. The delay was mostly associated with getting the rig to move out. But this process can also take months if the people doing it are rookies.
Fernando, the ND regulators are tightening the gas capturing parameters on an incremental basis.
One of the many challenges facing the operators is the size area over which 10,000 wells have been drilled in little over a half dozen years. The flush early oil production, followed by rapid decline holds true for the gas output also. An operator had little incentive to spend large capital only to have small gas output in a year’s time.
One approach in ND has been the creation of ‘energy corridors’ where pads are linearly laid out enabling service roads, water pipelines, and gas gathering lines to all be all efficiently emplaced. There is a great photo of this on slide #11 in ND’s Aug. 6, 2014 presentation ‘Update Spotlight on Oil/Gas’.
The 10 minute read of that presentation, BTW, is enormously informative about the Bakken.
Vendors are coming out of the woodwork trying to interest the operators in a whole array of gas compressing/liquifying hardware.
coffeeguyzz, I have worked in large scale operations where we shared a similar problem. However, this was in another country, and we were expected to capture all produced gas. We had about 800-900 producing wells, drilled about 50 per year, recycled the pumps and and tubing to keep costs down, so it wasn´t exactly a very high margin operation.
The best solution was to flow multiphase (oil, gas, and water) to a gathering manifold, then connect several manifolds to a satellite station where we separated and dehydrated the gas, and shipped the oil and water in a single line to a plant, with gas being fed to the fuel gas system. From the fuel gas system we took the surplus, compressed, and transferred (we gave it away).
Later I worked in other areas, the approach changes a little bit in multiwell pads. The way I see it, it´s more sensible to put up to 30 wells in a single pad (they don´t have to be drilled at the same time). The well spacing is dictated by the WORKOVER rig needs, the drilling rig skids on top of the well row, and the wells offset to, or under the rig, are protected by very sturdy steel cages.
The multiwell pads allow the manifold to be on location with a test separator. If feasible the pad flows multiphase to a gathering point where the fluids are treated.
I think the problem in ND is the utterly chaotic nature of the development coupled to a fairly lax and hands off attitude by the regulatory authorities. Evidently a more organized and better paced development would have reduced the total rate, but it would also have improved the enviromental footprint and allowed the state to keep its income optimized. I think now its a bit too late other than to slap a patch on what they already have.
Well it’s a lot worse than you would think from looking at Helms’ data. Check the actual “Wells Producing” from the Bakken and North Dakota data.
Wells
Prod.    Bakken  N.D.   Non-Bakken
Jan-15	9,053	11,801	2,748
Feb-15	9,166	11,794	2,628
          113       -7   -120
The Bakken gained 113 wells while all North Dakota lost 7 wells. That means that 120 Non-Bakken wells had to be shut in. Get your head around that one.
Those non Bakken wells were strippers. Shutting them in didn’t deduct much, would be the theory.
Oooh here’s another idea.
Let’s say companies report a completion and some flow in order to pay royalty to the owner and taxes to NoDak and hold the lease, even though they didn’t complete the well and get any actual flow. Who would complain? Only the proppant vendor and the workers not working.
Hmmm, this would result in a lower flow per completion, not higher as we seem to have. Nevermind.
They can be severely punished if they send a fake Completion report. In some countries this can be a criminal penalty.
Hi Fernando,
Is it possible that a smaller choke is being used on the wells (lower flow rate) due to the low oil price environment? Would choking back wells do any damage to the overall estimated ultimate recovery for the well or would it be ok as long as it is not overdone(choke not too small or flow rate not too low)?
Do shale oil wells flow very long? How do you choke back a well on rod pump?
That´s fairly easy. To choke back a well on pump one slows down the pump. This increases back pressure and reduces rate.
Will someone tell me how a rod pump works on a horizontal well? Does the rod bend into the horizontal section or does the rod only go down to where the bend begins?
Ron, the maximum inclination from vertical to economically pump a horizontal well is about 10 degrees, IMO; so the tubing is anchored just at the top of radius. There is a seating nipple in the tubing string to which the the insert pump (attached to the rod string) is landed. The rods go up and down, the pump plunger in the now stationary pump barrel goes up and down and fluid is “staged” up the hole. At the bottom of the insert pump are a series of valves, so to speak, that open on the upstroke, and close on the down stroke.
Setting the insert pump deeper into the radius, causes excessive rod and tubing wear. Its sometimes done, but is very problematic.
Its actually quite possible to choke a well on rod lift other than by slowing the unit down; its done all the time, along with back pressure regulators on the casing, to regulate the static producing fluid level in the well above the seating nipple and GOR/to bubble point management.
I think there can be ultimate recovery issues when choking shale wells back. Proppant embedment and corresponding fracture closure comes to mind, for one reason.
Mike
Thanks Mike.
Mike, if the well flowing bottom hole pressure goes UP the closing stresses are reduced. pulling the well pressure down, or what I call “letting it rip” can be profitable but in most cases it reduces recovery factor in primary producing wells. This can change if we are dealing with very heavy oil wells and other cases.
So what is Exxon doing in the Bakken?
Mike: I have no experience with horizontal wells. Over time, do they require a lot of work over? I am envisioning problems with a 10,000′ lateral clogging up. Admit I know little about this.
Shallow, rod lift at 8,000 feet is a headache. Rod lift from horizontal laterals is a double headache that requires 800 mg of Advil 3 times daily. Remember all those laterals have production casing or liners in them; in the Bakken I think the lateral liner is tacked back to an intermediate string or hung in a hanger. In the EF, one string, top to toe. I don’t think solids is much of an issue, yet. Paraffin is, as is corrosion, etc. A “rod job” where the pump is pulled is typically 25K, if the tubing has to be pulled, etc., 40K. Hopefully that only needs to be done twice a year. Maybe. Hopefully. If you have to fish the tubing anchor, or something fairly normal (Murphy lives in the oilfield), hold on to your knickers.
This shale stuff is new and nobody, I repeat nobody, has all the answers yet. Its complicated. Most 5 year old EF wells I am familiar with produce 125-140 BTFPD on rod lift with varying OWR. Same would be true for the Bakken. Rod lift has its limits.
Mike
Hi Mike and Fernando,
Would the artificial lift be installed from the start and just not turned on until the natural pressure drive starts to deplete, or do you run the well based on the pressure in the system and when the flow rate falls to less than 200 bopd (or some number based on experience) the well is shut down and the artificial lift is then installed?
In case this is not obvious, I know much less than Shallow Sand about oil wells of any sort.
Ron et al, here´s a sketch and a discussion about horizontal well artificial lift. I started to write an answer and decided it was simpler to draw you a sketch. It´s just a brief discussion, the subject can get really complicated, but I think it will give you a pretty good idea.
http://21stcenturysocialcritic.blogspot.com.es/p/typical-horizontal-well-tubular-design.html
Thanks Fernando.
Fernando, Nice, informative article. Thanks for the time/effort.
Your recommendation to monitor Exxon’s horizontals is a good one and I will check that out, time permitting.
FYI, their subsidiary, XTO, is seeking permits for over 550 wells on 46 pads at June’s North Dakota DMR hearing. Apparently they feel the Bakken is a worthwhile venture.
Fernando. Thank you for the information.
Any time you want me to doodle something, just let me know. I notice the Exxoners are designing 12 well pads? That could be a three tine double forks, 6 wells, one pattern placed in an upper zone, the other located offset in a lower zone? They tend to be very careful. If they froze this type of design it bears watching.
Hi Shallow sand,
The flow rate for the first 6 to 12 months probably does not require rod pumps, it is the new wells with higher flow rates that I was referring to. I do not think these wells are put on artificial lift immediately, but I am not a petroleum engineer and don’t know. The average Bakken/Three Forks well flows at about 500 b/d for the first month and at maybe 230 b/d on average for the first year (very roughly), but I don’t know the flow rate at which rod pumps are used, basically when the pressure in the well cannot push the fluid to the surface, artificial lift is needed. Maybe the wells are on artificial lift from the start?
The subject is not straightforward at all.
I guess that is my real question from above, and thank you for all of the answers.
I just question how economic and/or effective it would be to choke back wells on rod pump.
We try very hard to find the optimum stroke length and strokes per minute with regard to each well. In particular, we need to make sure they are set up so they do not pump off, but on the other hand we do not want to slow them down to where they are not pounding fluid.
Many times we are required to speed up or slow down wells as the water flood usually changes over time. We have issues with channeling, and so adjustments are made to injection rate from time to time.
On wells where there is no injected water pressuring the producing formation, we many times place the wells on time clocks, or pump them on set days of the week. These wells, of course, produce little total fluid. Failure to keep an eye on this results in down hole pump failures.
I will agree my field knowledge pales in comparison to many of our posters, and I appreciate all of the information. I would like to see some more technical specifics on choking back non-flowing wells, if anyone has any links I am having a hard time envisioning this, I guess.
Hey, shallow, your curiosity about the time frame of Bakken wells going on AL prompted me to do some checking, to no avail. I just signed up (long overdue) to get the basic subscription for the ND DMR site which will offer WAY more info than I’ll ever need on every ND well going back to the 50’s. Good deal for 50 bucks, I suppose. All wells’ status – including F (flowing) or AL (artificial lift) will be viewable and I’ll let you know what I find.
The other day, a Bak well was described as still flowing after two years production … the implication being it was highly unusual. As the pressure varies considerably over the Bakken and – especially – the Three Forks formations, individual wells show varying timelines before AL kicks in, but six months or so has been considered somewhat the norm.
Dennis, choking an oil well back doesn´t usually reduce recovery. Choking a horizontal well completed with multiple fractures in a tight formation ought to increase recovery.
Why does recovery increase? Because the pressure drop within the low permeability matrix is reduced. These tight zones have very large pressure drops in the tight rock surrounding the fractures. The large pressure drops cause gas to come out of solution, which in turn can coalesce and form gas channels, and these cause a preferential path for natural gas, which in turn leads to faster pressure depletion (it´s the fractional flow issue, I just described it without using equations).
I´m familiar with lab work which proves the fractional flow equations for oil and gas break down. But I´m not sure how these particular rocks perform. The best answer would be obtained by choking wells back and observing their performance.
Let me ask you guys, do you see a tendency for ExxonMobil wells to produce at lower initial rates and also have lower decline rates? EM engineers are super sharp, they are probably working this problem and trying to figure out the optimum path. One thing I learned in my career was to snoop and see what they were doing so I could copy it.
Thanks Fernando.
I dug up some info on XTO vs a few other Bakken producers down the thread.
It does look like XTO does not push production too hard for the first couple of months.
I do not know if EOG is doing something great or just owns some very nice leases, maybe you should check out their 10k, they might be worth a look.
Dennis, those are great charts you posted, as usual. EOG is recognized as not only doing something great, consistently, they purchased virtually their entire Parshall acreage in one fell swoop by buying out the original operator back in ’06, ’07. The Parshall is considered the best area in the Bakken.
You may be interested to know those high production numbers from EOG are coming primarily from ‘short laterals’ – 5,000’/7,000′ long … significantly shorter than their peers.
Better yet, compare the number of Bakken wells producing in 12/14 v 2/15. Looks like a substantial drop in production per well over a two month period, 8 barrels per day per well on average over a 60 day period. Expect that to continue as fewer wells are completed in the next few months. Taking away flush 0-90 day production makes a big difference in production per well.
Watcher – Did you consider that the average well completed in January probably produced for 15 days in January. While those same January completions probably produced for all 28 days in February?
Well okay, but all the December and November completions are crashing their output per the steep decline. Deducts from Jan/Feb.
These are not the first Directors Cut tidbits that are not consistent. Won’t be the last.
The operators are choking back a great deal of output from new wells (November, 2014 and later) in order to NOT sell their product at these low prices.
The monthly production numbers from several wells show a dramatic dropoff … way higher than the norm.
Several CEOs have emphatically, repeatedly stated that they will hold production back as long as viable until better pricing occurs.
And with what money will they pay the loans?
And btw, your theory makes the numbers even more wrong. The fall in production should be even more steep.
Watcher, you probably follow the financial side way more than I, esp since I skim through that end of it, but where are the feared bankruptcies? The ‘redeterminations’ as per the reserve value writedowns pertaining to loan covenants seems to be cookie cutter routine from what I’m seeing.
If the 12,000 ND wells average 100bpd one has over a million barrels. Immediately stop new output and you would still have near MMbpd for some time. Hypothetically, simultaneously frac/produce 900 pending wells at, say, 1,000 barrel 24 hr IP and you have another near million barrels right there.
This game is hard core economics where most operators would rather wait before selling new production for less than cheap bottled water.
Coffee. I think Enno Peters has posted some pretty good information about Bakken production. I think you will find about half of the production in the month of 12/14 came from wells placed into production in 2014. So no new wells for one year would result in a substantial decrease in production, probably drop to 600-700,000 barrels per day by the end of 2015. I think EFS and much of the Permian unconventional has a steeper decline.
As for financing, as long as the companies can keep getting investors to buy more bond and stock issues, they will keep drilling. The model is to pay off the line with these issuances and then borrow from the lines again. The banks are never very exposed, they have the first lien on the assets.
Will be interesting to see how investors react to terrible first quarter earnings, to be released next month.
Or more accurately, first quarter losses.
Good one! Only hedges will avoid losses, and most are
not hedged very well. None of us saw $ dropping below $70 WTI.
The game is what Hyman Minsky defined as ponzi finance. Nothing more.
Hi Ron. Great site. Keep up the good work
MORGAN STANLEY: The plunge in rig counts will end in 12 weeks
And even with 12 weeks till we possibly see the bottom, the decline in rig counts has not dented production yet as less efficient units have been taken offline first, as we recently highlighted via Deutsche Bank’s Torsten Sløk.
How can they keep publishing this bullshit? Production has clearly been dented and dented severely.
Slorer also wrote that now is a good time to buy or increase holdings of oil services stocks.
If Slorer really believes production hasn’t been dented I would be reluctant to take his word about this being a good time to buy oil service stocks.
It is annoying, isn’t it.
OTOH, that which is inevitable is inevitable and it doesn’t really matter what Morgan Stanley says.
Hell Ron I bought oil service stocks in late January based on what you were writing (I focused on the numbers and graphs). I realize you don’t like to brag, but taking the plunge seemed like a good idea. Now I am waiting for the Guardian campaign to drive oil stocks down to buy me some more.
Hi Ron,
If we focus on ND Bakken/Three Forks only (which is where we have the best data):
Output in kb/d (three significant digits)
Sept 1120
Oct- 1120
Nov- 1120
Dec- 1160
Jan- 1130
Feb- 1120
If Dec 2014 is treated as an anomaly Bakken/Three Forks output has basically been flat since Sept 2014, if not production is down 40 kb/d over the past two months or by 3.5%. That is not a big drop in production considering that the rig count has been cut in half.
Fernando has suggested that many of these companies will wait as long as they can to complete the wells that have been drilled due to low oil prices. Perhaps they believe Steve Kopits oil market analysis and think oil prices will rebound in the fourth quarter. If so they may be completing the wells that they expect will have the lowest output (of those that have already been drilled) rather than their best areas which is the reverse of what I expected, or they might be choking back their new wells.
The way Fernando would play this is to weather the storm and try to get as many wells drilled and waiting on completion services as possible financially so that when oil prices rise, wells can quickly be completed. Unfortunately this may just drive prices back down if it happens too quickly.
And the bullshit keeps getting deeper and deeper.
EIA: US Crude Oil Output To Soar Till 2020 Despite Price Rout
The U.S. government on Tuesday forecast domestic crude production will rise even more than expected a year ago, undeterred by the worst price rout since the financial crisis.
U.S. crude oil production will peak at 10.6 million barrels per day in 2020, a million barrels more than the high forecast a year earlier, according to the annual energy outlook by the Energy Information Administration, the statistical arm of the U.S. Energy Department.
Crude production will then moderate to 9.4 million bpd in 2040, 26 percent more than expected a year ago, the agency said.
I just figured out this prediction is from AEO 2015. I will have a post out on that in a few days.
Art Berman sent out some highlights:
Jeff,
At first, I thought those were Berman’s highlights. But, I figured he was highlighting the INSANE EIA Report. We must remember, the EIA is now providing POLITICAL FORECASTS, not actual production forecasts due to the fact that if the world realized peak oil was here, it would destroy the already weak highly leveraged financial system. And, who wants to go down in history for ruining the last great financial orgy?
If we go by Jean Laherrere’s recent chart, the U.S. will be producing about 2.7 mbd by 2030 and a measly 1 mbd of oil by 2040.
Ever think about how we are going to run Dallas, Chicago, Manhattan or whatever large metropolis on 1 mbd of domestic oil production?
LOL.
steve
How does one reach these conclusions? I find it hard to reconcile these kinds of statements when comparing to opinions and modeling done by members on websites such as this.
One of these two differing camps will be eating some serious humble pie. I wonder which way production will end up going?
Don’t worry the EIA will eventually revise their projections to reflect what has actually happened… GRIN!
Fred, what quantity is being plotted there?
Problem with old eia reports is that they seem to be inconsistent with what they’re measuring from report to report. Bit annoying. Are there any in depth comparisons out there of how well their various predictions stack up to reality?
Sam that graph is based on a real one from the EIA and the quantity is in millions of barrels per day… now as to WHAT is being plotted I deliberately omitted that information >;-)
You are therefore free to interpret it any way you like…
You know that Dolly Parton movie, ‘The Best Little Whore House in Texas where the Gov, does the Sidestep? Kinda like that.
[Verse 1]
Fellow Texans, I am proudly standing here to humbly see
I assure you, and I mean it- Now, who says I don’t speak out as plain as day?
And, fellow Texans, I’m for progress and the flag- long may it fly
I’m a poor boy, come to greatness. So, it follows that I cannot tell a lie
[Chorus]
Ooh I love to dance a little sidestep, now they see me now they don’t
I’ve come and gone and, ooh I love to sweep around the wide step
Cut a little swathe and lead the people on…
Sam that graph is based on a real one from the EIA, of course some of the later projections are lines that were added by yours truly. The quantity is in millions of barrels per day… now as to WHAT is being plotted I deliberately omitted that information >;-)
You are therefore free to interpret it any way you like…
You know that Dolly Parton movie, ‘The Best Little Whore House in Texas where the Gov, does the Sidestep? Kinda like that.
[Verse 1]
Fellow Texans, I am proudly standing here to humbly see
I assure you, and I mean it- Now, who says I don’t speak out as plain as day?
And, fellow Texans, I’m for progress and the flag- long may it fly
I’m a poor boy, come to greatness. So, it follows that I cannot tell a lie
[Chorus]
Ooh I love to dance a little sidestep, now they see me now they don’t
I’ve come and gone and, ooh I love to sweep around the wide step
Cut a little swathe and lead the people on…
Oh come on, don’t leave me hanging
Coincidentally, the graph and everything stops at 2030, which is roughly where Guy McPherson predicts our extinction will happen.
But, nice haircut anyway. Perfectly flush with 2030. All you have to do now is add some fracking fluid and comb it down.
delete please
Hi Dave P,
Jean Laherrere’s forecasts are excellent, but he may be a bit conservative on LTO potential. The EIA’s forecasts are much too high. David Hughes forecasts in drilling deeper are quite good in my opinion and are between the forecast of Jean Laherrere and that of the EIA, my guesses, which are based on USGS estimates are fairly close to the scenarios created by david Hughes in Drilling Deeper.
http://www.postcarbon.org/publications/drillingdeeper/
The LTO story is not really that big in the long term picture. The URR will be 30-40 Gb at most from all LTO plays in the US, for the World the URR of C+C less extra heavy oil (oil sands in Canada and Venezuela) will be between 2500 Gb and 3100 Gb (my guess is 2800 Gb) so 30 Gb would be about 1% of this total, there are another 600 Gb of extra heavy oil resources, but these take much longer to develop and the overall contribution to World output will be no more than 13 Mb/d before 2100 (peak in 2060).
About 1200 Gb of C+C have been produced, so if the 2800 Gb estimate for C+C less extra heavy oil is correct then we have roughly 1600 Gb plus 500 Gb of oil sands resources or 2100 Gb left to produce. One possible scenario in chart below.
Dennis,
While Jean’s forecasts may be a bit conservative, I would like to bring up once again the subject of RESERVE QUALITY. Who cares if we have say 25-50% more LTO reserves than Jean uses in his charts. I rather suspect those REMAINING CRUMBS of LTO reserves will be a much lower EROI and profitability.
Furthermore, few in here focus on the financial aspect of the global system… of course Watcher is one of them. With countries fleeing the U.S. Dollar Swift system for international trade and heading over to the BRICS & AIIB, you can rest assured that the value of the almighty Dollar will be worth much less in the coming years.
Sure, maybe Russia might be able to bring on some decent shale oil production as detailed by Doug here, but that’s THEIR OIL not OURS. Well, on second thought if the U.S. and NATO are successful in Ukraine and also with the unseating of Putin with another Western bend-over Ruler such as Yeltsin, then maybe the Russian Shale oil could be OURS.
Regardless, I see a collapse of CAPITAL coming in the next 2-5 years. Without available capital, I would imagine a good bit of that remaining LOW EROI CRAP LTO Reserves may stay where they lay.
steve
Steve,
I read your blog and enjoy the work you do in regards to the EROI factor.
BRICS alternative doesn’t matter though. Neither does all the gold China and Russia have been importing.
Currently 65% of all debt that exists is denominated in US dollars another 20% in Euro’s. the other 15% is denominated in all other currencies combined. So 85% of the worlds loans you need either dollars or euro’s to pay. Not Gold not silver not Chinese yuan or Russian rubles.
If the US and the dollar collapse so does the rest of the worlds currencies and economies.
I have yet to see ANY well reasoned argument indicating that when it becomes necessary the USA cannot print as many dollars as Uncle Sam pleases.
A banking crisis and or a confidence crisis could leave people and countries without dollars as things are organized NOW.
The dollar may well become worthless at some point due to inflation but it will NEVER collapse like a man having a heart attack. It will die a long slow death by inflation most likely, barring black swan events.
People who possess great expertise in banking and the present day banking and money creation system of loaning it into existence are blinded by their own expertise into thinking that institutions such as the Fed are absolutely essential and that such institutions CANNOT be replaced with something new.
Essential they are – as things are organized today- but if and when the situation demands it the entire current day banking system rule book can and will be tossed out the window by Congress and the Executive branch if necessary.
Look for worthless dollars- eventually. But there will ALWAYS be plenty of dollars around except maybe for a short while if the current set up fails to keep them plentiful.
A new system will supply them as needed.
MONEY is not the fundamental problem. Resources and overpopulation are the fundamental problems.
Hi Steve,
Only the EROEI of the entire economic system is important.
At the individual product level only profits matter.
I believe it was Rockman who said something to the effect that oil companies are in business to make money. The EROEI of the barrels they produce do not matter, only the profit they make when they sell their oil.
Perhaps the oil guys can correct me here, does an oil company typically calculate the EROEI of the oil they produce? My guess is that they have no idea what the EROEI of their oil is, nor do they care.
Also Steve, I specifically said the LTO is really not a game changer for World oil. The countries that export oil will sell to the highest bidder, oil prices will increase and other types of energy (natural gas coal, nuclear, wind, solar, hydro, geothermal, and biofuels will be substituted for oil. Oil will also be used more efficiently as prices increase, much less will be wasted driving around in F150s to go to the grocery store or mall.
In round numbers, and to simplify somewhat, they are forecasting that we are looking at around 10 mbpd of C+C production for 25 years.
Let’s assume three scenarios for the decline rates from existing production–10%/year, 15%/year & 20%/year.
In order to maintain about 10 mbpd for 25 years:
At a decline rate of 10%/year from existing wells, we would need to put on line 25 mbpd of new production.
At a decline rate of 15%/year from existing wells, we would need to put on line 37.5 mbpd of new production.
At a decline rate of 20%/year from existing wells, we would need to put on line 50 mbpd of new production.
My comment on the previous thread about US natural gas decline rates and the observed decline in Louisiana’s natural gas production:
http://peakoilbarrel.com/eias-april-drilling-productivity-report/comment-page-1/#comment-511869
“Crude production will then moderate to 9.4 million bpd in 2040, 26 percent more than expected a year ago, the agency said”
Lol.
You can get that production with a big price rise.
Or you can get it with a big cost cut (like a Fed subsidy of loans).
If you HAVE to have the oil, you WILL get it, regardless of price or cost.
Watcher,
QE 4 is just a few quarters of bad news away. That ought to fix things at least for a little while.
I think they will buy more bonds this time around. But instead of MBS they will buy student loan debt this time around.
The majors starting cutting projects in 2014, before the price crash. I think they’d need to see consistently high prices with no risk of OPEC doing again what they did last year and no major volatility risks for a couple of years before they really started winding up again. To develop known resources could take 5 years more; to explore, find and develop new resources (Arctic, deep water etc.) might take 15+. The speech the other day from Rex Tillerson about Arctic access might indicate they see the issues coming.
If that green curve is accurate then the early 20’s looks like a wars all over (maybe civil) because there won’t be enough exports to fill he gap – of those available China has been doing all it can to get guaranteed long term supply agreements, you have to think Putin will be gloating, the Middle East doesn’t look in any way likely to de-escalate the problems (it looks more and more like the 30 years war scenario).
At some point the oil industry will effectively be nationalized so that there is direct government funding to avoid cycles like we have now – even if it is couched in different terms and is designed to ensure the 1% keep their rents (maybe closer to fascism than socialism).
That’s the spirit!!
Your first sentence was the best. Amazing how few are focusing on how that happened.
The majors are currently going about reserve replacement through either acquisition of other companies, or things like production sharing deals with national oil companies (see bp in Iraq). While I’m sure shareholders appreciate this, it’s not exploration and it’s not finding new oil.
Hi Sam,
There can be quite a lot of reserve growth. In the US if we take proven reserves in 1970 an 2013 and multiply by 1.25 as a rough estimate of proved plus probable(2P) reserves and subtract cumulative C+C production from 1970 2P reserves and then add 2013 2P reserves to estimate discoveries plus reserve growth we find that it is roughly 220% of 1970 2P reserves. There have not been many new discoveries of “new oil” in the US, it has been almost all reserve growth.
Let’ s say that the US had been well explored in 1970 and that the World as a whole had been equally well explored by 2010.
Jean Laherrere has estimated about 850 Gb of 2P reserves for the World in 2010(excluding extra heavy oil). If we deduct 30 Gb of US 2P reserves in 2010, we get about 820 Gb of 2P reserves for the World excluding the US. If we assume reserve growth for the rest of the World is only half of the US level, 100% rather than 200%, then we get 820 Gb of reserve growth, cumulative C+C production through 2010 was about 1100 Gb, if we assume about 30 Gb of new oil discoveries we would have a URR= 1100+850+820+30= 2800 Gb of C+C less extra heavy oil.
Probably the reality will be 250 Gb of discoveries and 600 Gb reserve growth
Sam,
At the time the majors were cutting back their capex, the several of the OPEC companies were ordering numerous drilling rigs. Both and Qatar an Abu Dhabi have several Jack ups coming out and we know Saudi and Kuwait have been contracting as many land rigs as they can get their hands on?
So OPEC is either losing production capacity and they need to catch up, or they are trying to ensure they maintain control of the market.
Tool,
Does it have to be either or? Maybe there’s a little of both?
However the middle East rig count has been on roughly the same trajectory since 2011, as this chart from euan mearns shows.
http://www.euanmearns.com/wp-content/uploads/2015/04/opec-count-mar15.png
I don’t see their output rising accordingly, though, and there’s been plenty of time for the increase in rig count to feed through.
Sam,
I feel we will have to wait, to see how it pans out. I feel they are playing catch up and need the extra rigs to stand still. Hopefully I will have better information a month or two.
If I were the owner of a brand new tight oil well I would postpone producing it if I could on a bet that the longer I put off production the higher the price I would get.
The conversation seems to indicate that there are numerous wells being held back from production for this very reason.
This in turn leads me to think that maybe the owners of such wells are not in as much trouble with the bank as you might expect. Or maybe they are – and they are selling out.
If a lot of wells that have been drilled but not Fracked are changing hands – being sold by near bankrupt operators unable to make payments – to other operators with deeper pockets- Would we know about it?
In other words are there regulations involving changes of well and lease ownership that require these changes to be made public within a short time frame? Is any government agency publishing this data? If so would it be even more out of date than current reported production data which seems to be lagging anywhere from a month to three months or more ?
I suppose the better investment advice outfits collect this sort of info but they aren’t going to give it away.
This is all well and good, but for most countries and companies, the oil must flow. Debt has to be serviced. Loans must be repaid. The plebs have to be subsidized, lest they take up arms.
The problem with the idea that the best wells are being held off until later is that the best wells are the only ones that can make you money these days. The wells at the margins are being taken offline and won’t go back on until the price is right.
Pretty much that.
That is the rebuttal to all the “we’ll hold production off and wait for better price” quotes. The loans never sleep. You have to pay them and only production will fund that.
Or not, if someone bails it out.
Most don’t have to pay principal till 2020 or beyond.
That sort of doesn’t make sense.
If they have an avg maturity of 5 yrs, then that was so in 2012 too. Beyond the maturity and more compelling overall are the covenants, which can mandate total debt load not exceed blah blah. Which translates into amortizing the full maturity into a year by year retirement.
Banks are waiving covenants. Before crash most paid off earlier maturing bonds with ones that do not mature until 2020 and beyond.
Clueless made a good point re bank borrowing base covenants. Banks don’t want to put their customers out of business. They are going to hold their nose and see how its going in October.
I am sure some bank (maybe singular) waived covenants. I am not so sure all banks went into their board room and explained how waiving the covenants was good for the bank and posed no risk. I am also sure no HY ETF fund managers were receptive to such an explanation to waive the covenants on the bonds in their portfolios.
I think this covenant waiving story is hype. We’ll know soon.
Mac, it’s a mix of wells. The usual approach is not to mess with high water cut wells. This means some dogs are kept on producing. The best way to save money is to avoid expensive well repairs. Suspend fishing jobs. Don’t change ESPs. Don’t frac new wells, leave them shut in. It may be a good idea to shut in a well with a very low water cut and watch the pressures.
All of this requires a dedicated team of engineers grinding a lot of numbers to optimize the asset PV and deliver the cash needed to survive. And we get into a lot of debates over individual wells. It’s stressful but it’s also fun, sort of like being in Stalingrad in 1942.
As I told you 3 months ago: here I am with an update, 15 months after the model was built. It is now more clear then ever I underestimated the so called “Ultimate Recoverable Resource” in the Hubbert-model a little bit. But… The last datapoint is – altough not exactly on the predicted production curve – pointing significantly downward on the curve of the Hubbert linearisation, more or less matching last years curve.
Since the Bakken economy has changed dramatically the last 6 months all bets are off. That’s the way it looks. On the other hand: Reality is coming back to the model again. 🙂 I will keep my model, without changing the initial parameters, as a reference. It basically says: Bakken will struggle and keep production more or less flat for another half a year, before staring to decline in earnest. We will see.
Edited a typo and lost the graph. So here is the graph again.
Hi Ovi,
Great job on that model, can you remind us of the underlying URR for that model?
The USGS estimates a URR of 10 Gb and Proved reserves plus cumulative production at the end of 2013 for North Dakota Bakken/Three Forks is about 6 Gb, 2P reserves plus cumulative output is about 7.3 Gb, reserve growth is likely to get us close to 10 Gb for URR.
Based on Steve Kopits analysis, I assume new wells added in the ND Bakken/Three Forks falls to about 110 new wells per month from May 2015 to Sept 2015 and then gradually rises to 145 new wells per month by May 2016 and remains at that level until Jan 2030.
New well estimated ultimate recovery(EUR) starts to decrease in June 2016 and the rate of decrease in new well EUR gradually increases to a maximum of 10%/year in June 2017. Economically Recoverable Resources(ERR) are about 9.4 Gb by 2040, peak of 1300 kb/d in 2019. Chart below.
Dennis, My model starts from a Hubbert linearisation, that pointed out an URR of something in the range of only 1.8 Gb to 2.2 Gb. I thought that was a little bit too low, so I made a “best fit”, with the then available data, calculated the other way around and built the final model, which you see here every 3 months now since 15 months, with an URR of 2.77 Gb. I know that is WAY beneath the USGS-data and all that. It’s an educated guess. Nothing more, nothing less. But the total amount of oil from Bakken ND in the last 15 months was predicted to be 463 Mb and it turned out to be 466 Mb. That is a 0.6% deviation. So still: My model is spot on.
(Please notice: The proof of the pudding is the eating: The days of truth are yet to come. Will the ultimate inflection point to the downslope be right? We will see.)
Hi Verwimp,
Sorry I got your name wrong.
I agree your model looks very good so far. I do not think Hubbert Linearization works well for such a short period of data. Cumulative Bakken/ Three Forks Production through Feb 2015 is about 1.3 Gb and if output followed the derivative of the logistic function we would be near peak output, assuming the URR is 2.8 Gb.
It would also mean that proved reserves in the Bakken/Three Forks were overstated at the end of 2013 by about 3 Gb, about a factor of 2.5 too high based on your estimate of URR. Depending on oil prices and the number of new wells completed, a reasonable scenario would be flat output at 1100 kb/d until 2020 if oil prices remain around $50/b, or output rising to about 1300 kb/d if oil prices gradually rise to $80/b or higher by 2020, if the URR is 10 Gb as the USGS predicts (mean estimate).
Your model predicts about 1000 kb/d in March 2016 and 800 kb/d in July 2017, I doubt we will see 800 kb/d or lower before 2026, and expect we will remain above 1000 kb/d for North Dakota Bakken/Three Forks output until at least 2021.
A more conservative scenario is presented below, with 100 new wells per month added from August 2015 to Sept 2031, about 30,000 total wells, and an ERR of 7.9 Gb through Jan 2040. I expect actual output will higher than shown in this scenario as the 2P reserves plus cumulative production were over 7 Gb at the end of 2013 and I expect there will be some reserve growth as oil prices rise in the future.
I will have a new post tomorrow, Friday April 17th, that will give Jean Laherrere’s take on Bakken reserves and likely peak.
Hi Ron,
I look forward to it, thanks.
Why would there be a steady amount of 100 new wells per month for a 15 year period? Especially when they lose money. There may be 8Gb remaining now, but it will stay in the ground. That’s my estimation. We will see.
Hi Verwimp,
They will only drill in the best areas, not all companies are losing money, the companies with poorly performing leases are losing money. Oil prices will rise, if they stay at this level fewer wells will be drilled and the 100 new wells per month will not be drilled.
At $80/b a lot of the companies will be doing fine. At some point oil prices will rise to that level or higher. I expect by mid 2016 at the latest. The 100 new wells per month is a conservative estimate, it may be higher than that.
Today, talked to a relative who lives in the heart of the Bakken not too far from Tioga. He said that things are slowing down some, but the wells have to be serviced, there are a few people leaving but the core workers remain. In other words, the trains with petroleum cars keep on rolling.
Those with tattoos on their necks and arms are gone. har
From fool.com:
Oil from the Bakken shale has increasingly become the preferred oil over West Texas Intermediate, or WTI, by refineries all over the world. And, because there is so much explosive growth in production in the Bakken and the midstream oil transport capacity can’t keep up, the oil is selling at a premium. In this video, Motley Fool energy analyst Joel South talks about what this means for WTI, and why he thinks Bakken oil will soon be the U.S. standard.
I was wondering for a minute there if your clock was off a couple of weeks and it was April one and the piece a parody from the Onion.
But it is three years old and sure is good evidence of how much attention we ought to pay to pundits such as the ones at fool.com.
Three years used to seem like a long time back when I was young. Now it seems like three months back then.
Yeah, I know it is as old as the hills, but I believe it remains still the same.
10,000 rail cars each week of petroleum cars pulled by the BNSF is the proof in the pudding. Doesn’t seem to let up that much and not much decline in production.
But back here in present time and in the real world, Reuters reports that US refiners are increasingly rejecting “Imitation WTI” blends of heavy crude oil and condensate:
http://peakoilbarrel.com/eias-april-drilling-productivity-report/comment-page-1/#comment-511864
Not really sure what to make of this article. It’s premise appears to be: If the refiners like it, the Bakken production will stay up. Does that make sense to anyone here? If so explain.
http://eaglefordtexas.com/news/id/150140/from-the-east-coast-bakken-oils-outlook-not-so-bad/
I know nothing about what refiners need in the way of crude, be it Williston Light Sweet, etc. I do know if I am in the refinery business, I would be clamoring for drill baby drill to continue. Refiners love $30 crack spreads and growing demand, neither of which occur at $90+ oil prices.
KSA seems very perplexed as to why US independents would keep drilling wells in the current environment. They must assume the managemt of the US independents are playing with their own $$. How wrong they are.
There will not be many BK with regard to US independents until 2020, if ever. That is when most
of the bonds start coming due. Until then, US independents will forge ahead, paying the 5% interest, borrowing more if they can, in hopes that oil prices return to 2011-14 levels.
To KSA it seems simple, US independents should save themselves by stopping all drilling and dropping US production by 1.5 million bopd this year. They just don’t understand that, unlike Saudi Aramco, US Independents are playing mostly with other people’s money, such as pension funds, etc.
By US having less of an energy policy than in pre 1971 Texas RRC, we will surely burn up the shale reserves as quickly as possible for the lowest price possible. Oh well, maybe we will convert the fleet by then to natural gas and electric.
Thanks sand, it makes some sense now. With capacity factor of over 40 percent in ND, maybe some of these drillers will move into wind power before they go down the tubes. Got to run the next investment scheme.
A drilling company, or a small independent, is as likely to invest in wind power as Coca Cola and Unilever. Most companies have management and a work force with a particular set of skills. Oil company skills don´t transfer well to putting up wind turbines. This is something that REALLY needs to sink in, because I read these remarks and articles about forcing oil companies to invest in renewables, which completely ignore reality.
IF oil companies can´t access commercial opportunities in their field they will disappear. The employees get laid off and the stockholders invest in OTHER ASSETS, which don´t necessarily have to have anything related to energy.
Yeah.
It’s all about the staff inside the company – they know where their skills fit, and they’ll resist moving into things where their professional expertise isn’t relevant.
The same thing is true of car companies, which helps explain why some car companies have been slow to transition to EV/hybrids, and why some companies have been schizophrenic – actively rolling out new products in one division, but seeing passive resistance in management, other divisions, or in the dealerships, where salespeople actively move buyers away from these newfangled things they don’t understand.
You can tell a car company doesn’t understand EVs when their television ads try to tell you that EVs are almost as good as ICEs. Obviously, the execs feel they need to apologize for these weird new things, rather than selling them as better than ICEs – which they are.
You could tell that a car company “got it”, when their commercials started out showing people in the bathroom shaving with noise, smoky gas-powered shavers, then moved to show their clean, quiet EV.
The Strib’s take…
N.D. sees second consecutive monthly drop in oil output
[Excerpt from article]
North Dakota’s oil output declined for the second consecutive month as just one new well was completed in February and some producers pumped less oil and gas to meet flaring rules, state officials said Tuesday.
“It was an unusual event,” Lynn Helms, director of the North Dakota Mineral Resources Department, said of the back-to-back monthly decline in production, which last happened in 2011.
Oil production in the state likely will fall through May because of the drop in the number of drilling rigs to 91 this month, less than half the number operating a year ago, he added.
Output was just under 1.18 million barrels per day in February, a drop of 50,435 daily barrels since December, when the state hit a 1.2-million-barrel-per-day record high.
Helms said the falloff in drilling has happened faster than projected, driven by low oil prices that have cut capital investment by oil companies. The output of newly completed oil wells always declines, so new ones must be drilled constantly or an oil field’s production steadily drops.
After North Dakota’s news, light sweet crude oil futures for May closed the day up 3.2 percent at $53.55 per barrel on the New York Mercantile Exchange.
Helms attributed most of February’s drop of 14,000 barrels per day to producers cutting back production to meet new regulations on flaring, or burning of natural gas at wells that are not connected to pipelines. Under regulations that gradually get stricter, producers are allowed to burn no more than 23 percent of gas output or face state-ordered cuts in production.
The number of uncompleted wells in North Dakota rose to an estimated 900 at the end of February, Helms said, as drillers decided to hold off on the final step — hydraulic fracturing, or injecting water, sand and chemicals to free gas and oil in shale layers. Helms added that he expects a surge of fracking in June if sustained low prices trigger a state law that cuts oil production taxes.
“I think we are going to see continued production declines through May and then we’ll see a big catch up in June that will take us back up pretty close to the 1.2 million-barrels-per-day-mark,” Helms said on his monthly conference call with reporters.
For reasons that are not yet clear, a smaller share of North Dakota’s oil — 55 percent — ended up on oil trains in February, said Justin Kringstad, director of the North Dakota Pipeline Authority. That compares with 58 percent in January, he said.
[End of excerpt]
Interesting energy statistics from China.
In the first quarter of 2015, China’s electricity generation fell by 0.1 percent compared to the same quarter last year. Official statistics say that China’s GDP grew by 7 percent in the first quarter from the same quarter last year (and industrial production grew by 6.4 percent).
In the past, China’s electricity generation growth generally matched the overall economic growth. But in years of economic slowdown, China’s electricity generation often decelerated much more sharply than the overall economic growth.
China’s hydro electricity generation continues to surge and grew by 17% in the first quarter from the same quarterly last year. As a result, fossil fuels electricity generation fell by 3.7% from a year ago.
Separately, China’s coal production fell by 3.5% in the first quarter from the same quarter last year. China’s coal industrya asssociation now plans to reduce the annual production in 2015 by 5% from last year.
Given these trends, it is highly likely that in 2015, both China’s coal consumtion and carbon dioxide emissions will decline.
This will certainly help the world by some time from climate stabilization. Although I do not expect the trend to be sustained.
I think China (and the world) is in for a major economic crisis in the next 5 years.
I agree
In the first quarter, China’s crude oil imports reached 80.34 million tons, an increase by 7.5% from the same quarter last year
Ya, and why is coal production meaningful when they can just import more of it and keep theirs for their grandchildren.
This will certainly help the world by some time from climate stabilization. Although I do not expect the trend to be sustained.
Given that based on the information you cited it is highly likely that China’s economy is not growing at the roughly 7% that is supposedly their official growth rate. (Actually I personally believe that number is a complete fiction), Taken together with your cite that their electricity generation might even indicate a significant slow down. Plus the fact that you agree with Anonymous’ statement below that China and the world are likely are heading for a major economic crisis in the next five years, why, pray, do you not expect this trend to continue?!
Sounds like there may be a bit of a contradiction in there. No?
There is no contradiction between the expectation that the Chinese economy may enter into a major crisis in the next five years and the expectation that China’s coal consumption and CO2 emissions will resume growth in the long run.
If you read my post carefully, you may realize that a big factor that contributes to the decline of fossil fuels power generation has to do with the near 20% growth of hydro electricity
PE,
Could you provide the raw numbers? Number of GWhs for coal, hydro, etc?
If you read my post carefully, you may realize that a big factor that contributes to the decline of fossil fuels power generation has to do with the near 20% growth of hydro electricity
My bad I had read your post as saying that coal use would continue to increase…
The invisible hand at work.
http://www.reuters.com/article/2015/04/14/us-markets-oil-idUSKBN0N502O20150414
It looks like the Bakken is not the only place where the oil companies do not see the merit of completing their wells. The Eagles Ford, is also leaving wells uncompleted. With fast decline rate, dropping rig count and the lack of interest in completing wells, it is hard to believe that current production levels can be held. But read the article and you will see how it can be done.
http://press.ihs.com/press-release/uncompleted-wells-eagle-ford-shale/large-inventory-drilled-uncompleted-wells-pose-oppo
Large Inventory of Drilled but Uncompleted Wells Pose Opportunities for Handful of U.S. E&P Operators with Quality Assets; Challenges for Those Without, IHS Says
BHP Billiton, Chesapeake, Anadarko, EOG Resources, ConocoPhillips and Pioneer Resources Own Nearly 40 Percent of Optimal DUC Wells in Eagle Ford
It seems for the companies that have the cash, they do not need to bother completing their wells.
Of course the other reason, they are not completing, is because the refiners don’t like their flavour of near oil?
Warning: IHS article. Please remove rose tinted glasses after reading!
So, how long can they leave wells uncompleted for, isn’t it a year? So either prices stay low for a year, and many of these wells will have to be completed and will keep oversupplying the market, or prices edge back up and suddenly there’s a boom in completions in response, and production could potentially surge again, keeping the price suppressed.
There seems to be an assumption by the MSM that all the frack log wells can be completed on the same day, which of course, is impossible.
For starters, I wonder what the frack companies did with their personnel?
Watcher would like that IHS article, which makes the claim that break even is now under $30 for frack log wells. Why is it so low? Because of course we no longer have to consider how much the well cost to drill, that money has already been spent.
But what about payment of the interest and principal on each of those $3-4 million dollar holes that are generating no revenue. Until completed, they are the economic equivalent of a duster.
Heck, we can break even at under $10 I guess. We can just apparently ignore whatever expenses we like.
I usually don’t equate a partially completed building with financial success. That is what frack log looks like to me.
Sam,
Certainly in ND, it is a year before they need to complete a well. Not sure of the regs are in Texas, but this doesn’t mean that at the end of the year they all need to be completed in a rush.
The completions can be rotated around, until the point is reached where the only wells that are completed are one year old. It would be at that point where the panic to complete may set. By this time, and at the rate the drilling count is dropping, the only wells to complete will be older ones.
Maybe a slight exaggeration, but I hope you get my point.
I did an analysis a few weeks ago, concluded it´s feasible to wait three years. The IHS report states:
“””“In this low oil-price environment, operators in the Eagle Ford and other U.S. shale plays are focused on optimizing the value of their assets and managing their costs, and these drilled, but uncompleted wells enable them to do that more effectively for several reasons,” said Raoul LeBlanc, senior director of research at IHS Energy, and the lead author of the DUC analysis. “First, the drilling costs of these wells were already incurred by operators prior to 2015, and the completion costs–which comprise the majority of well costs–can be negotiated at a cheaper rate since completion crews are now both available and available at cheaper rates. Second, if completion costs are fairly consistent in the play, then it stands to reason that wells with higher production will yield better returns on capital.””””
When I wrote here my conclusion, I met a little bit of resistance, but the numbers are fairly easy to work out, you just have to take the time to put it in a spreadsheet.
Fernando. I agree with you, if you can predict with some certainty the future oil prices. I don’t think it works based merely on current contango. You will need a substantial increase.
Do you know the life assigned to tangible leasehold equipment and depreciation method utilized by public oil companies? Is this standard across the industry, or does this vary?
Also, do you know how public oil companies calculate cost depletion?
I wonder how frack log wells are handled for tax purposes?
I guess my concern if I were building up an inventory of drilled but not completed wells is the cash crunch that would result not only from the lack of income from those wells but the income tax ramifications.
It is my understanding that the well cannot be considered to be placed in service for depreciation and depletion purposes until it has been completed and placed into production.
It would seem to me an oil producer would require a significant amount of cash on hand to keep drilling wells but not complete them. Not only would there be $0 revenue from them, but the money expended on them could not be taken as a deduction either.
As I look at shale drillers like WLL, CLR, etc, I find that most do not have significant cash.
It seems to be a questionable lending practice to loan funds to drill wells that will only be completed at a date when hopefully the oil price rises, and that cannot even be expensed until completed.
Also, what category do the reserves of these types of wells fall under?
No wonder KSA is perplexed. They under estimated the ability of Americans to continue to dodge the financial day of reckoning. They should have learned something from the 2008-2009 financial crisis.
I’m not sure about current U.S. Tax rules, but overseas we lump all drilling and completion CAPEX in an account (it’s not on a per well basis). If the well is considered good enough to case and put on a schedule to eventually be completed, we book it as CAPEX. If eventually we complete and it doesn’t produce we write it off.
I don’t think the tax implications are that important. The gain in present value from waiting is pretty big. Remember, what I think about prices doesn’t matter. What matters is whether somebody is willing to offer to buy the oil at a higher price.
Fernando. I took a look at the IRS rules for when an oil and/or gas well is considered to be placed in service. It appears to me to be placed into service, the well must be completed.
I understand you experience is in planning for well capitalized IOC’s. Many US unconventional independents are not in the same cash situation.
From what I can tell, the US companies write off tangible leasehold equipment using MACRS with a seven year life. However, this cannot commence until the well is completed. Further, no cost depletion may commence until the well is placed into service.
So, if your company borrows the money to drill the wells, as has been the situation with a large percentage of US lower 48 onshore, your company would go three years with a. Interest expense on the sums borrowed to drill; b. Would have no revenue to offset the interest expense; and c. Would have no depreciation deduction from the uncompleted wells to offset against net income from other producing wells or other income generated.
In my view, only a well capitalized company with substantial income from other assets could pull this off on a large scale, or even moderate basis.
This is notwithstanding issues with the oil and gas lease terms and/or state regulations.
Most of the frack log companies will not wait long, and are praying for a significant price increase this year, IMO.
Or they will farm out acreage to companies with cash. Don’t forget many oil companies are buying their own stock.
Returning to the tax issue, let’s say I borrow $4 million at 10 %. I pay $400k in interest, net cost is $256k per year after taxes. Say I hold the well for TWO years, but arrange to drop the remaining $4 mm completion and other costs by 20 %, that saves me $800k.
If I complete the well today I have to pay the same $7.2 million (I assume the costs will drop) but the well PV10 is much lower. The key to the whole issue becomes staying power. But a company which lacks the financing will sell to those who have cash.
I think this is the argument companies use to issue stock. And it wouldn’t surprise me if some banks may not be carrying them through this period.
I guess we will just have to wait. But the more contango we see the more oil will be stored, and the more we will see delayed completions.
Hi Shallow sands,
When a company has no profits, it pays no taxes, so the tax write off issue is not that big a deal. A lot of these companies are just weathering the storm and trying to keep their losses to a minimum, their tax bills will not be large. The depreciation issue may not be a problem, though I am not an accountant and am probably missing some major points.
Dennis. Good point! As I have stated before, IMO shale company earnings are overstated because I believe their depreciation and depletion deductions are taken at a rate which is much less than the decline their wells experience. As they cut CAPEX, this effect will eventually wear away and may even understate earnings, depending on the level if future CAPEX.
However, crude prices were so low in the first quarter that there would be no taxable income for most of the companies. That may very well be the case in future quarters too, although there may be a significant price rally in the works.
However, crude prices were so low in the first quarter that there would be no taxable income for most of the companies.
Sometimes they even find ways to reclaim taxes they have already paid.
Noble gets a $7.8 million reduction in its 2012 Weld County tax bill – The Denver Post
Here’s a better article about the tax payback.
Weld commissioners approve $7.8M tax abatement for Noble Energy – BizWest
The Greeley Tribune reports that the approval was unanimous. Noble had originally paid $73,307,779.47, but received an abatement of $7,783,166.32. The request came after the company revised its 2012 tax filing and found more expenses that could have been deducted.
The county government will be on the hook to pay back more than $2.3 million, while Aims Community College will have to repay more than $854,000 and the school district in Kersey nearly $510,000.
The abatement comes just a week after the company announced it was cutting 20 workers in Greeley and another 80 in Denver.
Gooood morning, slaves…
And welcome to a fresh sedition of ‘It’s The End Of The World As We Know It And I Feel Fine‘. Which focuses on my old stomping grounds (Montreal).
Always the perfect little show to watch over one’s morning coffee/tea. Or juice. So go grab one, sit back, relax and enjoy!
Oh, yes, almost forgot… Fred, there are distinct differences between ‘literary devices’ and internal states, tabarnak! Which is not to suggest that the two are mutually exclusive, but nor should they necessarily be. Because, for three, there is energy, passion and conviction. And sedition. Vive les differences! ‘u^
Bonne journee!
Caelan, “capitalism” has evolved into something like hyper-financialized rentier-socialism for the top 0.001-1%, most of whom in the upper strata of that lofty lot are invisible, unreachable, unaccountable, and untouchable.
In the US, total annual net flows to the financial sector now absorb virtually 100% of annual value-added output of the economy. The vast majority of the associated rentier claims go to the top 0.001-1% and to a lesser extent, and indirectly, to the next 5-9%.
I suspect we’re going to have to see a growing majority of those beneath the top 0.001% in the technocratic and political castes get the glitter treatment that Draghi received earlier today before there is recognition among the Power Elite top 0.001% and their facilitator technocrats and politicians that the bottom 90% are suffering, only so far in relative silence.
I’m waiting for a protester to fling bats$&t on someone to prove the larger point.
Then again, public acts of disobedience and glittering high-profile gov’t, corporate, and media types will probably only permit the top 0.001% and the state to rationalize violence against the masses.
Looks like oil prices will continue to fall for a while yet, with this massive oil field found just off England. We should use the lower cost of construction to invest heavily in alternatives. There will be a place in the worlds economy for a long time to come, but we should work now to lessen our dependence on it.
Which huge field found off England?
No massive oil field found “off” England. A modest sized oil field possibly has been found in England, not off, that will take years to develop if it proves to be worth exploiting. Only 10% to 15% of the oil that may be there can be got out of the ground. There is no salvation for the world from oil scarcity offered by the “massive oil field found off England”.
Got it, the Kimmeridge shale play by Heathrow. The good thing about it is the ability to go downtown by train once we finish fracking at 5 pm.
Many are expecting the same ‘bats#&t crazy’ system that got us into this mess to get them out. Secondly, that system are we. But who are we?
There may be a wild card, and I have been falling behind in making the effort at helping to create it and/or move it along. It is one thing to describe a system, and yet another to transcend it.
A reformist solution is far in the rear view mirror at this point.
But the feedback loops are immense.
I presume when you say ‘reformist’ that you are talking about reforming a system that I think is unreformable and that you understand that that’s not what I am advocating at all. And I am inclined to agree if that’s what you mean– that it’s too late to do what the likes of Nick or Dennis seem to think. Even if it does reform, if the ethics are not reformed as well, then it’s new incarnation will likely be at best, just a kinder, gentler, more polite and diplomatic version of unethical.
And we do appreciate folks who are polite and diplomatic, but fundamental @%#holes, don’t we.
Correct.
Thinking that reforming a system that is not reformable is pure delusion, sort of like the Austrians in 1914 arguing who their next Habsburg Ruler is going to be.
A alternative social construct that would work and that people agree on would be nice. Then we know what we are aiming for.
Do you agree that there have been times when radically altering the social system has had relatively poor results?
This has not always been the case, but is the reason that some prefer incremental change rather than revolutionary change.
Oil futures are hoovering at 54.00 this morning. Close at 55.00 opens the door to 67.00 If you want to be precisely technical, oil need to close above 54.25. I say 55.00 cause that shows a clear break in resistance. Still possibility of pullback still remains until this resistance is broken.
I should add that once this resistance is overcome. 55.00 will become strong support going forward.
That’s probably how it is going to unfold, (save for one or more wild cards, like the world’s first global tribe rising up to challenge the world’s last global state system).
Because it’s ‘what we know’. It’s comfortable in a way and too inconvenient to leave. Like a bad relationship that you tweak to cope with (ya, I am being cheated on, but I’ll look the other way, maybe take a new hobby; ya, I’m being abused, but maybe if I be even more accommodating, I’ll get less of it), until it destroys you in the end by a death of a thousand cuts.
Doesn’t matter that it’s violent/coercive/undemocratic, and is what makes it fundamentally self-defeating. Because it’s an outgrowth or emergent property of us, maybe with lots of cheap energy thrown in.
Of course I keep talking about pure democracy and ethics, but that doesn’t seem to matter; what seems to count is the ‘grand illusion’, the overriding unethical/undemocratic politic-uneconomic prison system, that we’re all embedded in from birth, and its self-reinforcing/self-relevant political/etc. narratives/memes, such as of statistics like the GDP; organizations like The World Bank and International Monetary Fund; borders arbitrarily carving up the planet, like the US or Russia, and their government/operational structures, and industrials, like solar panels and electric vehicles. So that’s what we’re going to get, not just until collapse, but collapse precisely because of it. Unless the wild card, but it might come too late.
Time to refill the meds, Tribe. It is getting beyond the pale.
Stick it, Paulo. And your nanny bonnet. My comment is highly relevant to peak oil and you know it. How about this one of yours? Nothing. This whole culture is a giant med-in-need and we uphold it and suck up to it and I’ll call it out. And ya, it will piss a lot of people off. Like the ones in the oil field or advocating EV’s and PV’s. Like on this blog. But that’s expected. Some changes don’t happen otherwise. If you want to talk about this sick joke of a culture in your way, I can talk about it in mine. I think it’s called freedom. Like that image I posted that you liked and commented on. My med to it.
Good morning Caelan,
Lots of days I am as doomerish as you are but today the indescribable new green is climbing the mountain sides and the ( scarce ) bees are in the apple tree blossoms. The grass is a foot tall already. Maybe things will hold together for a while yet.
Mother Nature will take care of her own by taking care of the problem – We have met the enemy and they is us. For damned sure this is one of the truest things ever said.
I don’t know how deep the coming collapse may be. My opinion is that it will be near total in some spots dependent on imported food and fuel but that it will be partial in other places such as some places in south east Asia where subsistence agriculture is still widely practiced.
There will be droughts and famines and floods but such disasters have not yet ever killed EVERYBODY in any given area and the survivors will repopulate the area and life there will continue on about as it has in the past assuming the climate cooperates to some extent.
The big wheel turns slowly in human terms but it DOES turn.
Now there ARE actually some new things under the sun in terms of human behaviors although I am a firm believer in the old biblical quote about there being nothing new in terms of our behaviors.Just about every rule has exceptions which are the proof of it.
The exception in the case of naked apes is that we HAVE learned to work together in enormously large groups-although as you point out the leaders of these groups are not role models you and I would choose for our own kids.
Nevertheless people organized into modern nation states ARE capable – once a crisis is obvious to the general population – of acting in concert to do things that would have been utterly impossible only a hundred years ago.
Half of what we WILL do as nations may well be wrong and bring about more trouble than cure but some progress towards a cleaner safer saner sustainable world IS being made.
I will not argue that such progress is happening faster than the ongoing destruction. It is not by a factor of a hundred at least.
But nevertheless there is a significant chance that a portion of humanity will survive and maybe even eventually create a new society incorporating most of the things you (and I ) think are most important.
If not the sun is eventually going to expand and vaporize us and everything else anyway.
The ”problem ” with nature is that she does not deal in ” values” or ” eternal truths” or ethics. She is incapable of giving a tinkers damn about any thing.She is totally indifferent as to who or what survives – or does not.
The nature that created parasitic wasps that eat their victims alive from the inside out would laugh -if sentiment and capable of laughing- at the plight of a starving child.
The inescapable bottom line is that the world is TRULY a totally Darwinian place. The only hope we have , such as it is, is that Darwinism has created the means for some of us to escape the consequences of our Darwinian nature.
The irony !
SOME of us MAY work together to save ourselves from the CONSEQUENCES of working together in the past to create the business as usual world. IF we do , it won’t be a pretty process. The survivors are going to show about as much empathy for the losers as the wasp shows for its food supply.
Maybe.
And maybe ten thousand or fifty thousand years from now an aborigine sort of guy will be digging a pit trap where my farm is now and find a stainless steel butcher knife or an oven proof ceramic bowl and spend the rest of his life pondering the origins of such treasures.
Hi old farmer mac,
I disagree with the ‘doomerish’ description/pigeonhole, since I am advocating ethics, ‘earthiness’, simplicity and real democracy, and getting out of the doom that is this culture, while many, including hereon (increasingly unlike what I am used to on TOD) are still working within its tenets, while advocating things that also work within and depend on its tenets without a proper accounting of their contexts and unintended consequences. I am happy to critique that and include some context. Especially since it can impinge on my own well-being and the well being of everything/everyone else.
I too notice the birds and the blossoms and ‘stop to smell the roses’. That’s part of the whole point! For example, I noticed just this morning, over my own coffee, how, in the back yard where there’s some grass that is finally uncovered by the snow, a robin rather energetically and amusingly flips over leaves and assorted detritous to get at the edible stuff. Where are you located again? Virginia? Over here in Nova Scotia we still have snow-cover, unusually late for the season. Same time two years ago, it felt like summer.
As for collapse, it doesn’t have to be. So I am with Nick or Dennis for example on that, if you can believe it. But my attitude about how to go about it is to severely limit as much as possible using the system that got us here in the first place, since, in part, it appears like it will give us the very opposite of what many, including myself, are wanting– a smooth transition. Why do you think I am with permaculture and the Transition movements? Anyone else here into those? There’s very little hereon and elsewhere about those and what they also advocate, which includes real democracy and ethics. You can’t have a feasible, meaningful, permanent society without them! And that is where we’re at: A vapid, empty, asinine, infantilistic, doom culture. Solar panels made by wage slaves on your house, EV’s made with pollution in your driveway in a vapid, empty, asinine, infantilistic doom culture.
As for climate change, well, I have heard that if we as a collective species start amassing to plant a LOT of trees and vegetation native to our locales, that it could offset a lot of carbon and warming. But of course in this doom culture, it’s not happening, precisely because it is a doom/undemocratic/unethical culture. Meanwhile the narratives and memes of this culture continue to be promulgated and salient: Government utilities/nuclear/hydro/windfarms/PV farms; the grid; the wage-slave job; more private property for those with more money; central planning; large-scale infrastructure, etc…. It’s the wrong way to go!
There may be wild cards in terms of where we are in history, since in part it seems there is no real precedent for it. So it’s unpredictable, but at the same time, we can create the right conditions for what we want as well. That’s optimistic. But ‘selling the system as the solution’ seems fundamentally pessimistic/defeatist to me, even nihilist.
Looking to the crony-capitalst plutarchy to arrive at solutions for us that work and at this late stage of the game strikes me as terribly-willful ignorance approaching stupidity, and a contradiction both in the context of peak oil/energy and its own demonstrated history of failure after failure.
In that case, ‘Leviathan’ is going to eat itself for the last supper.
Yes and no. She does so through/as us. And then of course, articles online appear that talk about how climate change is a moral/ethical issue. Why should climate change be a moral issue?
Sure, but it is comparing us to different animals and at their levels of scale. I read somewhere that some arthropods have limited nervous systems for example.
The internet is an extension in a way of our nervous system by the way. Maybe that’s a curse as well. Maybe being poisoned and then having the juices sucked out of the body by a spider ain’t so bad. Perhaps it has psychotropic effects on the bugs-in-question, rather like how our brains can emit powerful pain-killers in times of injury.
Yes, maybe. On the other hand, our society often tells us what to think about ourselves and can make us believe we are more competitive than cooperative.
With each new generation, every new baby, the reset button is pushed, memory wiped.
Hi Caelan,
I agree that more democracy and ethical behavior is a good thing. I think permaculture is a great idea, but I am not sure that it scales very well to 7 or 8 billion people. Local government and trying to support local businesses and be self supporting may work when World population declines to 1 billion or less, but in my view we need to find a way to get from here to there.
There is also the problem that everyone does not agree on the destination.
So some advocate incremental change in the existing system, say shorter work weeks, higher minimum wages, a more progressive tax code, national health care, and higher taxation on externalities.
Such policies are unlikely to be enacted because many consider them too radical, my guess is that you would not consider them nearly radical enough (probably not even close).
The other problem is that at times in the past, radical movements to effect positive change have resulted in highly coercive and undemocratic social systems.
I agree that the present social structure in the US and Canada (which I am less familiar with) are far from perfect, my suggestion is simply that reforming and improving the current system seems a better approach than a very radical transformation. In fat the peak in fossil fuels will undoubtedly cause a radical transformation of the current system, I think that we will be hard pressed to handle that transition. Maybe it will be a step towards what you envision.
Victory is pretty much always ethical.
Nothing scales for 7-8 Billion humans. Along with my comment below to Caelan about communication/cooperation, that’s the main reason I don’t see a smooth descent/transition. We’re in the midst of the 6th great mass extinction (and we’re far more reliant on a healthy ecosystem than almost anyone is aware or acknowledges), we’ve kicked abrupt climate change into action, and we’re about to hit the peak of FF, and are already past peak per capita net available energy. We will get down to a billion or less humans, there just isn’t any other option. Hard/soft, fast/slow, forced/planned, smooth/chaotic – those are just details.
Why do you think I am with permaculture and the Transition movements? Anyone else here into those?
I follow the discussions, but I am currently living in a tiny condo without any land of my own. Nor do I plan to relocate right now.
What makes no sense to me is that you’ve gotten snarky with me. If you are inclined to insult potential allies, and particularly if you believe in democracy and participatory culture, you seem to be going about your beliefs in a strange way.
If you believe in democracy, you will likely have to learn to live with people who don’t think exactly like you do. Right now your tribe isn’t one I’d likely join.
What?! I have mentioned aspects of permaculture; my knowledge and foray into wild edibles/medicinals; my knitting and treehouse design with recycled materials; new politics/direct democracy/ethics; posted some pics of my stuff; etc., and after asking you what are you doing after you voice your brazen expectations for everyone else (but yourself apparently), you write something like ‘not enough to be of much use’. Have I got that more or less correct?
If so, my dear, if you had the slim chance of joining any tribe/alliance with that approach, you’d be bounced so fast, you would not touch the ground between your throne and the exit, never mind snark.
At least Nick G drives an EV. Is that right? Have I got that correct? No?
I am reminded of the saying about attracting more flies with honey than vinegar.
You have a very important message. Perhaps the most important message. I hear you.
However, there is a lot to be said about the manner the message is delivered.
I believe I am sympathetic to what you are saying but often I cringe with the way it is said.
Depends on the flies.
And if we have an entire culture of shit-consuming-flies whose material-of-consumption is about to hit the fan, then we have a problem. Honey might not work.
“In social psychology, the fundamental attribution error… is people’s tendency to place an undue emphasis on internal characteristics to explain someone else’s behavior in a given situation, rather than considering external factors. It does not explain interpretations of one’s own behavior, where situational factors are more easily recognized and can thus be taken into consideration. The flip side of this error is the actor–observer bias, in which people tend to overemphasize the role of a situation in their behaviors and underemphasize the role of their own personalities.” ~ Wikipedia
after asking you what are you doing after you voice your brazen expectations for everyone else (but yourself apparently),
What are you talking about? For one thing, I don’t expect to be around much longer. So what I do won’t matter in the greater scheme of things.
If so, my dear, if you had the slim chance of joining any tribe with that approach, you’d be bounced so fast, you would not touch the ground between your throne and the exit, never mind snark.
You’re making my point.
What exactly are you trying to say in this forum? Most of us don’t have a clue what you are talking about much of the time. Other times you seem to tell lots of people they aren’t getting what you want them to get. The folks I know who are practicing permaculture are nice. You aren’t, as far as I can tell.
And you seem to be on the computer a lot. Don’t you need to be out in the fields working on your permaculture? Or is this just a winter thing while you wait for the weather to warm up?
I won’t keep on about this, but I have learned virtually nothing about the finer points of permaculture and sustainable living from you. Quit trying to be clever and post something really useful.
I do have another thought. If we ran this group as a democracy and a majority of the people here suggested you change your conversational approach, would you?
Well take a look at your own approach:
Is this the kind of confrontational insulting ad-hom conversational approach you want us to aspire to? Looks like yet more hypocrisy.
I know only too well how to put down honey to attract flies, but is it worth my while?
This is my first sweater ever– a double-rib-pattern semi-turtleneck. It turned out beautifully, and I’m quite proud. The only problem, ironically, is that a cheap acrylic (fossil fuel sourced?) ‘capitalism’ yarn was used and it started falling apart (pilling, felting, ripping) very early on, so I am almost finished the process of fixing it with a better (hopefully) yarn.
This is one example of the race-to-the-bottom of our current system where things are deliberately made to fall apart more easily so they have to be replaced and/or upgraded and so become a cash-cow for industry. This is ultimately a drag on the planet and people and another ‘externality’ that has to be subsumed by Mother Earth.
Anyway, unless one is physically constrained in some way, knitting is one of the best crafts around for many different reasons, including its portability, as it can be done practically anywhere, such as in the bus or in one’s condo, in between the keyboard sessions.
It is a great skill to have during and post-decline/collapse.
Apparently in old Europe, men formed the majority of ‘knitting guilds’, although that went away with industry. Personally, learning it and doing it is kind of fun, but also a bit of a tooth-pull, and I would like to learn and do carpentry, but for now, knitting is ok. My next project is to learn how to knit gloves and socks.
Knitting I can relate to. I learned years ago from a PBS show. It’s also a great way to pass the time. Same with spinning yarn. It’s mentally therapeutic. And you can even use dog hair.
I also learned how to dye wool using natural dyes. Like I said, I loved the Whole Earth Catalog and it had all sorts of books on crafts like these. It was the defining publication of my adult life.
Good stuff! Well, have you mentioned this on here before? We can talk about that on here as part of the whole peak oil collapse thing, yes?
All the lifestyle stuff you advocate I can relate to. I am doing less of the Whole Earth Catalog types of activities than I used to because I have been living in a small condo without any land. However, I have relatives with land and they tell me I am free to do whatever I want in terms of gardening. In years past I baked my own bread, bought organic food in bulk, learned to knit, learned to weave, and so on. Never took the full plunge toward totally self-sufficiency, but I have always liked the idea.
What my lifestyle focus right now is to drive minimally and to downsize my possessions as much as possible. I don’t live as minimalist a lifestyle as I would like, but I keep making progress toward it. The less I have, the less I need to spend time taking care of.
I am interested in what others are doing toward end. I always have been. I loved books like The Owner Built Home and The Owner Built Homestead. I also bought many of the Rodale gardening books.
Ok, I just put the previous message as a placeholder as I had to step out. But we seem to have many things in common and perhaps over time hereon we can compare notes. Since I knit, I have fancied the idea of a project where I do a sweater all the way from shearing a sheep, to cleaning, carding, dying, spinning, and knitting it. There’s supposed to be an island over here where they have wild sheep that were descendants of settlers’ and I’ve joked about taking a boat over and seeing if we could catch one and shave it.
And your mention of those two last books makes me think of that Shelter book I was looking for online once to see if I could download, because of all the nice images.
This is who I learned to knit from. First from her PBS show. Then from her books. And finally from her newsletters.
Elizabeth Zimmermann – Wikipedia, the free encyclopedia
I’ve actually heard of her. How advanced are you in knitting? What have or can you knit and do you still knit? Or what do you prefer doing? Weaving? Do you have a loom? In one of Richard Heinberg’s videos, I noticed a loom behind him. I guess a loom is for making fabric for such things as pants and dress shirts, yes? Do you sew?
I used to own a knitting machine when I was 17 and bought it in the interest of creating a knitwear business, but at that age, the prolonged patience and interest required was just too much, so it was sold. Even now, it takes some doing.
Have you ever heard of Kaffe Fassett?
Oh, I stuck with circular knitting. I made a number of Norwegian style sweaters, with Norwegian style designs. The knitting itself was simple, nothing too fancy. It’s basically tubes that you then cut to attach sleeves. But you can incorporate all sorts of designs by using two or more colors.
That’s why I liked about Zimmerman. Her designs were technically simple but produced very nice results. I mean, I wasn’t particularly skilled, but I learned by watching a TV show and then following the instructions.
I also bought myself a huge floor loom. Imported from Sweden, I think. But then I realized I was happier working with a frame loom and sold the big one.
Like I said, I loved all the stuff I read about in The Whole Earth Catalog. I didn’t master the art of baking bread until I read about The Tassajara Bread Book.
That book broke down the process so well that once you “got” it, you could experiment with throwing in other ingredients. I’d make a bread using yeast, wheat flour, eggs, dried milk, honey, and sometimes other things. It was a traditional bread in that you let it rise several times before baking, but it was far from empty calories.
I made my own granola, too, but that didn’t require a recipe. It was just mixing in whatever ingredients you wanted to include. I also tried making my own yoghurt until I made a bad batch. Oh, that was nasty.
There was so much more I was interested in, but didn’t fully try or never tried at all. I wanted to build a ferro-cement boat, but couldn’t get the welding down. Wanted to do more with geodesic domes and passive solar. Never dried fruits and vegetables in bulk.
Fun times, though. I loved it.
Have you ever heard of Kaffe Fassett?
No, I don’t believe that I have.
Glad to see this thread (yarn?) come to some conciliation. Been a fan of your thoughts, Caelan, since you were ToPFM at TOD. I mostly keep my head down, both here and in real life. I live in an intentional community, and have first-hand experience of how difficult it is for folks to communicate and cooperate, even with stated common goals. Differences have a way of surfacing and muscling all else aside. It’s just one more reason I hold out little hope for a smooth transition. My own interests lie in the very (not ultra) low energy realm. We do drive a plug-in hybrid (converted Prius), and have PV not yet installed. But my main thing is passive use of the sun – for hot water, heating, cooking, and, of course, growing. I’m in VA a hundred miles or so north of OFM along the Blue Ridge, and my goal is to only have to burn wood on the dozen coldest nights, and to not need any back-up for water-heating or cooking. Ways to go, but achievable.
But my main thing is passive use of the sun – for hot water, heating, cooking, and, of course, growing.
Back in the Whole Earth Catalog days (1969 and early 1970s) that’s what people were exploring. There’s so much people can do with passive solar that most of us haven’t done yet.
http://builditsolar.com/index.htm
The Bakken Formation: How Much Will It Help?
Conclusion numero tres:
“3. Because of the highly variable nature of shale reservoirs, the characteristics of the historical Bakken production, and the fact that per-well rates seem to have peaked, it seems unlikely that total Bakken production will exceed 2x to 3x current rate of 75,000 BOPD.”
Somebody got it wrong, all wrong.
Oh well, can’t be right all of the time.
Hard to get anything right when everything’s wrong.
You’re kind of a radical anarchist, a kinder and gentler one, I think.
Here’s some music from the Fugs:
CIA Man
Hi Ronald, thanks for sharing. Not bad. We are all anarchists when you think about it. Some just don’t realize it.
Unless you’ve lived all your life in some isolated backwater town, I think most of us do.
I meant more along the lines of being a teacher, instructor, trainer and manager of large teams of people with very diverse backgrounds who had to overcome all kinds of biases and cultural and linguistic differences to be able to work together to accomplish specific goals…
I imagine you did, yes. But that’s just another context of doing so, and maybe in some cases or ways, a bit of an ‘artificial’, ‘contrived’ and/or ‘authority’-based and limited context to boot.
I was talking to you as I might to an equal, a colleague, or a friend. There was nothing contrived about it.
That’s fine, Fred, but I was also referring to your previous ‘teacher, instructor, trainer and manager’ framing, which seemed to shift the mood or context between us to one vaguely patronizing.
Again, there are a multitude of ways to intermingle with people of varied backgrounds outside of the ‘teacher, instructor, trainer and manager’ contexts. I have found that people everywhere are basically the same anyway, so if one is without the experience, it seems to matter little.
The latest EIA Annual Energy Outlook projects that the US crude oil production will peak in 2020 and then stay on a high plateau through 2040.
Hi Political Economist,
The peak year sounds about right, but remaining at that level for 20 years is highly unlikely.
Elsewhere you expressed that you expect a downturn in China, many predict a collapse, is that your expectation or just slower economic growth? Do you think that there is a significant real estate bubble that will cause a financial crisis in China? Thanks.
Also you mentioned Chinese coal output is falling, so perhaps Chinese output is close to peak. Has Chinese coal consumption continued to grow or has consumption been relatively flat?
Dennis, China’s coal consumption has declined too. I think China’s coal production clearly reached a near term peak in 2012. The coal production was down 2.5% last year and if it declines again by 5% this year, then 2012 would clearly be the near term peak. But I think it would be too early too conclude that China’s coal production has permanently peaked.
The Chinese economy is highly indebted and imbalanced. But until a collapse of investment actually happens I do not want to predict imminent financial crisis. However, the chance of a major economic crisis within the next five years will be high.
I watch closely China’s economy-wide profit rate. I measure and calculate it myself. Historically, there was a threshold of the profit rate below which the US economy had invariably fallen into major structural crisis. Until recently, China’s economy-wide profit rate was about twice as high as the US level. Now it has fallen to about the same level as the US. I’ll give it a few more years for it to fall below the threshold.
China’s major crisis might coincide with the global peak oil. If the world oil production peaks, say, around 2020, followed by another oil price surge, that may turn out to be the trigger.
In the short run, the Chinese government should be able to respond to the crisis by massive increase in fiscal deficits, followed by prolonged economic stagnation. If the oil price resumes rising, China’s economic stanation may become stagflation and social intability may begin to intensify.
Historically, there was a threshold of the profit rate below which the US economy had invariably fallen into major structural crisis.
Could you expand on that, with numbers and sources?
That will take a whole body of literature. But a new book of mine (China and the 21st century crisis) will talk about this. It will appear this fall.
You may want to check two of my older books. One is called The Rise of China and the Demise of the Capitalist World Economy. Chapter 3 and 5 are about profit rate and global economy. Chapter 7 is about ecological limits to growth. The book was published in 2009 so much of the data was dated.
A more updated one was published last year (Peak Oil, Climate Change, and the Limits to China’s Economic Growth). Chapter 7 discusses the Chinese economy in relation to the profit rate. But only hardcopy is available for this one and it’s kind of expensive
wow, you have had quite a journey.
Well, if you feel up to writing something in a few hundred words, that would be very interesting.
The Chinese economy is highly indebted and imbalanced.
China debt as % of GDP is about 31%.
US debt as % of GDP is 100%.
Why expect crisis there first? And if it’s somewhere else first, won’t they move to achieve victory over that enemy? Don’t have to throw nukes at the Gulf coast.
Just grab tankers headed to Japan, and maybe wipe out the Japan import facilities. Why imagine Chinese debt hits them before American debt hits?
Watcher when you speak of debt you need to define what kind of debt you are talking about, government debt or private debt. Then there is total government debt which includes state debt, municipal debt and federal government debt. Then there is the total of all debt combined.
So which debt is 100% of GDP?
Watcher,
China’s corporate debt is their issues it’s around 200% of their GDP. $1.1 trillion of it is denominated is US dollars. They can’t print the US dollars they need in order to service that debt. Thats why you should expect crisis there first.
Fed ends QE and China’s many popping bubbles is no coincidence. China is experiencing heavy out flows of capital as people are trying to service their US dollar debt.
So the only policy tool china has is interest rate cuts. Which compounds the problem of capital out flow. Capital out flows only increase at a exponential rate as a result.
China is truly in a no win situation. They have cut rates and will continue to cut rates. What you’ll get is an imploding economy and a stock market beyond the moon. Much like it is here.
And as to policy tools, try this one:
http://www.upi.com/Top_News/World-News/2015/04/15/China-accepts-57-founding-members-for-new-Asian-Infrastructure-Investment-Bank/6071429103735/
or this:
http://europe.chinadaily.com.cn/epaper/2015-03/06/content_19734119.htm
or this:
http://www.bloomberg.com/news/articles/2014-12-22/yuan-ruble-swap-shows-china-challenging-imf-as-emergency-lender
in short China is ramping up settlements in its own currency, stepping in as a lender of last resort, and leading the establishment of its own global banking institution. The US can sit on the sidelines but its staunchest allies are joining the party.
DuaneX,
China can do all the ramping up it wants it doesn’t have the dollars it needs and it can’t print them nor can it sell even half the US treasury bonds it owns without completely destroying it’s manufacturing base.
If you want to pay debt in this world. 65% of the debt in this world is denominated in US dollars 20% in euro’s the last 15% is denominated in all other currencies combined. In this world you need either US dollars or Euro’s to pay 85% of all loans that exists. Not yuan or rubles.
If a large portion of the debt thats denominated in dollar is settled or paid off. Thats very bullish US dollar. You don’t understand money. Otherwise you wouldn’t read too much into the hype surrounding the moves China and Russia are making.
I should add that if a large portion of the US denominated debt that exist is just simply defaulted on thats very dollar bullish as well. It has the same effect as canceling debt or paying debt off.
No, I’m not at all worried about China defaulting on its USD denominated debt.
To pin down some of the numbers you have stated, you believe Chinese corporate debt runs at 200% of GDP. That’s some $18 trillion plus. Of which, $1.1T is denominated in USD? Big deal.
Yes, the numbers out of RMB clearing are not huge, but they are growing and the trajectory is clear. So are the direct currency swaps China is negotiating with all its trading partners. Et tu, Canada? http://www.theglobeandmail.com/report-on-business/renminbi-trading-hub-to-streamline-canada-china-financial-services/article23588644/
Watcher, you probably have the official government debt in mind. China’s central government debt is indeed about 30% of GDP. When various local government debt and liabilities are added, it becomes 50-60% of GDP. But in addition, there is large business debt. So that China’s total non-financial debt now is about 200% of GDP
Hi Political Economist,
I would think that the Chinese government’s ability to intervene aggressively in the Chinese economy might make the dynamics a little different than the United States. Is the economic data for China reliable? I would think that there might be manipulation of some of the data for government owned companies so that analysis would be difficult, though you may have found a way to deal with problems of that sort.
Just a quick update of the graphs based on the latest NDIC data.
February was the first time since a long time that the number of wells spudded (136) was lower than the number of wells having first oil production (160). In March this difference will probably widen, as I only see 124 wells spudded for March. On average, there is about a 6 month period between spudding of a well, and first oil production.
.
I believe I am now seeing > 50% of NoDak production from wells less than 14 months old, given that this was a Feb report.
I look at graphs like these for the Bakken and EF and wonder how shale can be economic at any price less than $90-100 WTI for levered oil companies. 5 years to produce 200,000 barrels?!? How can they claim 600K EUR’s? I don’t think you need to be an oil expert to see the obvious.
Is it my eyes, or has the slope on the yellow/2014 production, got much steeper than the previous years?
Hi Enno,
EDIT: Ignore chart below, I made a mistake in my spreadsheet, sorry.
Thanks for that chart. Note that Enno’s chart is for all North Dakota Oil wells. I look at only North Dakota Bakken/Three Forks wells and get somewhat different results. For 2014 only Jan to Sept wells are included, from Oct to Dec there are many confidential wells which we can only guess as to whether they are Bakken/Three Forks wells or not (probably 95% to 99% of these wells completed from Oct 2014 to Dec 2014 were Bakken/Three Forks wells, but we do not know for sure.)
Hi Fernando,
You had asked about XTO (owned by Exxon) so I looked at wells that started producing between Jan 2014 and Feb 2015 for selected companies (916 wells total). Cumulative production profile for average first 12 month output for 6 different companies (I assumed all confidential wells were in the Bakken/Three Forks for this chart).
Dennis, the question in my mind is whether the EM wells may not be choked back a little more? This requires a comparison of the curves for EM versus others. What you said was a plot shows up as a sweater in my view.
Hi Fernando,
Exxon Mobil owns XTO. Chart is at
http://peakoilbarrel.com/north-dakota-bakken-february-production/comment-page-1/#comment-512425
A corrected chart for North Dakota Bakken/Three Forks wells.
In this chart I used all wells for 2014 (Jan to Dec) and assumed all confidential wells were in Bakken Three Forks.
The cumulative output is from the first month of production rather than the peak month (Enno’s method I believe), so the results are slightly different than Enno’s for 2014, also Enno uses all North Dakota wells where I use Bakken/Three Forks only (which is the reason that 2008 looks so different, there were relatively few Bakken/Three Forks wells in 2008 so the other North Dakota wells brought the average well profile much lower, in later years very few wells were completed in formations other than the Bakken/Three Forks so the effect is small.
FOR ALL,
First thanks to Enno for generously sharing his excellent charts.
When it comes to understanding future developments of Bakken it will ALL be about the financial dynamics.
How much money will the oil companies have available for well manufacturing?
The chart below is monthly estimates (black columns) of the cash flow for Bakken (ND) based upon the month over month changes of the number of producing wells as reported by NDIC.
Note, this number may be different from the number of new wells that had their first production during any month, but the total number of producing wells should be the same.
No matter what numbers are used and how the numbers are whipped around for confessions, they come up with negative cash flows for Dec-14, Jan-15 and Feb-15 and we are talking big numbers, like $100Ms.
So on aggregate companies in Bakken has recently spent more than their operating cash flow. This can only be done by the use of more credit/debt or other sources of outside funding.
So anyone who makes claims about companies holding back production waiting for higher prices ought to justify this and why it is justified to go deeper into debt while waiting for any rebound in the oil price.
This should also take into consideration that many wells have several owners with varying working interests (WI) and those policies would require some qualified majority among the owners for holding back production.
Hint 1, companies may be in quite different financial positions and therefore have opposing interests with regard to holding back production from producing wells.
Hint 2, predicting the future oil price will become increasingly difficult for several reasons, but doubling down and turning the oil industry into a casino may work.
Why not try, the answer will be known only after the fact.
Perhaps it is just human nature in search for predictability that searches and wishes for some signs of reassurance that BAU has not ended…….yet.
Almost $16 B in the red! May be the understatement of the day, but I don’t think they are going to ever get out of this hole.
That $16B total is an estimate, which probably is in the low end.
Which is why “the banks will waive the covenants” story is so shaky.
What have the banks got to gain by waiting longer for things to be deeper in the hole?
Watcher – this is getting old. Smart bankers can do whatever they think will maximize the bank’s well being. Having a calculator, and a forecast, they can do a NPV loan analysis. And, if that means waiving covenants, they will. Remember the real estate bust of 2008/2009? Probably not, since that was sooooooo long ago. Check out companies like Las Vegas Sands (Sheldon Adeleson). Sure real estate values plunged to almost nothing. But, surprise, surprise – they went back up as fast as they fell. But, hey, I am clueless, and I guess that you have a magic way of “seeing the future” with better clarity than the rest of us. And, I fully recognize that you might be right.
However, sometimes I get the feeling that you do not grasp the concept of banks. Banks have no money. Never had, never will. [They do not sell products – cars, houses, computers, etc. to get money.] They just “take” YOUR money. [“Your money” includes your parents’ CD’s, your checking account, your employer’s payroll account, college savings accounts, Christmas savings accounts, etc.] They have a fiduciary duty to conserve your money and to earn some money from it, so that they can at least give it back to you, hopefully with some modest amount of earnings. Have all of the banks, all of the time done a good job of that? NOT ONLY NO, BUT, HELL NO. And, regulations with oversight are always needed. But, they have a fiduciary responsibility not to sell at an absolute bottom. Many times, forcing someone into bankruptcy will guarantee the absolute worst outcome of a loan.
PS: Too big to fail? If they do fail -well, they do not lose any money. As I noted above, it is all YOUR money. And as far as FDIC insurance, YOU pay for it [the banks pay you less for the use of your money, in order to pay for the self-funded insurance of federally insured banks].
I can assure you the primary motivation behind what bank executives will choose to do is whatever will maximize their own bonus.
The revaluation of collateral just started will be a tricky part of that because it’s real and it is not maneuverable (unless the SEC provides guidance encouraging flexibility in that GAAP interpretation, and if they do then there is no need to waive covenants, the SEC will have waived them).
So the question is not what is best for the bank. It is what is best for executive bonuses. Seizing assets versus letting a company dig a deeper hole and have even less collateral by end of November may define a better bonus end of December. If so, that’s what they’ll do.
I would argue that at $16B we’ve gotten some of the best job production, resource outputs and general ROI for the economy than that of the many $16’s of $Bs that have been frittered away in the auto, housing or military escapades.
The US could easily QE this minor Bakken balance sheet inconvenience away and do the whole thing over again.
Rune, when I look at the potential options I simply assume I’m running a solid company with a prudent debt to equity ratio. In such a case it’s quite profitable to avoid completing wells. The typical approach is to avoid performing the hydraulic fracture and other CAPEX required to produce the well. If the company is short it can package the wells and sell an interest, and they find buyers. Or they can sell a special stock class, borrow from their rich uncles, or in some cases I would expect full company sales.
I suppose you have read the reports that operators are holding back wells and delaying completion work? This is what one would expect.
There’s another slightly different issue. A company can probably negotiate much lower prices for the work if it stops and then restarts using renegotiated contracts. It can also save some money on facilities, and possibly get a better market differential? If I am asked to look into this for a specific company I can probably do a full report in 2 weeks. But I’m retired, and I’m sure there are plenty of people who know how to wiggle through this tight spot.
Fernando,
”In such a case it’s quite profitable to avoid completing wells.”
That is a claim that needs to be backed up.
Why not defer all costs for the well, after all the drilling portion only takes about a month.
”I suppose you have read the reports that operators are holding back wells and delaying completion work?”
Yes, but I wonder what the real reason for this is. As shown as per February 15 the companies in Bakken(ND) was cash flow negative.
Several companies have drilling contracts that costs as much to get out of as to use the rigs to continue drilling until the contract expires.
I assume they have tubulars and other equipment, personnel, and want to have the data they take drilling the well? They have cash in hand? Search me. If I was starting from scratch I would do the minimum necessary. But if the well does get drilled then it’s better to wait. Let me prepare an analysis to see i f I can get in their heads.
Mr. Likvern can certainly make his own arguments but I would like to comment on this notion of deferring completion of shale wells.
If the argument is, as Mr. LeBlanc states up hole, that it makes sense to defer completion of previously drilled shale wells until such time as prices get higher, for better rates of return, that’s all well and good on a spread sheet. In the real world, however, those guys are up to their eyeballs in debt and needing all the cash flow they can get. I think the biggest of the big might be able to defer some completions and they are. Most can’t. To do so they would need to have enormous cash reserves, which they don’t, or feel confident that in a year they can borrow more money to complete those wells, on top of the debt they have now. Good luck with that. As to Mr. LeBlanc’s contentions regarding better completion cost rates, the only component to shale well completions that might be subject to contracts would be dedicated frac spreads. Break those contracts, pay the penalties, just like drilling rigs. All other completion costs are hired, or bought on an as needed basis and subject to the open market anyway. That’s a poor reason for deferring completions and I don’t buy it.
As to drilling new wells, now, at 3 mil a pop, and sitting on them for 3 years until prices go to 80 dollars again, that is not going to happen. Period.
Debt is a scary thing, boys. Close your eyes, take a deep breath, and imagine owing 4 billion dollars. Imagine your product prices just got slashed 50% and you have had no net income to speak of since last November. Imagine that you are now off the drilling treadmill, cold turkey and NOT replacing reserves that are being depleted from your inventory. That is to say that you are in complete liquidation. There are now people in black SUV’s with dark windows following you when you leave the office. A drone flies over your house now and then. Personally, I think these shale guys are scarred to death. I don’t think they are choking wells back, or deferring too much of anything except maybe jumping off a tall building with no parachute.
Respectfully, Mr. Leanme. If you are as smart as I think you are you would NOT be starting from scratch right now, particularly in the LTO business in America. You would be stuffing your money in drawers with your skivvies and staying completely away from LTO business. It barely worked at 90 dollar oil, it is not working now at 50 dollars, for anybody.
Mike
Hi Mike,
Thanks for your insights.
What do you see or hear in the Eagle Ford play. The story you tell would seem to indicate that these oil companies should be drilling and completing wells as fast as possible.
I do not have the vast knowledge of the oil industry that either you, Rune, or Fernando have, I am trying to reconcile different points of view in my mind.
It seems the question becomes, how best to survive at the current oil price level. In order to drill more wells or to frack wells that have been drilled costs money and these companies are cash flow strapped. Am I correct in interpreting your comment that nobody is going to be choking back wells, they will produce the oil as fast as possible to generate cash?
If debt is not the friend of these companies, would they defer fracking wells because the cash generated by the new well will not offset the increased debt load etc.?
I can understand producing existing wells as fast as possible, but at these prices I would think many companies would cease drilling and stack the rigs. I would also think there would be an increase in the number of drilled wells waiting to be fracked.
All of this fits what seems to be happening in North Dakota.
Are things different in Texas?
In the Eagle Ford about 320 wells were added to the wells on the oil schedule in Jan and Feb (about 160 wells per month), in March it was 132 new wells added. In Dec 2014 240 new oil wells were added to the Eagle Ford play, so things seem to be slowing down considerably.
I don’t have very good data for the Permian basin, but MBP has indicated that activity is slower in the Permian as well.
Also I had the idea that maybe the best prospects would not be completed, waiting for higher prices, clearly that is totally wrong, only the best performing areas would be completed as that would maximize cash flow.
I have worked on projects which required pre drilling prior to eventual construction of a large pipeline. The typical solution is to pick the better spots but we also delineated the acreage placing wells in strategic locations.
I realize Mike thinks the little companies which carry a lot of debt won’t wait. And I think that’s what we are observing. Some wells get completed, some get deferred. So it’s not an on off switch which applies to the whole industry.
Regarding my use of spreadsheets to study options, I got the sense everybody does it. I’m just doing what I did for decades.
Fernando, I appreciate that you have worked for big companies and your insights into that. I hope you appreciate that I have never worked for a big company, ever, and the only money I spend is my money. None of it borrowed. When I have board meetings its just me and the dog.
As much as I like to think I offer some practical insight into how the oil industry works the truth of the matter is the shale industry is not the oil business I grew up in, and succeeded in. You probably understand the shale business and all the knuckleheads that run those companies better than I do.
Some wells will get completed and some won’t; we agree on that. Different strokes for different folks.
Mike
You Mike, pls document the dog’s input.
Thanx.
Edit, 2 minutes ago I replied to a post near the end and the reply went all the way to the end. I wonder if it’s the embedded vids.
Thanks Fernando. Did you see my chart on XTO?
At link below:
http://peakoilbarrel.com/north-dakota-bakken-february-production/comment-page-1/#comment-512425
Dennis, I wrote a comment about it above.
Dennis, I don’t think debt is ever anybody’s friend so perhaps you are asking the wrong fella. I own and operate a lot of wells and have non operated interest in lots of other wells. I don’t owe a nickel on any of it. Half my well inventory is down right now, voluntarily. My drilling budget for this year is higher than it was last year, all of that because I have no debt. I don’t know how the shale oil industry is going to get itself out the pickle that it’s in because I would have never gotten myself into that pickle to begin with. I think the answer you want is entirely in the hands of the money people right now. The shale industry has no control of its own destiny anymore, IMO. Maybe a handful of the biggest will survive, that’s it.
They are stacking rigs in S. Texas like cord wood. We have only begun to see how bad that is going to get…
http://api.ning.com/files/qk*MmDQsK7qb6306Kf4E-ctMcax0c0ZEu6PMDGc3f3UmaSTegLsIyA4upD9V0p0*RQnLL9TxWLyeGuWYEkSsigjt86XDS6ij/CHK21.JPG
I will leave it up to you to imagine what LTO production is going to look like by August.
I am sorry I cannot be of more help, Dennis. The oil and natural gas industry is a very fluid environment; its hard to predict. I have seen oil prices jump 20 dollars in one week. There is a lot of very bad things going on in the ME right now that people don’t even seem interested in that could essentially change everything overnight.
Mike
Mike, I have that graphic in tomorrow’s post. But I think I will leave it in. Perhaps we will get a few comments on ti.
Ron, sorry to mess you up; its significant, I think, from the standpoint CHK is # 2 or #3 in the EF in terms of previous activity. At one time it had 33 rigs running in the EF.
Not a problem Mike. I think it is significant also. That is a huge drop in rigs. Leaves them just a token player in Eagle Ford.
Hi Mike,
I thought that was very helpful, thank you.
I always appreciate learning from a pro.
Mike. Your last sentence is something I have been thinking about also. There is a huge chunk of the worlds oil and gas reserves located in a relatively small area bordering the Persian Gulf and chaos in more than one area near there. I’m surprised that most appear to believe those oil rich areas are untouchable.
And before any of you get the wrong idea, a problem like I have described is the last thing I want to see. There will be a lot of dying, including American’s if that happens. Furthermore, if 5-15 million barrels is yanked off the world market for more than a short time, it will devistate most world economies, and USA will be hard hit in particular.
Could someone describe what forces are protecting the oil reserves in the following countries:
A. Saudi Arabia
B. Iraq
C. Iran
D. Kuwait
E. United Arab Emirates
F. Qatar
G. Bahrain
Also, maybe explain why those areas are untouchable.
Could someone describe what forces are protecting the oil reserves in the following countries:
Protecting? From who?
Saddam tried to take over Kuwait’s oil fields. And you know who protected them. Well the same guy is protecting Saudi’s fields, and UAE and Qatar and Bahrain. Iraq is doing what they can to protect their own with a little help from the US.
Iran can very well protect their own fields. Who the hell is going to try to take their oil.
Hi Mike ,
What I know about the actual hands on management of an oil company could be written on a postage stamp with a blunt pencil.
But I do know a little about real estate and oil involves real estate.
The actual ownership of LAND is generally updated on courthouse records within minutes of the ownership changing hands. I believe this is sop just about everywhere in the USA.
LEASES on the other hand are not necessarily recorded and in fact to my knowledge are only rarely recorded in the event the lessee feels a need to protect himself or for some other particular reason.
So – I gather than oil companies generally lease land rather than purchase it outright.
It follows that if company A sells out an existing lease – and leases are often if not always written so as to be transferrable- then there would not necessarily be any easily accessible record of the change of ownership.
It follows again that a lot of distressed oil companies might be selling some of their assets to other companies or to investors who are able to assume existing loans or even pay the loans off.
Would this sort of thing be common knowledge in the industry if it were happening often?
Is there reason to think it might be happening often?
OFM. Oil and gas leases are recorded over 99% of the time in our area, as are the assignments of those leases. Oil and gas leases are a different animal in many respects from other types of real estate leases, such as apartments and business buildings.
Shallow: Same situation in Texas. There must be a lease or notice of lease of record. If not another operator can lease from the same mineral owner(s) and record his making him the new owner.
Yep, I don’t know if there’s a single country in the world where mineral right leases aren’t recorded. I have seen some bad surveys, which set up conflicting claims over the overlap areas. And there’s a tiny oil producing industry in Myanmar’s Chin Hills which allocates the oil production rights by local tradition. But that production started in the 1400’s, they dig shallow wells using bamboo, and production is measured in liters per day.
Thanks. This one is really intresting. I would like to see it again in a few months when both production and number of rigs have gone down.
Revisiting Kopits & The DCPB*
Brent crossed the $60 mark this afternoon.
Following is Steven Kopits (January, 2015) chart showing his outlook for global liquids production less liquids consumption, and Steven has been on record I believe as predicting an oil price rebound (the Prienga curve is Steven’s outlook):
http://i1095.photobucket.com/albums/i475/westexas/Supply%20Minus%20Demand_zpswyvmrvkw.png
Note that the initial short term (three month) and longer term (26 month) recovery in monthly Brent prices during the 2008/2009 oil price decline was 43%/year, relative to the December, 2008 monthly oil price low (when Brent averaged $40). Monthly Brent prices rose at 43%/year from 12/08 to 2/11, when monthly Brent prices once again exceeded $100 per barrel.
The (so far at least) low point for monthly Brent prices for the current decline was January, 2015, when Brent averaged $48. If Brent averages $60 for April, 2015, the initial short term (three month) annualized rate of increase in monthly Brent prices will have been about 90%/year.
*Dennis Coyne Price Bottom, $48 monthly average price for Brent in January, 2015
I question the rationale behind any comparisons to the 2008/2009 oil price trajectories to the recent one (2014/2015) for several reasons;
Back then (2008/2009)
-TARP (US) approved to support the economy
– Central banks rapidly lowered interest rates to ease debt service and incite more private borrowings.
– Central banks rapidly expanded their balance sheets (QE)
– Increased US public deficit spending to bring the economy back on its growth trajectory (GDP)
– EMerging Economies (led by China) had very expansive credit creation (as documented by amongst others Bank for International Settlements, BIS). The EME’s took over global credit/debt creation where the Advanced Economies (AE) had to slowdown/pull back post the Global Financial Crisis.
– OPEC cut back around 3 Mb/d of oil (C+C) supplies
Now 2015
– Little if any room for AE’s to lower interest rates further
– No signs of more balance sheets expansion by the central banks (may not be much room left)
– Global total debt levels has grown strongly since 2008/2009
– EMEs are testing their sustainable debt levels and China’s economy shows signs of slowing growth
– OPEC has maintained their output and EIA (see link below) expects OPEC may extend its biggest output gains since June 2011.
(which for some time easily will offset any declines from US LTO extraction, and may even (for some time) increase global supplies)
”The Organization of Petroleum Exporting Countries may extend its biggest output gain since June 2011 into next month as recovery in Libya and Iraq adds to the Saudi increase, the IEA said.”
..
“Stronger-than-expected demand in the first quarter might signal a faster recovery” or “might just as likely point to a slower one if pockets of demand strength prove short-lived and lead to weaker deliveries later on,” the IEA said.
http://www.bloomberg.com/news/articles/2015-04-15/iea-sees-opec-supply-jumping-most-in-four-years-on-saudi-surge
The thing is to understand the economic undertows that shape the near future demand (meaning consumption).
This time, as opposed to 2008/2009, the situation is very, very different.
They will still do whatever they have to . . . for simply food getting to cities.
Levels of debt? Expunge it.
No one is going to be allowed to starve because numbers are not attractive on a screen. They will be changed by decree.
BTW, the US March budget deficit was a surprise to the upside. The deficit reduction from Sequester appears done and population is re-asserting itself. Likely well north of $500B this FY.
Some other differences:
On the demand side, global vehicle sales were in a severe slump in 2008/2009, while they hit a record high in 2014, with projections for a new record in 2015.
On the supply side, Available Net Exports (ANE*) fell from 41 mbpd in 2005 to 39 mbpd in 2008. In 2013, ANE were down to 34 mbpd, and I suspect ANE fell to around 33 mbpd in 2014.
*ANE = Global Net Exports (GNE, combined net exports from the 2005 top 33 net exporters, total petroleum liquids + other liquids, EIA) less Chindia’s Net Imports, i.e., the volume of GNE available to importers other than China & India
Rune
To what extent are central banks constrained? I know commercial banks are capital constrained to the effect of their total shareholder value, or something like that (I forget exactly), but are central banks similarly constrained? If so, what is their capital?
I’m trying to figure out what the mechanism for QE supporting the oil price was, since QE didn’t increase the demand for loans, which is what it was supposed to do, and didn’t increase net private sector wealth, hence no inflation. Unless it was something to do with portfolio rebalancing or something, I guess.
Commercial banks are capital constraint. There are requirements to their loan to capital ratio. The Basel III rules searches to decrease this ratio.
Central banks are collateral constrained, there is a limit to how much they can take on their balance sheet. I have seen estimates that show that the FED is now leveraged 50:1.
QE 1 was launched late 2008, QE 2 late 2010, QE 3 late 2012 and ended in October 2014. The oil price started to decline in June/July 2014 and by then it was clear to the market that the FED was not going to expand their QE3.
Non financial debt in the US started to grow during Q1 in 2011 and had grown by around $1.6T by Q4 2014 (when was it the tight oil industry really took off?) and household debt increased by $0.4T as from Q1 2013 to Q4 2014. (The numbers are from the FED).
US total petroleum started to grow by Q3 2013, which was while oil prices still were above $100/b.
A portion of the QE money ended up in carry trades, and dollar denominated debts are now estimated at $9Trillion.
The EME’s increased their dollar loans from “cheap” money, this allowed them to increase their demand, also for oil.
A US rate increase may start unwinding these carry trades and/or make it harder to service the dollar denominated debts which increases the amount of local currency to service these debts. A rate increase may also strengthen the dollar thus worsening the burdens for countries with huge dollar denominated debts.
Rune,
I think most of that can be explained by a combination of low interest rates and high oil prices though can’t it? As far as I understand, QE is an asset swap. The private sector loses a trasury bond, which basically disappears into the black hole of the central banks balance sheet, and gains the same amount back in central bank reserves. The net effect on private sector wealth is zero, hence no inflation, right? My understanding is that banks create loans first, and then seek central bank reserves later as and when the need them. Simply giving them more reserves won’t alter this process, because the loan demand comes first, not the reserve requirement.
The only thing it’ll do is change the composition of private sector wealth so that there’s less t-bills, and more reserves, but whether these reserves are that much more liquid or not, I dunno. They might force some kind of portfolio rebalancing effect, I guess. I just find myself wondering how good a correlation there is between QE and the oil price, when it’s hard to see a direct
I got most of my understanding of how QE works from this paper by Cullen Roche, who I think has the operational side of things down pretty well: http://papers.ssrn.com/sol3/papers.cfm?abstract_id=2397992
Sam, low interest rates works both the supply and demand side of the equation. If less money is used for debt service some of it may be directed to bid up the oil price, if the supply/demand balance is tight.
Lower interest rates also stimulate more credit creation which also works both sides of the supply/demand balance.
It (QE) is about liquidity.
I never claimed there was any correlation between QE and the oil price, but there are very likely some effects from QE that also affects oil demand and the price for oil. The global monetary/financial machine is a big and complex animal.
The US dollar is the world’s major reserve currency, and anything that the Fed does affects others.
Interest rates have an effect, so did credit expansion from China that accelerated as from Q1 2009 just as the Global Financial Crisis (ref chart below) (the same is found for all the big emerging economies) affected the advanced Economies.
The long version of my 2008/2009 to 2014/2015 comparison:
Jeffrey, all you mention is fine.
The point remains that demand is what you can pay for.
For any exports to be around there needs to be a liquid importer who demands your product. If no one can pay for their oil imports, there will be no exports. Oil is embedded in the global financial matrix, not the other way around.
As regard to vehicle sales these need to be adjusted for net growth in vehicles and improved efficiencies.
Nope. China vehicle buys largely do not replace. They add. Nouveau riche people. Didn’t have cars before.
It’s brand spanking new consumption, regardless of gas mileage.
A better metric to evaluate from would be developments in vehicle miles driven.
Not bad. Yes.
When I was in China in 2006, many things were surreal.
On traveling to the city I stayed, I saw two car crashes, one totally flipped over, like in a Hollywood movie, very close to us.
They honk their cars’ horns like crazy there too, not just for emergencies like here, but for simply telling you that they are passing. So it was very noisy.
While I was rollerblading around, at one time, I saw a donkey pulling a cart with the owner holding the reigns while sitting on the front end of the cart, then, an Audi Quattro passed it, and right after that, an entire family– mom, dad and three kids– on a scooter, then someone on a bike. Just a mishmash of all manner of vehicles at once– 3-wheeled mototaxis, tiny pickup trucks stacked in the back to the moon with products and teenagers on electric scooters clutching their cellphones.
The taxi driver who drove me back to the airport misunderstood what was said and thought I was late for my flight, so he tailgated everyone at breakneck speeds. I quietly prayed to myself, just make it there alive, just make it there alive.
The ceiling of the airport in Shanghai has these metal spikes pointing downward and sort of look like they might be under tension and could snap at any time and skewer you to death.
And in the vending machines there are sweet snacks with the appetizing name of ‘Collon’, that look like cut vanilla tube sections with chocolate in the middle.
Oh ya, one last cool thing. Bus travel blows away the crappy Greyhound buses here. There, they have 3 rows of very clean and comfy bunk beds! This is my video footage of one I took.
The point remains that demand is what you can pay for.
Exactly!
Let’s say I want to set up a little sandwich booth at a street fair and I get a loan from a close friend to cover my set up fees and enough to purchase bread and ingredients for 200 sandwiches. I figure out that to be able to repay my friend and make a small profit I need to sell my sandwiches at $5.00 each. On the day of the fair there is a line of 200 very hungry customers at my booth. Unfortunately they can only afford to pay $4.99 for a sandwich. Consequently there is no demand for my sandwiches and I lose my shirt and they go hungry!
A more accurate analogy would be that some people in the line could afford to pay $5.00, but some could not.
A more accurate analogy would be that some people in the line could afford to pay $5.00, but some could not.
And one would think that before anyone borrowed money to sell sandwiches at $5.00, he/she did enough research to know if the segment that can afford $5.00 sandwiches is large enough to justify starting a business directed toward them.
You can have a high priced product that only a small group of people or businesses can afford as long as there are enough of them to cover your costs and better yet, allow you to make a profit.
If you are selling a totally new product with no proven track record, then you look at comparable products to see what you think the market will bear. And if you can’t do that, you try to start so small that you don’t risk much. Kickstarter has become a way to test a prototype concept.
Of course, but I was making a point about the fact that if your target market isn’t able to pay the price you need to sell at then you both lose.
In future I will refrain from trying to make business analogies and stick to things I know >;-)
Fred,
Perhaps a poor analogy.
In aggregate there would be enough money to pay for 199 sandwiches.
What if the situation were that 100 had the money in their pocket and were willing to pay $5 for a sandwich and then there were an additional 100 that would have bought, if someone would lend them the money. Potential demand is 100.
If someone extends the credit/debt to the 100 that does not have the money, potential demand grows to 200.
And if the credit/debt creation allowed and there were enough creditworthy persons around, demand could grow above the 200 and potentially allow for a price increase.
Thank you Rune, you are right of course! As I said in future I’ll stick to try to make analogies with things I know and understand well >;-)
Rune,
Of course, the way it really works is that some consumers can increase their oil consumption at a given oil price, while some consumers will be forced to reduce their consumption, at a given oil price. And as NickG would note, consumers could voluntarily reduce their consumption, despite their ability to buy more oil.
I would argue that what we are seeing is lower/middle income consumers in developed countries being squeezed between rising demand in developing countries and stable to rising demand among higher income consumers in developed countries.
In terms of aggregate data for developing countries versus developed countries, what has happened is clear. The following chart shows normalized liquids consumption versus annual Brent crude oil prices for 2002 to 2012, for China, India, the (2005) Top 33 Net Oil Exporters and the US. The same trends continued in 2013 (and US 2014 liquids consumption remained below 2002 levels).
What will happen, especially in regard to China, is less clear, but from what I understand, what we are currently seeing in China is a slowdown in the rate of increase in oil consumption.
In any case, it’s very short term data, but based on said very short term data (about three months), monthly Brent crude oil prices are currently rising roughly twice as fast (relative to 1/15) as they did relative to the 12/08 monthly price low. I would argue that a significant contributor to this price increase is that there may be only about 31 to 33 mbpd of GNE* available to importers other than China & India in 2015, versus 39 mbpd in 2008 (and versus 41 mbpd in 2005).
*GNE = Combined net exports from (2005) Top 33 net exporters
@Jeffrey,
”I would argue that what we are seeing is lower/middle income consumers in developed countries being squeezed between rising demand in developing countries and stable to rising demand among higher income consumers in developed countries.”
So what is it that really drives this demand from the emerging economies?
(Demand is what one can pay for. Debt adds to aggregate demand)
”In terms of aggregate data for developing countries versus developed countries, what has happened is clear. The following chart shows normalized liquids consumption versus annual Brent crude oil prices for 2002 to 2012, for China, India, the (2005) Top 33 Net Oil Exporters and the US. The same trends continued in 2013 (and US 2014 liquids consumption remained below 2002 levels).”
No one argues your observation.
It is the economic undertows leading to that observation which needs to be focused at.
”What will happen, especially in regard to China, is less clear, but from what I understand, what we are currently seeing in China is a slowdown in the rate of increase in oil consumption.”
Could that be related to the slowdown in Chinese credit expansion (ref my chart further up)?
Do you have an updated chart as per now? And what was the assumptions for OPEC and US production for your chart?
The only updated consumption data for 2014 I have is for the US (although there may be some data on Chinese consumption). OPEC is of course included within the (2005) Top 33 net exporters group. And the chart only shows liquid consumption, irrespective of production.
Following is a chart showing the ratio of GNE to CNI (Chindia’s Net Imports) for 2002 to 2012. With the 2013 update, there were some revisions to prior years, but the GNE/CNI Ratio decline continued in 2013.
Note that given an ongoing (and inevitable) decline in GNE, unless CNI falls at the same rate as, or at a faster rate, than the rate of decline in GNE, the resulting rate of decline in ANE* will exceed the rate of decline in GNE, and the rate of decline in ANE will accelerate with time.
*ANE = GNE less CNI
Link to GNE/CNI Chart:
http://i1095.photobucket.com/albums/i475/westexas/Slide20_zps26112103.jpg
Rune, Jeffrey, and all,
WRT China, if one closely examines the contributions to reported GDP from production, exports, fixed investment, consumer spending, gov’t and M2/GDP, exports and production net to ~0% to consumer spending, leaving only state-directed bank lending of ~14-15% at M2 of ~50% of GDP as the net contributor to any reported GDP growth.
However, the vast majority of the state-directed lending is to COLOSSAL overcapacity for DOZENS of Potemkin Village-like ghost cities that contribute no net value-add to the economy after net interest costs and depreciation.
That is, were it not for the equivalent of ~$1.2 trillion/year in non-productive state-sponsored fixed investment (47-49% of GDP!!!) in China, the Chinese economy would effectively be growing at ~0%.
Therefore, China’s state lending and investment is contributing to ~75-80% of incremental consumer spending and 100% of reported GDP growth.
The primary takeaway is that China’s current “natural rate” of organic real GDP growth is ~0%, whereas the economy requires effective state-directed deficit spending/lending of 14-15% of GDP and 100% equivalent of GDP growth to prevent contraction of the economy.
The simple math of the situation is that China’s economy ceased growing from productive investment, production, consumption, and exports in 2005-08 and has been in a runaway state-directed credit and fixed investment bubble that is unprecedented in world history as a share of GDP.
I wonder what the US economic numbers would look like, without post-2008 QE?
Jeffrey,
..and without TARP, increased deficit spending and lower interest rates.
I am not sure you would like to go there.
Hi BC, and thanks a lot.
If I read your numbers right the growth is stimulated by state directed bank lending, and organic growth is not present.
I wish I had more time available to dive deeper into the developments of the components of China’s GDP.
What really got my attention some time back was when I got aware of the jump in the growth of China’s private sector non financial debt. It jumped with close to 60%!!! from Q4 2008 to Q1 2009.
Ref my chart upthread.
For 2013 growth in debt was about 30%!!!! of GDP. This relation should cause some eyebrows to be raised.
And has since remained at a very high level, annual growth in debt was on average about 20% of total debt. This is a feature found with several emerging economies.
McKinsey estimated that China’s total debt rose to about $28Trillion or about 282% of GDP by mid 2014.
Michael Pettis found that “every investment led growth miracle in the last 100 years has broken down.”
So what remains to be seen is how the government in China will wind down the high investment driven growth of its GDP.
Things that cannot go on will not.
https://www.bondvigilantes.com/blog/2014/01/24/chinas-investmentgdp-ratio-soars-to-a-totally-unsustainable-54-4-be-afraid/
http://www.zerohedge.com/news/2015-04-15/chinas-true-economic-growth-rate-16
How Do You Keep Your Kids Healthy in Smog-Choked China??
http://www.nytimes.com/2015/04/16/magazine/how-do-you-keep-your-kids-healthy-in-smog-choked-china.html?hp&action=click&pgtype=Homepage&module=mini-moth®ion=top-stories-below&WT.nav=top-stories-below
Link to “Under the Dome” documentary:
https://www.youtube.com/watch?v=T6X2uwlQGQM
what we are seeing is lower/middle income consumers in developed countries being squeezed between rising demand in developing countries and stable to rising demand among higher income consumers in developed countries.
I think there’s a bit of truth to this. The weird think is that almost all low income consumers in developed countries could easily cut their transportation costs by buying lower cost and higher efficiency vehicles.
The average car on the road only gets 23MPG. The average new car is about $32k, at least twice the lowest price. So, people are paying far more than they have to. I think they’re being exploited by car companies, oil companies and oil exporters, who have the cooperation of the media (especially Fox News and talk radio) to help convince people they need the most expensive and high operating cost vehicles.
People are status seeking creatures. Bigger, more expensive (and wasteful) cars imply you have more wealth and higher status. All this “people are being manipulated by corporations and the media” is a half truth at very best. Advertising might play to various insecurities, but it didn’t put them there.
Advertising is intended play on insecurities, and magnify them. Advertising is powerful: 50 years ago diamond engagement rings were unknown in Japan – now they’re absolutely expected. That was entirely due to DeBeers advertising.
Given the competitive nature of the car market, this is something that can only be fixed by regulation and government dissemination of more accurate information.
Nick, while I’d agree more with you on the pt. you and Sam contend – yes, the insecurities are there, but the populace is manipulated by them in far more ways than advertising – see Adam Curtis’ Century of the Self, BBC – the point you overlook regarding low income folks is that they don’t buy new cars. They buy used cars. That chunk of the market isn’t shifting until efficient vehicles are available 2nd (or 3rd) hand cheaply.
I agree – lower income people tend to have smaller, used vehicles.
But…there are a *lot* of new vehicles, larger cars, pickups and SUVs being driven by people who should be choosing much cheaper rides. If lower income people were truly going for the lowest cost choices, the very smallest cars, hybrids and EVs would have *much* higher resale values, and larger cars, pickups and SUVs would have *much* lower resale values than they do.
Hi Rune,
You are correct that demand by definition is what can be paid for. I would love to own or lease a Tesla, but cannot afford one at the current price level. If the price was cut in half, I might at least consider buying one, but it would still be a stretch.
Oil prices have fallen quite a bit since mid 2014, I would expect demand for oil would increase.
Current World economic growth is positive, in 2009 it was negative and all of the actions taken by governments were to offset the decline in private spending due to the financial crisis.
Even if the World economy grows very slowly (1% per year), oil prices remain low, and oil demand does not increase, the oil supply will decrease due to poor profitability. Eventually the low supply of oil will drive up oil prices or if oil prices remain low and oil supply is adequate, then GDP is likely to increase and increased oil demand would drive oil prices higher.
It is impossible to say with certainty how quickly this will occur, but I think the long term trend in oil prices will be higher, likely returning to $100/b by 2018 at the latest.
To me, Steven Kopits’ and Jeffrey Brown’s analysis looks convincing.
Sam Taylor expects oil price volatility and I agree with that assessment.
If there is a near term financial crisis, and debt levels collapse, then oil prices will fall rather than rise and oil supply will also fall. I think such a scenario is unlikely.
Dennis,
You only produce claims and speculations not worth wasting time on.
delete
Hi Rune,
Thanks. I will refrain from commenting about your opinion in the future.
Dennis,
Let me correct the record as I think Rune got it wrong. I would rather assert that you only produce solid analysis worth mulling over.
Keep up the good work.
+1
I concur with WHT.
Jeffrey,
In my view the most important difference between 2008/9 and 2014/15 is the futures market. In 2009 the futures market turned quickly and future prices reached 90 USD per barrel already in spring 2009. Today future prices are very stagnant at a little bit over 60 USD per barrel. This represents a major problem for most companies as they cannot finance new production through locking high prices over the future market. This is why I think we will get a massive plunge of production around this time next year. This will be true especially for natural gas. In 2014 new production has been around 15bcf per day and legacy decline of 12 bcf per day resulting in a net increase of 3 bcf per day. However in 2015 legacy decline will be around 20 bcf per day, which is nearly one third of total production. New production is very likely just around 10 bcf per day, which gives a net production deficit of 10 bcf per day. This will have a big impact on natural gas prices.
As I frequently point out, Citi Research puts the overall legacy decline rate from existing US gas production at about 24%/year, which would imply that 2014 US dry gas production would fall by about 17 BCF/day from 2014 to 2015 (excluding new wells put on line in 2015). And in my opinion, this estimate is supported by the observed 20%/year net decline rate in Louisiana’s marketed gas production from 2012 to 2014 (this was the net decline, after new wells were added).
Link to my gas comments:
http://peakoilbarrel.com/eias-april-drilling-productivity-report/comment-page-1/#comment-511869
Jeffrey,
According to the EIA drilling report, the legacy decline rate is rapidly increasing. So in 2014 the legacy decline rate was much lower (12 bcf per day on average) than it will be this year (20 bcf per day). So, in my view this will lead to very high natural gas prices in 2016 as the US has little import capacity for natural gas.
from Leonard Brecken over at oilprice.com
“One has to wonder if “Peak Oil” at the current price deck in the US is very real indeed. Look for draws and not inventory additions to start in earnest in May. The next media spin will now focus on future risks to oil supply in 2016 to keep the oil curve flat, whether it be the rise in the US dollar or Iran. The short term risks appear to be clearing so the attention will be turning on preventing prices from rising too high. Just this morning, Dow Jones ran an article quoting the Citibank oil analyst that days of triple digit prices are in past. Thump…that’s the sound once again of someone falling off their chair in utter amazement as to what is occurring to distort reality.”
http://oilprice.com/Energy/Crude-Oil/Has-The-U.S.-Reached-Peak-Oil-At-Current-Price-Levels.html
Hi. I had a hard drive failure and some of my work was lost. Fortunately I had a backup so hopefully there are no important changes to my Bakken program that I have missed. Anyway, here are some quick updates.
For Mountrail there is a large increase in production for wells that started production in January. But the number of wells have decreased from 20-30 last year to 14 in January. Also note again that confidential wells are not included.
For total Bakken not much is happening really for average well production. So to be able to keep up the production, they need to continue to drill a lot of wells.
I have also looked into how many wells that have been put in production each month. You can see the graph bellow. As Enno already mentioned there were 160 wells in February. The method I used was to find out which month a well had it´s oil number more than zero for the first time or if confidential, the first month which sales number was above zero. If no such month was found, then completion date was used. The good thing is that all wells are included, even confidential ones. However, not only Bakken wells are included.
I find Helms numbers of 63 and 42 for completions in January and February strange. Maybe it’s when they started completion work. In that case new wells for March and April would decrease a lot and so will total production in that case.
FreddyW,
Thanks for sharing your work.
As I read the charts it appears as the Gas to Oil Ratio (GOR) has been increasing for newer wells (during their first month of flow).
Does this GOR trend remain as the well ages? (say for wells with 3, 6 etc months of reported flow?)
Water cut appears to be on a growing trend (even if the number wobbles around).
Here is a graph showing gas to oil ratio per year.
And here is an updated graph for water cut. They have similar profiles as you can see. GOR and water cut increases slowly over time for an average well and newer wells have higher GOR and water cut.
One thing that is interesting is that GOR goes down a bit around and after month 66 for year 2008. I showed last month that production went up a bit during that time for those old wells and I wondered why. If GOR goes down then I don´t think it can be because of artificial lifting. Water cut stays flat so I don´t think it can be re-fracking either. So perhaps communication with newly completed wells then.
Hi FreddyW, and thanks a million for sharing.
I am not sure yet what to make of the growth in GOR for newer wells.
The growth in water cut for newer wells and as wells age is interesting. Water cut is an exponential function.
No problem :).
I did some investigations why wells from 2008 increased production around and after month 66. I was able to find a couple of wells. They were mostly EOG wells in Parshall, Mountrail. They stopped production for about 2 months. Then when they started production again it increased from 150 to 350 barrels per day in one case and from 80 to 200 barrels per day in another case. Using the GIS map server I looked for wells close to the 2008 wells and as I suspected they started production exacly the same time as the 2008 well came back online. So looks like its a down spacing effect. The 2008 wells communicates with newer wells. Bellow I have a graph showing one typical example. I don´t know why WAYZETTA 148-0311H is so crappy. You can´t see it in the graph, but it produces almost only water. About 1000 barrels per day.
FreddyW,
First are the wells you presented all set in the same formation?
Now I wish I could borrow some time somewhere to go deeper into the data the way you so excellent have presented. I think a lot would like to have a more detailed look at well data from downspaced wells/areas.
If we also had developments in GOR, water cut and pressure readings for the same wells we could soon find ourselves in for some interesting time analyzing those data.
Rune,
WAYZETTA 148-0311H is in three forks, but the other ones in middle bakken. There are other wells also in the area. So the graph does not show all wells. I just wanted to show in this example how old wells are impacted by downspacing.
Yes that would be interesting but also time consuming. If you want to spend the time on this I can send you a text file with all the data for each well collected?
Rune, GOR is supposed to go up in a depletion drive reservoir (I expect these bakken tight zones are depletion drive). Eventually GOR starts to drop, at that point the pressure has cratered and production rate is very marginal. Most reservoirs undergo secondary recovery or EOR before they crater.
Fernando, thanks!
I knew GOR was growing with time for.
What is going on in Spain Fernando?
“Above all, Spain demonstrates that even in a country where the conservative government has not been supportive of renewables, non-carbon energy can make substantial strides and even completely replace fossil fuels in a major industrialized economy. In short, if Spain can do it, anyone can.”
http://www.truthdig.com/report/item/will_spain_be_the_first_net_carbon_zero_g-20_state_video_20150415
Ezra, I saw the video. Their statistics are for March 2015. Last month, and early April were odd around here. Very windy, more rain than I remember seeing. Therefore the one month stats are a bit off the yearly statistics.
The system was designed with a lot of overcapacity, and the hydro and natural gas turbines are used to back up wind and solar. At this time the emphasis is on investments to interconnect more high voltage lines to France (I think they want to shed to the UK and other nations). There’s very little new construction going on because the system is optimized. I don’t think the government will do much to subsidize more wind, and they are fairly negative about solar (solar uses up a lot of the hydro capacity when it’s not generating).
Fossil Fuels Just Lost the Race Against Renewables
“The race for renewable energy has passed a turning point. The world is now adding more capacity for renewable power each year than coal, natural gas, and oil combined. And there’s no going back.
The price of wind and solar power continues to plummet, and is now on par or cheaper than grid electricity in many areas of the world. Solar, the newest major source of energy in the mix, makes up less than 1 percent of the electricity market today but will be the world’s biggest single source by 2050, according to the International Energy Agency. “
Nick,
Where did you get the data?
Are numbers in kilowatt generating power capacity, or in projected annual kW-hours of energy generated? It makes a big difference – renewable solar/wind has a capacity factor of about 0.25-0.3, with fossil having a capacity factor of 0.8-0.9. Hydro can also have a low capacity factor, depending on location. California’s hydro is looking even worse than wind or solar right now.
They call it capacity, so it’s probably peak capacity.
On the other hand:
1)low-CO2 power includes nuclear, which has a much higher than average capacity factor, and
2) fossil fuel plants only average a capacity factor of roughly 33%. The grid requires quite a lot of overbuilding to provide reliable backup and peak capacity.
We’d need to see data to know if kWh market share was significantly different from capacity.
Nick’s data apparantely is about generating capacity (not increase in electricity generation). The average observed capacity utlization rates for fossil fuels power plants are about 40-50%. The average observed solar capacity utilization rates about 10% and for wind about 25%.
Note the word “observed”, that’s very different from the claimed utilization rates.
Everyone can calculate these rates using EIA data and the following formula:
Capacity Utilization Rate = Annual Electricity Generation / (Generating Capacity * 8760)
Again, as I write above, the article includes nuclear (at 90% capacity factor in the US), and fossil fuel overall capacity factors in the US are around 33% (just go to the EIA and look at overall capacity: FF capacity is around 1,050GW, while average production is around 350GW). It’s not clear that there’s a difference between the overall average capacity factors for the two categories (non-FF vs FF).
Nick,
I went to the EIA and did the sums for capacity factor in the USA, based on their 2012 data. I got the following results:
All fossil fuel: 40%
Total renewables: 36%
Non hydro renewables (including burning biomass) : 33%
Wind: 27%
Solar tide and wave: 15%
Nuclear: 86%
If you apply those scalings to the graph above I’m sure it’ll look much less impressive.
Personally, I take issue with adding the “biomass” into the renewables category, because it often involves burning wood pellets made from clear cutting virgin US forest in places like Louisiana. I do not consider that renewable. Large scale hydro also comes with significant environmental impacts, let’s not forget.
The Bloomberg article doesn’t compare “renewables” to fossil fuel, it compares all low-CO2 sources to FF. Did you include nuclear in your analysis? It looks like not, so I’ll think you’ll find that the two categories have comparable capacity factors.
burning wood pellets made from clear cutting virgin US forest in places like Louisiana.
On the one hand, it looks like there are few remaining natural and semi-natural forests in the SouthEast. On the other hand, it looks like “Practices such as large-scale clearcutting, old-growth logging, wetland logging, and the conversion of natural forests to plantations are mostly unregulated and are often practiced in sensitive habitats with little protection for species.”
http://www.nrdc.org/energy/files/wood-pellet-biomass-pollution-FS.pdf
The NRDC thinks biomass could be used, but they say we need “adequate policies to protect the climate and forests before expanding biomass operations.”
uhm, not really…
“For decades, fossil fuels have provided the vast, vast majority of the world’s energy. But in recent years, cleaner sources like wind and solar have been growing at an astonishingly rapid clip.
So a lot of people are keenly interested in when we might hit a tipping point. When will clean energy start growing faster than fossil fuels? This week, Bloomberg declared we’ve already hit that point: “Fossil Fuels Just Lost the Race Against Renewables.” That’s stirred a lot of excitement.
Unfortunately, that headline isn’t quite right. Clean energy isn’t winning the race against fossil fuels. Not yet. And it’s worth exploring in more detail why this is wrong — to better understand just how massive a task it will be to clean up the world’s energy supply and avoid significant global warming.”
http://www.vox.com/2015/4/15/8420297/fossil-fuels-race-renewables
Even if we take Nick’s graph literally. It would mean that fossil fuels will continue to grow in the elctric power sector at least up to 2030. There will no reduction!
And of course that’s the only electric power sector. We’ve seen nothing about transporation, heating, chemicals.
That chart just shows the rate of new installation. It doesn’t show decommissioning, or falling utilization. IOW, it shows births, not deaths.
Wind, solar, nuclear and hydro will always be maximized, and FF plants will be used less.
In the U.S., coal consumption is falling, as coal plants are decommissioned, and as capacity factors fall.
Here’s a nice paper on how energy transitions tend to occur:
http://blogs.shell.com/climatechange/wp-content/uploads/2009/12/Nature-Article.pdf
If solar is indeed the largest single energy source by 2050 then Tina Turner will probably be queen of the outback.
This a 5 year old Op-ed piece written by Shell oil, which argues that because previous energy transitions have been slow, this one must be.
Sigh.
Are you going to critique the data or just ad hominem? I’m not sure that the world has changed sufficiently in 5 years that their conclusions are invalid, indeed the growth of solar so far lines up pretty well with their predictions.
First, they’re making an argument by analogy: previous energy transitions went from exponential to linear at the point of “materiality”. Well, nuclear stop growing at a certain point because there wasn’t a clear need for more, and it’s risks and costs became a little clearer after 3-mile Island and many cost over-runs.
The analogy doesn’t hold, when there’s a clear need to reduce carbon emissions sharply.
2nd, there’s no way to test their forecasts yet: they simply say that growth will slow down in the future, with no detailed arguments, just old discredited arguments about limits to market share due to a need for storage. Perhaps their strongest argument is “industry will only consider early retirement of the existing capital stock if the total cost of the new technology (capital and operating costs) falls below the operating cost of the old.”
That’s a classic statement of “we don’t want to retire our old, dirty plants, because it will cost money to do it”. Sheesh.
Also, as far as the data shows, fossil fuel electricity generation has done nothing but grow.
http://www.eia.gov/cfapps/ipdbproject/iedindex3.cfm?tid=2&pid=28&aid=7&cid=ww,&syid=1980&eyid=2012&unit=MK
This article is based more on reinforcing the worldview of people reading it than it is about accurately portraying any useful data or trends. Might as well cheer because you called the fire brigade while your house is burning down.
Sam,
This data appears to end at 2012 – that seems too old to be useful.
Seriously? These things don’t change as fast as you seem to think they do.
Never saw data that didn’t fit your worldview that you couldn’t hand wave away did you?
Sometimes a clear argument is all that’s needed, if the other person is listening.
In this case, the data you found ends at pretty much the same point that the charts above start. So, they’re just not comparable.
Let the squeals begin.
This is a link to the EIA graphs I highlight in my summary of the 2015 report
http://21stcenturysocialcritic.blogspot.com.es/p/the-2015-energ.html
I thought there was a pretty strong consensus on this site that EIA forecasts aren’t useful.
In any case, it’s helpful to keep in mind that the EIA is an arm of government, which means that they deliberately use very, very conservative assumptions. Their “reference case” assumes NO NEW LEGISLATION OF ANY KIND, because….it’s the reference case (aka “baseline”) for any public policy changes.
“The question is no longer if the world will transition to cleaner energy, but how long it will take. In the chart below, BNEF forecasts the billions of dollars that need to be invested each year in order to avoid the most severe consequences of climate change, represented by a benchmark increase of more than 2 degrees Celsius. ”
http://www.bloomberg.com/news/articles/2015-04-14/fossil-fuels-just-lost-the-race-against-renewables
From your quote, “in order to avoid the most severe consequences of climate change, represented by a benchmark increase of more than 2 degrees Celsius.” This is a very incorrect and dangerous way of thinking that is nevertheless prevalent in much of our mainstream media. The reality is, there is practically nothing we can do about climate change and the steps we could take are never even discussed. That is, nuclear and population control.
The EIA projects world energy consumption will increase 56% by 2040 with that increase coming almost exclusively from non-OECD nations and will be fueled primarily by coal and exclusively by fossil. We can’t even contain the rise in annual emission rates let alone decrease them.
If the US stopped ALL fossil fuel consumption tomorrow, the impact on the United Nations’ Intergovernmental Panel on Climate Change’s (IPCC) modestly-educated 3.0°C temperature rise by 2100 is: 0.052°C by 2050 and 0.137°C by 2100, or a rounding error.
So we could stop all fossil fuel use in the United States tomorrow and by 2100, we would still see no impact on climate change!
So could somebody please explain to me how we hope to reverse over a century’s worth of building global economies on the back of fossil fuels when the only suitable green energy source, nuclear, is out of favor with the very crowd screaming we need to do something?
Solar and wind lack storage and nothing on the horizon says that will change anytime soon, and carbon sequestration has never been done on a commercial scale. The “solutions” to climate change that have been proposed would do nothing but hinder economic growth, hurt successful business owners, and decrease our standard of living. Better solutions would be to adapt with sunscreen, life jackets and purchasing real estate at higher elevations. We just need to embrace whatever it is climate throws at us because there ain’t a thing we can do to change it into something that we feel would better suit our needs.
Yes, Nick’s graph actually means fossil fuels will continue to grow. Only that if will over time account for a smaller share of the growth than the renewables.
Probably not. See my note above.
That 2 degree limit is political. It’s highly dependent on climate sensitivity, and the impact is largely set by cost estimates with very little basis and discount rates nobody agrees upon.
Based on papers I have seen the world benefits until temperature exceeds 0.8 degrees C above today’s average temperature. After that level is reached the world economy descends gradually and eventually it’s just as impacted as it is today. The curve’s shape is pretty uncertain.
Which is an excellent argument not to try to experimentally verify the shape of the curve.
The shape of the curve will never be known because it’s a comparison between hypothetical outcomes. If we do nothing we have an outcome, if we do something, we get a different outcome, but we don’t get to experience the do nothing case. If we do something in between we end up not knowing the real results for the other options.
I suspect some individuals think their proposed moves are no brainers, can’t lose, slam dunks. But this is a hellishly complex problem, and it’s very difficult to get valid numerical answers. Whatever we do will always be a one way experiment, and it may turn out to be a dumb move.
The EIA projects world energy consumption will increase 56% by 2040 with that increase coming almost exclusively from non-OECD nations and will be fueled primarily by coal and exclusively by fossil.
Again, I thought there was a pretty strong consensus on this site that EIA forecasts aren’t useful.
In any case, it’s helpful to keep in mind that the EIA is an arm of government, which means that they deliberately use very, very conservative assumptions. Their “reference case” assumes NO NEW LEGISLATION OF ANY KIND, because….it’s the reference case (aka “baseline”) for any public policy changes.
Unfortunately this neglects that only around a third of direct co2 emissions come from electricity generation, with more coming from the transport sector, industry and elsewhere. EV’s are as yet an insignificant part of the vehicle mix, and indeed recently in the USA their growth in sales volume appears more linear than exponential
A significant chunk of indirect ço2 also comes from agriculture, which releases large amounts of methane which decays into co2 in the atmosphere.
Most of these reports are from the same sell side analysts who assured us that the shale production in America would surely keep growing throughout the price squeeze. I don’t think I’ll take them at face value to be honest.
Hi Sam Taylor,
When the World reaches peak output for fossil fuels in 2025 or so, the price of all fossil fuels will rise and alternative energy will become more competitive, there could potentially be a rapid transition when that occurs in transportation, heating and power generation. I am aware that this will by no means be straight forward, but with greater energy efficiency, a change in lifestyles (by necessity), and some research and development, it may be possible. Starting to work on this sooner would be better than later and focusing on finding alternative solutions would be better than a focus on producing more fossil fuel.
Sam,
I thought there was a pretty strong consensus on this site that oil will peak soon, and decline quickly? I am afraid that’s optimistic, and that we’ll see a plateau for quite a while, but one can hope.
In any case, EVs use about 20% as many joules per km as ICE vehicles, so the energy consumption of the transportation sector would be reduced pretty quickly with a sensible transition away from ICEs. Again, I’m afraid we’ll have a plateau in oil consumption and not have a sensible, fast transition away from oil, but we can hope.
I expect that something like a long drawn out plateau might persist for a decade or two. If the last few years are anything to go by, there will oil be price swings up and down, economic malaise and static/slowly declining production.
Of course there are likely points where the economys ability to afford expensive energy goes somewhat nonlinear, so it’s hard to make any certain predictions. Depends on how you account for energy in your production function.
3,421 Miles Per Gallon
http://www.foxnews.com/leisure/2015/04/14/university-students-build-3421-mpg-car/?intcmp=features
http://portal.ransquawk.com/headlines/iraqi-oil-minister-mehdi-says-oil-exports-should-reach-a-record-3-1mln-barrels-per-day-in-april-forecasts-additional-oil-export-gains-when-heavy-basra-oil-comes-into-production-15-04-2015
We got a close above 55.00 A move to 67.00 is underway.
Sawdust, perhaps a pullback from $54-$58 before a run at $66-$67, eh?
A rally in the price of oil and gasoline to the $60s-$70s going into the spring-summer driving season with the US economy decelerating to historical stall speed is not unlike in 1937, 1981, and 2008.
Any such rally will likely be levered futures and HFT algobot driven, wiping out any net benefits to consumers and businesses from the recent crash in the price of oil and gasoline.
BC,
Well it’s never a straight shot. But 55-54 is now support so any small pull back between now and 67 should be bought.
Take a look at spot USD/CAD, oil is seriously driving the CAD. Dollar is down across the board but against CAD in particular. USD/CAD might retest the range support it just broke in the next day or two but clearly there is not much room for a rebound in USD/CAD so probably not much room for a pullback in oil.
USD/CAD daily chart
My target for the break of the range support in USD/CAD is 1.1950 It would coincide well with oil at 67.00
Looking forward it’s impossible to tell just yet, oil will do one of two things. It will either reach the 66.00-67.00 area and then stay range bound between 55.00 and 67.00 for awhile or it will blow right on through 67.00 and target $80 oil. We could see $80 oil before year end.
That sounds like speculation but anyone reading this needs to understand that professional trading is not luck or speculation. It’s skill.
And if it does neither of those two?
Well if it does neither of these two then support at 55 failed. Highly unlikely to happen giving the technical support thats already currently in place.
DuaneX what exactly do you do for a living?
All professional traders, HFT algo machines look at the same charts. Price becomes a self fulfilling prophecy when everybody is looking at the same information in the form of a chart. Understanding how to read a chart is where the skill comes in. I’ve been doing it for 15 years.
HFT algorithms do not look at charts. They look at opponents. They quote stuff and maneuver trade schedule to achieve superior performance. They predict nothing.
All of technical analysis evolved as an attempt to describe and predict human behavior in markets. When there are few humans, it loses its basis, and even when it had its basis there was never any statistical evidence that it was predictive. Indeed, it cannot be. If it meant anything and was widely used, then the predictive value would be destroyed.
Watcher,
HFT algorithms break down charts into every conceivable technical outcome then they push prices to technical barriers blowing out stop and limit orders. Thats why you see dips and rips in markets the way you do.
You read too much Zero Hedge if you believe machines are in control of this market. Wait till we get a fundamentally bear market and see how HFT’s start reacting to the news. They will get banned as they will be harmful to price shares in a fundamentally bear market.(The moment corporate USA is unable to borrow more money to do stock buybacks)
Fed hasn’t canceled the business cycle nor has it canceled bear markets. What the Fed has done is temporarily delayed the business cycle and bear markets.
You have too much faith in the Fed and our central planners.
I’ve been doing technical analysis for 15 years. It works just fine. Matter of fact it’s the only way to trade these markets successfully.
What do you do for a living or what did you do for a living as you might be retired?
Article: http://seekingalpha.com/article/3072366-global-oil-supply-and-demand-early-2015-review
If people who ordinarily detest each other happen to look share an opinion about a given issue then the odds are excellent that shared opinion is based on facts or at least sound thinking.
AlGOR TEAMS UP WITH THE TEA PARTY TO PROMOTE SMALL SCALE OWNER OPERATED GRID TIED SOLAR POWER
http://www.renewableenergyworld.com/rea/news/article/2015/04/al-gore-joins-teams-up-with-tea-party-to-fight-solar-hating-utilities?cmpid=WNL-Wednesday-April15-2015
Maybe there is some small glimmer of hope for us.LOL
Ps EDIT I don’t understand why this comment has appeared where it is . I thought it would come just below the cartoons about survival when I posted it.
Never heard of this Dooley person. There are about 80 Tea Party groups and all of them want to be on the receiving end of donations, and pretty much none of them speak for anyone but whoever is talking.
Making a case for this being some sort of bipartisan thing is weak.
Read the link.
Bipartisanship has to start small in order to get started at all.
The Tea Party movement is not quite what most people think it is. TP types are as wrong as wrong can get on some things but right as rain on others.
I do not follow TP politics closely but in every case I am aware of they stand for individual control rather than government control – or control by large monopolistic companies.
Electric utilities are about as monopolistic as it gets.
So TP types as a matter of principle are FOR small scale solar power and access to the grid for people who own their own solar systems.
Global realtime wind map.
You can zoom in and spin it.
Test
http://peakoilbarrel.com/north-dakota-bakken-february-production/comment-page-1/#comment-512341
This comment was in reply to the comment at the link.
This is in response to Nick’s request about electricity generation level in China
During the first quarter of 2015, China’s total electricity generation was 1310.3 Gigawatt-hours; including 1046.9 GWH from fossil fuels power plants and 171.5 GWH of hydro electricity.
This is a preliminary news release which does not provide data for nuclear, wind, solar, etc. A more detailed report will come out in about a week.
Thanks. Do we have similar data for the first quarter of 2014?
Bread was mentioned earlier and while bread and oil don’t have a lot in common one is referred to as the staff of life and the other as the lifeblood of civilization as we know it these days.
So – here is how you make REALLY good fast hillbilly style corn bread. It is WAY different from just about any corn bread made from cookbook recipes. .
Being well organized I make it in four minutes and thirty seconds without rushing.
ONE – turn oven on to 425
two- turn large burner on high
three put one quarter to one third stick of butter in ten inch well seasoned cast iron skillet used ONLY for bread on hot burner.
four -Put mixing bowl and milk jug on counter. Turn burner to medium .
five using one third cup scoop put two scoops general purpose self rising flour and three scoops self WHITE straight corn meal in bowl.
six Stir to mix ten seconds
Seven add one half to one cup milk.
eight Stir till well mixed and batter will pour readily. If you use minimal milk add a little cold water.
Nine pour batter in hot butter and replace skillet on burner while you wash the bowl. It will wash very easily indeed.
Ten put skillet in oven for about twenty five minutes.
Turn hot bread out when browned on a platter with a towel or a couple of forks under it to prevent condensation making it soggy.
You will find this bread has a nice chewy crust with great buttery flavor that goes extremely well with just about any kind of country cooking. You can slice it and make a sandwich with it but it will drop some crumbs if you use it for sandwiches. It drops only a few crumbs eaten in hand. Best served hot but ok for up to two days kept covered in a cool place. Past that it dries out too much.
If it sticks then your skillet is not yet seasoned properly or somebody has been cooking something in it other than bread.
Every old country woman has one skillet reserved exclusively for bread.
DO NOT WASH SKILLET. NOT necessary. Wipe with clean dry wash cloth or towel. Keep it covered when not in use. It DOES NOT NEED SOAP or DETERGENT on it unless you cook other things in it. Cast iron well seasoned and heated to four hundred plus degrees is sanitary. You can see yourself in my bread skillet which has been used just about every day for close to a hundred years now.
My folks used to grow their own grain and grind it at a mill owned by one of my great grandfathers but nowadays I get most of the groceries at a supermarket.
You can cook this corn bread on a stove top if you use a larger skillet so the same quantity of batter is not so deep in the skillet but you have to watch it carefully and turn it like a pancake.
This is budget gourmet survival food that will stick to your ribs doing field work..
where is Superman when you need him?
test
Here’s some music that is oil related. Guy Clark is a singer/songwriter from Texas, wherever that is.
Indulge yourselves and listen to Guy Clark sing Desperadoes Waiting For A Train:
https://www.youtube.com/watch?v=dFb1lGMvS3I
When you have 7 billion people and a year or so later you have 1 billion people, that’s not extinction. That’s not some magical die off.
That’s just physics. The food can’t move. There is no food for the people. They die. Faster because no one will tolerate it and will try to survive at the expense of whatever country is declared evil.
We’re not in Kansas anymore, so pay attention to the man behind the curtain.
https://www.dmr.nd.gov/oilgas/stats/historicalbakkenoilstats.pdf
Month 11, 2010, there are 2016 wells producing.
Month 2, 2015, there are 9166 wells producing.
Total wells added are 7150, 50 months.
7150/50=143 wells added each month for the average. Might want to consider slowing it down to half, might look like a crawl, but it’s good enough. 75 wells added each month is going to halve new production.
Month 12 of 2014 to month 2 of 2015 shows a 4.8 million barrel drop in production.
42 wells were fracked in February of 2015, added, total more towards 9200, providing no wells are shut.
Losing some ground on production, with more wells in the inventory. A decline rate of 2 or 3 percent per month, the daily output will be somewhere near 117 barrels per day for the average Bakken well.
117x9200x29=31 215 600 barrels of production in May. Have to subtract a day or even two for the variance of daily production for all those Bakken wells.
A six percent decline in per well production, 115 bpd, will be 30,682,000 barrels per month.
Month 12 of 2014 looks like the peak in production for the Bakken/Threeforks.
At this time, one can expect another decrease for April.
Unless they are sandbagging and holding back production to elevate the price, some finesse, remains to be seen, the production estimate for May is probably in the neighborhood of 29 million barrels produced for the month, under a million per day.
4.8 million barrels less from December of 2014 to February of 2015 seems to have achieved the goal of causing enough pull back in production to cause a ten or more dollar increase in the price of oil at today’s spot. If the price is all about what the Bakken does, the influence of the market force is there.
April and May decreases are already baked into the price.
A lower price for WTI under 55.50 could possibly cause another price reduction to under 45. Bakken production will no doubt decrease again, WTI gains more market share, price increases due to Bakken oil production losses and decreases. More gaming of the system.
Texas producers could have the ball in their court and don’t yet know it. Looks like a waiting game going on, gaming the market must be what’s going on.
Keep the wheat in the bin, the price will go up. You can take a loan, provide the wheat as collateral and still profit, maybe will influence the price of the wheat, you can wait for the wheat to be made into wheaties then another grain train will move to the coast for shipment to Korea. Sell half the wheat to satisfy have the loan, then wait again for stocks to deplete, food peaks everyday, it goes quick. Hold the other half to pay off the other half of the loan, the price will increase, then pocket what you can. You won’t lose.
Oil in the ground is just as good, ready to be fracked is even a bit better.
Keeping oil in the ground is a safer bet than trying to dump the stuff like milk in an unforgiving market.
Looks like competition in the market should be used as an advantage.
Just my ridiculous two cents. Can’t rodeo if you don’t ride. I’ve got Brahma fear.
Hey guys what do you make of this article on the front page of Bloomberg today:
http://www.bloomberg.com/news/articles/2015-04-16/big-oil-is-about-to-lose-control-of-the-auto-industry
In relation to the future electricity composition discussed above:
For those who have not yet got chance to look at EIA’s 2015 Annual Energy Outlook, EIA projects that the US will have 1,135 GW of generating capacity in 2040, including 253 GW of coal fired power plants (compared to 296 GW in 2013), 525 GW of various types of natural gas and oil-fired power plants, 105 GW of nuclear, 22 GW of pumped storage, 229 GW of renewables (including hydro).
It appears that EIA currently does not expect a major expansion of the renewables.
The above are from EIA, AEO 2015, Table A-9 (in page A-20)
The EIA also projects the USA won’t follow Obama emission pledges.
Once again: I thought there was a pretty strong consensus on this site that EIA forecasts aren’t useful.
In any case, it’s helpful to keep in mind that the EIA is an arm of government, which means that they deliberately use very, very conservative assumptions. Their “reference case” assumes NO NEW LEGISLATION OF ANY KIND, because….it’s the reference case (aka “baseline”) for any public policy changes.
EIA forecasts are very useful. They allow me to see what they are thinking, and what’s their competence level. And the recent 2015 forecast does show they think that USA will keep on chugging. There’s no mention of Obama’s plan, nor do they think renewables will do much. This information does bias the thinking of smaller countries, such as Waziria.
Well, sure, it’s kind’ve interesting to see what they think.
But, their forecasts are terrible, for our purposes. Surely we’ve seen that for oil production volumes and prices, right??
And, again – they’re not meant for us, they’re meant for Congress. They’re a baseline (especially the “reference case”), not a forecast.
http://www.nytimes.com/2015/04/16/business/ben-bernanke-will-work-with-citadel-a-hedge-fund-as-an-adviser.html?_r=0
Whether we’re collectively evolving or devolving, we can rest easily in the abiding comfort that Bubble Ben Shalom Zimbabwe is now a senior adviser at a hedge fund. But I wonder who’s advising Citadel about their new adviser? 😀
something happening here…
from Michael Klare……
The Renewable Revolution
Four Reasons Why the Transition From Fossil Fuels to a Green Energy Era Is Gaining Traction
http://www.tomdispatch.com/blog/175982/
Seriously folks we ought to take Fernando a bit more seriously because there are MILLIONS of well educated skeptics out there who are contemptuous of half assed propaganda put forth to further the case for warming.
When they see such obviously questionable arguments, they are doubly reinforced in believing there is no warming at all, or that it doesn’t matter if there is.
Should we take intelligent skeptics more seriously than this guy for example:
http://eaps.mit.edu/research/group/IGLab/bowring.html
Who is studying things like this:
http://eaps.mit.edu/research/group/IGLab/permian.html
Should I dismiss scientists such as Dr. Bowring as alarmists when they makes statements such as this?
https://beta.prx.org/stories/62079
There are thousands and thousands of scientists from extremely diverse fields who are telling us that we are impacting our biosphere in multiple ways. They are raising our awareness as to the possible consequences of our actions if we continue with BAU. Personally I don’t give a lagomorph’s ass about most of what is clearly alarmist propaganda. I know that it is out there and for me at least that changes reality not one wit. I also have no quarrel with legitimate skepticism. However since I can’t possibly do all the research myself I will tend to defer to the experts first and take what intelligent skeptics have to say, with a grain of salt or two.
lol.
What’s up Doc?
Talking about bunnies, read this and go down to the comments. Watch the reaction to my first comment about the rabbit extinction paper, and my subsequent response. Sometimes one tries to help out and gets really stupid responses.
https://theconversation.com/climate-change-threatens-more-than-two-thirds-of-rabbit-species-40281
I agree that that comment is a knee jerk reaction by someone who for whatever reason feels threatened by what you said. So what? It doesn’t change the fact that climate change is real and it is already having a verifiable impact on ecosystems and all kinds wildlife species.
Furthermore as someone else commented there is a link available to the actual paper and it makes clear that the author is using the IPCC’s scenario of a 3.6 C temperature increase by the end of the century as a basis for her conclusions.
Now while you may find that scenario implausible and wish to dismiss the IPCC as a fear mongering ideologically oriented political organization, (it may or may not be that). It again doesn’t change the fact that there are thousands upon thousands of reputable scientists with all kinds of specializations working in research institutes all over the world, publishing papers in peer reviewed scientific journals who seem to think that such scenarios are indeed plausible.
It could of course be possible that every last one of them is wrong and their fears completely unjustified but to be frank I find that to be a bit of a stretch.
I wanted the scenario named and described. I followed the links they provided and they took me to an old IPCC report with outdated scenarios. A better quality paper would provide the specific case, describe the CO2 concentrations it assumed, and link the ensemble results for such concentrations.
I suspect they just grabbed a very high emissions outdated CMIP3 ensemble and used it without giving it much thought.
Not sure how many are aware, but the NDIC has begun putting on Youtube the press conference that goes with the monthly release of North Dakota production data. The link to this month’s press conference about February’s data is below. Hopefully it embeds.
A couple of points of interest (from my perspective)…
At 2 minutes, Lynn Helms talks about the decrease in rig counts. He says he was surprised at the speed of the rig count decline since the operators originally told him they would release rigs as contracts expired, but instead the operators have been buying out rig contracts at large expense.
About 22 minutes 30 seconds in, there’s a question about the effect of the gas capture rules on oil production. Helms estimates that in February, about 9,000 bpd was curtailed in order to meet the requirements. He expects curtailment to go up to 12,000-13,000 bpd in the coming months.
At 27 minutes, there’s a question about which operators are primarily responsible for uncompleted wells. The only company Helms mentions by name is EOG, but he does say that within the next month “or so” there will be a new well category within the NDIC well data: NC, for “not completed.”
At 29 minutes, Helms discusses the issue of operators having to complete a well within one year of drilling. That statement isn’t completely true, but if the operators want to obtain another year to complete the well, they will have to file the paperwork and go through the bureaucracy of getting the well classified as temporarily abandoned. The NDIC hopes the regulatory burden will discourage the operators from going that route, but there’s no guarantee.
http://www.youtube.com/watch?v=BeRmIu5Gt3o
Regex, thanks for the input, as always, very helpful.
Thanks for the info indeed.
A couple of points of interest (from my perspective)…
At 2 minutes, Lynn Helms talks about the decrease in rig counts. He says he was surprised at the speed of the rig count decline since the operators originally told him they would release rigs as contracts expired, but instead the operators have been buying out rig contracts at large expense.
Can this be read a different way? The operators that could shut down drilling, even at a cost, did. The operators that found it too expensive to shut down drilling, drilled what they had to, and avoided completing when they could?
In other words, the uncompleted wells are not by choice but was just the was the last option available to the oil companies with their backs to a wall.
If the oil companies are being forced to operate like this, then the rig count may have a lot further to fall as longer term contracts expire, and oil companies may not be in a hurry to rehire the drilling rigs?
Toolpush, they could wait, then start again on a highly selective basis with a short term contract to drill key wells. I’ve also worked in shared rig operations, we had a single rig we passed back and forth between operators, using a common contract form, and a side agreement between companies, which can include services by one company for the other (in our case we provided warehousing, and fed and housed the other company personnel in our camp).
https://twitter.com/MiddleEastEye/status/588903553386864640/photo/1
Is the Middle East all about ideology or oil and water?
Testing.
Tango Alpha Kappa rubber duck.
https://twitter.com/MiddleEastEye/status/588903553386864640/photo/1
If people in the Middle East believe their problems and hence their conflicts are ideological, does that mean that they are not driven by climate, oil and water? Or is it a bit of all these things?
I think it’s both sectarian and ideological. A very poisonous mix. I see on CNN the Sunni rebels are inside Ramadi, and also inside the refinery grounds at Baiji. The Sunnis resent the Shiite domination imposed by the USA occupation. On the other hand the Shiites with the muscle to stop the Sunnis are led by Moqtada Al Sadr, and he is anathema to the USA, because he’s sponsored by the Iranians and happens to be a populist. Thus the fire rages in part by the sectarian divisions, and in part by politics, which are mostly driven by U.S. Embassy types. I don’t think it’s a cli ate issue at all.