A Guest Post by George Kaplan
Crude and Condensate Reserves
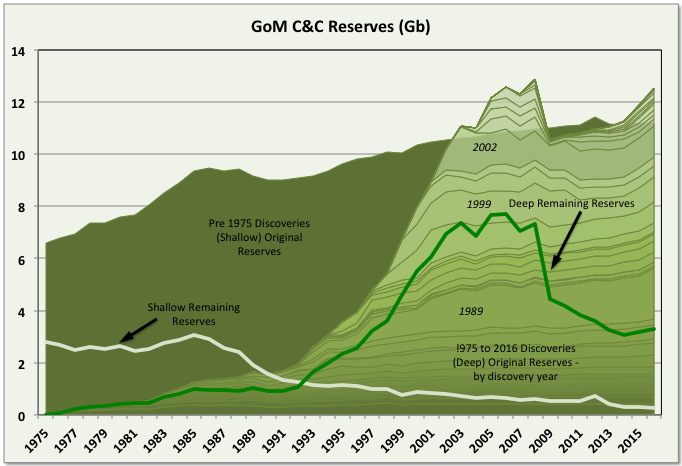
BOEM remaining C&C reserve estimates for GoM increased by 649 mmbbls for 2016 (i.e. to 31st December 2016). This was 112% reserve replacement and followed a similar growth of 618 mmbbls (111% reserve replacement) for 2015. The BOEM reserve calculation method appears to give highly conservative estimates. The increasing reserves followed several years, from 2006, of less than 100% reserve replacement, and actually negative numbers in 2006 and 2008. Current total original reserves (i.e. ultimate recovery) are a new high beating 2006 values, though deep water numbers are still below that year with the main growth appearing to be coming from: 1) older fields that were downgraded because of changes in SPE rules in 2007 (i.e. that reserves could only be booked if there were clear plans for their development within five years); and 2) newer discoveries, mostly smaller fields that are developed through tie-backs to existing hubs. These newer fields often do not get shown as new discoveries because BOEM records production and reserves against leases and each lease is recorded against a single field, even if there are deposits of different depth, age, geology and significant spacial separation within in it.
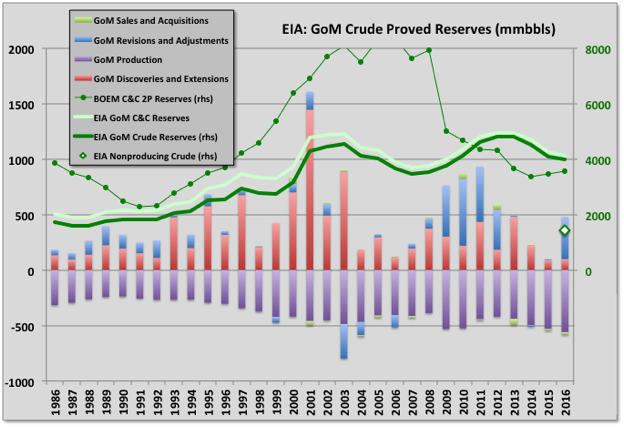
Current oil reserves are 3.569 Gb, which is 15% of the estimated original reserve (aka ultimate recovery). BOEM give the reserves as 2P (i.e. proven and probable) but they look very conservative and are actually lower than the EIA numbers, shown below, given for proven only and based on the operators own numbers, although the two are converging. The historical reserve histories look closer to how 1P (proven) numbers often appear, for example with some fields maintaining near constant R/P numbers, some showing large early drops that then come back over time, and some numbers being suspiciously low on fields obviously not near run out production rates (e.g. Mad Dog and Son of Bluto 2). I think the reserve calculations methods are fairly basic, given the amount of work required they couldn’t be much else, and use volumetric methods (i.e. reservoir area, depth, porosity, recovery factor) and previous decline data (I don’t now if the operators give them additional data such as well pressures).
Reserve Evolution History
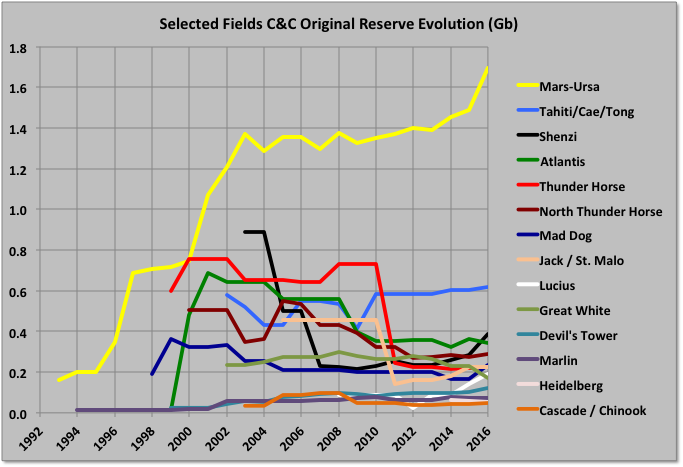
The Mars-Ursa fields have big original reserves, which have shown continuous growth. Other, large deep-water fields have mostly shown negative revisions from original reserve estimates, some quite large, though some of that is due to development timing (e.g. Mad Dog II reserves, when added, will likely recover all the earlier drop, and more). Shenzi has grown recently, and Atlantis will next year, both from new near field discoveries.
Individual Fields
The largest upward revisions in remaining reserves were for Shell’s Mars-Ursa field, which more than doubled the numbers (allowing for production). I think most of the gains came from new satellite fields at West Boreas and South Deimos, which are now on production, and possibly Kaikias, which has recently been started up. Other big gainers were Mad Dog, which had a very low number previously last year, and Shenzi, where BHP have made discoveries at Caicos and Shenzi North in the same lease blocks.
The largest downward revisions in ultimate recoveries were for Atlantis, Great White and Rigel. BP recently rescinded its lease at Rigel, which may be related, and the LLOG leases showed rapid decline rates before they went off line (presumably temporarily) because of the subsea manifold failure at Delta House. Great White has been gradually reduced in size by about 40% over the last ten years. Atlantis had a big write down in reserves after start-up, but BP announced a 200 mmbbls addition to resources in the area last year through new seismic technology, which is due to be developed in 2020 and presumably will be added in the next reserve numbers (in the mean time it looks likely the existing Atlantis wells will decline quite quickly).
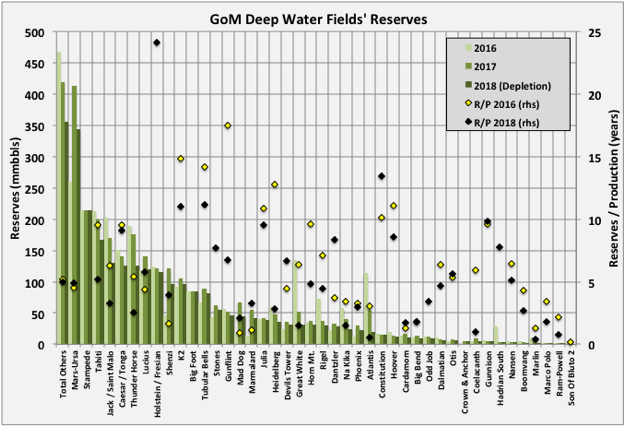
In the chart above the 2016 and 2017 reserves are the BOEM remaining oil reserves from the two latest estimates. The “2018 Depletion” data is the 2017 numbers less the 2017 production for that field, and the fields are ordered by that number. The R/P numbers are end of 2016 reserves divided by 2016 production, but for 2018 are the 2017 reserves less 2017 production divided by that production (to get the 2017 number add one to the R/P shown). Many R/Ps for the larger fields are in the range 4 to 6 years, which is equivalent to depletion rates, and therefore declines in exponential type well profiles, of around 16 to 25%, and that what has been typically seen recently. There are some very low numbers on fields with quite respectable production still, which probably indicates the reserves aren’t including some recent discoveries or revisions; for example Marlin has had recent tie-backs from Dorado and King fields, and Son of Bluto 2 (I don’t know what is happening there, it seems to be cycled now but in June cumulative production exceeded the recent BOEM original reserves estimate).
Caesar / Tonga and Tahiti are really a single field and BOEM report them as such, but it is spread over different leases and production is reported separately so I’ve prorated the numbers based on production.
The only two newly named fields for 2016 are small: Crown & Anchor at 5 mmbbls and Calliope at 2 mmbbls. Crown & Anchor production started through two wells in June and is likely to show fairly steep decline and a short life, maybe similar to Son of Bluto 2, also operated by LLOG. Similar small field tie backs are planned by LLOG for Claibourne, Red Zinger and Blue Wing Olive, though BOEM had no reserve numbers for these yet.
Hadrian South showed big relative downward revision, but still not enough as the field died without producing what was estimated (the difference in the natural gas estimates was much more marked than for condensate shown in the chart), I think some of the oil reserve shown is actually for Hadrian North and may now be shown against Lucius. The small Lena field showed an upward revision but actually has now been shutdown after no further production. Other, older fields showing significant growth were Who Dat, where subsea pumping is planned, and Crosby, I don’t know why but it is associated with Mars-Ursa and has production of only a few thousand barrels per day (the latest reserves and average 2018 production give it an R/P of almost 100 years).
Appomatox and associated fields were approved for development by Shell in 2016 so I’m unclear why they have not been included in the reserve numbers, presumably they will be added for 2017. The Mad Dog II project was approved last year, so that too should be added as well as the new Atlantis finds, therefore the replacement ratio should again exceed 100%, probably by more than the 2016 additions. After those there is Vito, approved this year, but then things will start to get leaner
Natural Gas Reserves
Natural gas original reserves are pretty much flat and remaining reserves are declining in line with production but with some revisions to associated gas numbers in line with changes to the oil numbers. I think there might be a bit of a downward revision next year because BOEM still carries a relatively large value for Hadrian South, which died mid 2017 without producing anything like the reserves given. There are still a few deep-water gas fields – Otis, Baldpate, Na Kika – but not much drilling, either for exploration or development, though Na Kika has a new tie back, Coulomb II, this year and Otis is having some activity (but is currently off-line due to the Delta House subsea failure).
Having said that the GoM, especially the shallow water area, was a pretty big gas resource and still produces significant amounts.
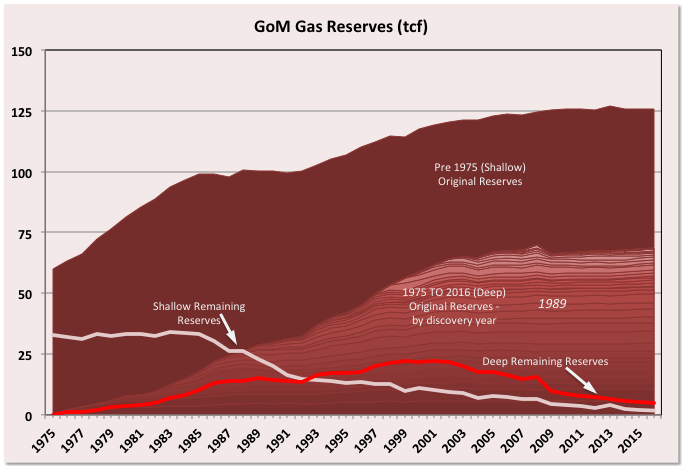
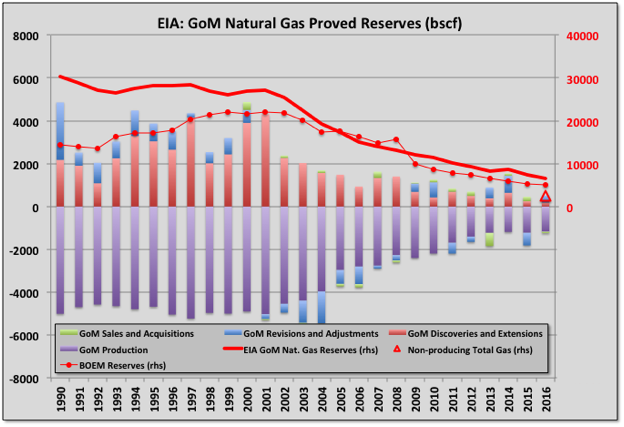
BOEM and EIA reserve estimates for gas agree much more closely than for oil. The chart shows that the non-producing reserves (i.e. mostly undeveloped associated gas) are relatively small now. A large proportion of the difference between BOEM and EIA are likely in these – e.g. for Vito, and Appomatox.
A Mature Basin
As well as the reserve curves given above leasing and drilling activity and recent discovery successes all indicate the GoM is a late stage mature basin for both shallow and, increasingly, deep-water areas. Actual production is possibly behind on the decline slope from where it might be expected, partly because the basin has been developed in three cycles: shallow, deep and ultra deep with some issues for the ultra-deep production because of technical issues in developing some uHP/HT fields (for example requiring 20 ksi wellheads and blowout preventers); but more because of the delays caused by hurricane damage in 2005 and, mostly, the drilling hiatus following the Deep Water Horizon accident in 2010.
Leasing
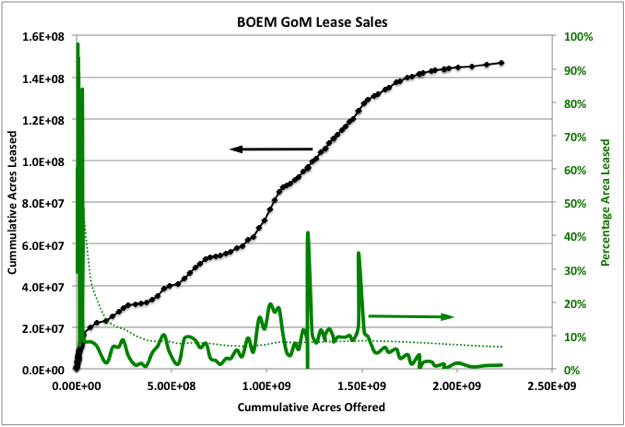
The remaining available exploitable acreage in the GoM is being offered for lease in approximately equal sized tranches every six months until March 2022. The sales so far made have been fairly consistent with about one percent of the land being leased (this compared with about eight percent average on the more prospective areas in earlier leases – the dashed green line shows the running average) and fairly modest bid prices. Some areas previously under moratoria may attract more attention but, equally, the most attractive areas are probably being offered first so interest levels may decline further.
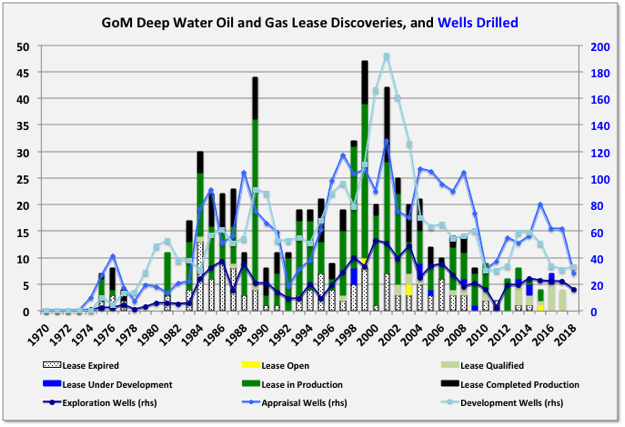
Discoveries
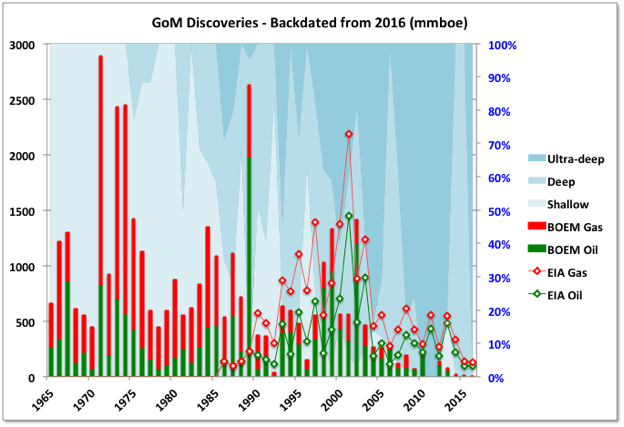
For the BOEM numbers discoveries are shown only if they are counted as reserves in the 2016 assessment. The recent drop off is not as severe as shown as: 1) there are a few likely discoveries still under appraisal before a final investment decision is made, 2) there have been a few approvals in 2017 and 2018 not included in the numbers shown which will get backdated once approved, and 3) as stated above, because reserves are booked against leases rather than fields, a number of significant recent discoveries get backdated to appear as reserve growth against the nominated field for a lease rather than later discoveries. The EIA discovery numbers, shown from 1986 for oil and 1990 for gas, give a better picture as they are by field, but they only show proven numbers and are not corrected with backdated revisions. The Mars-Ursa field highlights the difference in the approaches: the original 1989 discovery was relatively small and the big additions came from new fields in 2002 and after 2010 (as evident in the BOEM reserve history chart shown earlier). However using either EIA or BOEM the overall decline in discoveries since the 2000s is quite pronounced, and it will be interesting to see if high oil prices reverse the trend, the continued low level of exploration drilling (below) suggests not yet, if ever. The chart also shows the discoveries moving from shallow (less than 1000 feet) to deep to ultra deep (greater than 5000 feet). There might be some more shallow to come from sub-salt or newly leased areas, and there are still potential near field prospects for deep water, but ultra deep is the most likely area for expansion.
Drilling and Lease Development
Overall the number of open qualified deep-water leases available for new development is now pretty low. I think maybe only about fifteen that are not associated with producing fields, including North Platte, Shenandoah and Khaleesi / Mormont (Kings Landing) for LLOG, and the HP/HT fields at Anchor and associated with the Tigris hub for Chevron (there also are very small fields like Ourse, Mudbug and Calliope). No new leases have been added this year so far, though there have been a few reported recent discoveries, like Whale, Ballymore and Dover.
The North Sea is another mature (almost superannuated) basin. For the UK sector its late life is characterized by many small developments, usually tie backs; the GoM is more like the Norwegian sector with relatively fewer tie backs, and many of those recently being developed, but some major large projects still to come: for Norway Johan Sverdrup and Johan Castberg, and for the GoM Appomattox, Vito and Mad Dog under development, and Anchor, Tigris, Shenandoah, Kings Landing, North Platte and possibly others still to come. Most of these fields are technically and economically challenging because of high temperatures and pressures, difficult wells, and reservoir issues that can lead to low recoveries, and generally will have overall development times from discovery of more than ten years. Appomattox will be the largest development in the GoM, it has design nameplate of 175 kboed but Shell is already talking of debottlenecking to around 240.
I get the impression that the big four players – Shell, BP, Chevron and Anadarko – each have their main aim as maintaining an overall area production plateau, and that means accelerating the opportunities they have to compensate for high (and maybe accelerating) decline in their existing developments. The smaller players have mostly lost that battle now, with BHP joining them this year and expecting around 6% overall decline and Anadarko probably being the first of the big four to see clear reduction next year.
Shallow water drilling activity is very low now. Deep water is steadier, although the steady drop in discoveries means that appraisal drilling has shrunk significantly this year; typically appraisal wells are successful and are eventually tied in to new or existing hubs. Exploration wells are about the same as last year and development wells slightly higher.
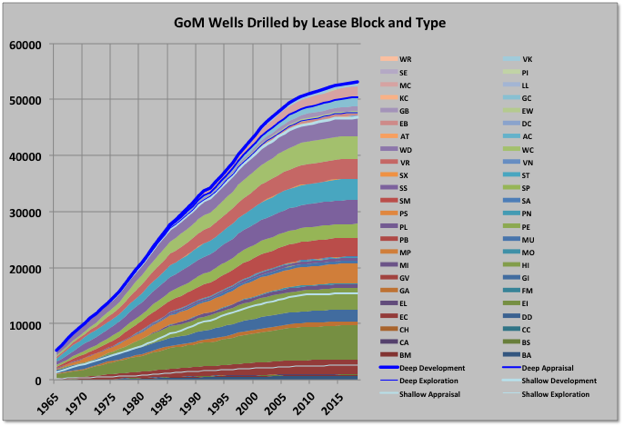
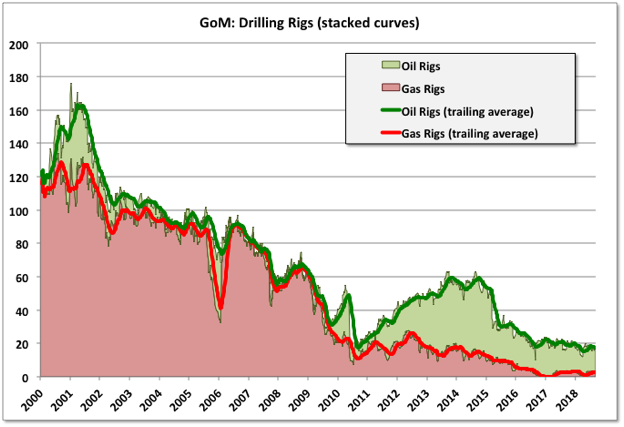
The creaming curves for wells in all areas clearly shows the basin is in the late life cycle (note deep wells include ultra-deep). Overall the well numbers will be slightly down on last year, which is as predicted at the start of the year. The active rig count by Baker-Hughes still shows a slightly declining trend, but part of that may be a current lack of suitable jack-ups for some drilling locations in shallow water (see Douglas-Westwood). Shell recently idled its rig on the Crosby field with six month remaining on contract and earlier in the year Anadarko cut short the contract on one of its three.
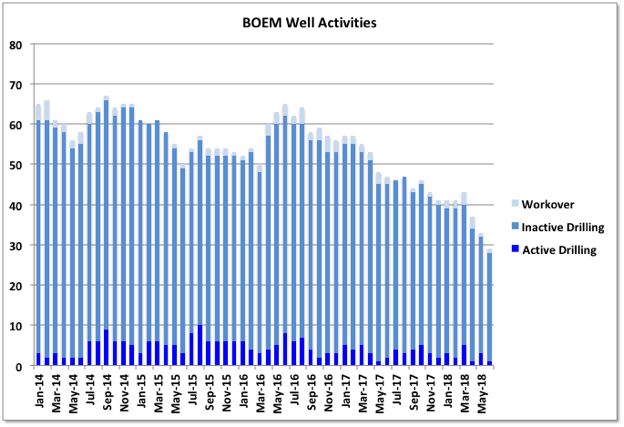
The number of wells shown as drilling or workover is dropping significantly, I think this reflects a number of previously drilled wells that have been tied in (e.g. a lot of the new LLOG production this year), though some may also be abandoned, combined with the drop in active rigs since 2016.
The current signs all indicate a continuing slow fall in activity and production. The tail maybe quite fat though as the GoM has plenty of infrastructure allowing economic small field development plus various different geological plays whose attractiveness may depend on new technology or changing cost/price dynamics. There some new activity in shelf areas looking at sub-salt prospects, and in the frontier areas nearer to the Mexican boundary, plus it will be interesting to see what the interest will be in the areas that have previously been under moratoria
Oil Production
EIA has June production at 1658 kbpd (up 157 kbpd or 10% m-o-m and 27 kbpd or 1.7% y-o-y). The BOEM number is 35 kbpd less at 1623 (a 6% m-o-m rise but 1.2% y-o-y decline). Typically the initial BOEM initial estimates are closer to the final value but EIA numbers are continually adjusted and end up matching the final well and lease data from the operators.
Spring months are traditionally when maintenance turnarounds are conducted for the major platforms. Great White field (processed on Perdido spar) and some of Mars-Ursa production was offline in April and May; Mad Dog was offline in May and part of June, Stones was offline for all of March through May. Most of those production outages have now returned. There are still some platforms and fields with lower than 100% availability (e.g. Mad Dog, Horn Mountain, Holstein, Rigel because of the Delta House subsea failure, Llano/Baldpate because of the Enchilada pipeline failure) but there always will be, so it remains a question how much production can grow further except from new wells; the coming numbers for July should show an increase on June but February might prove to be this year’s peak month.
The Stampede project continues to ramp-up, there are no actual production figures yet but it looks from the BOEM estimates to have reached about 50% of expected phase-one production so far. Some small additions in June came from the Crown and Anchor LLOG leases producing through two wells to the Anadarko operated Marlin platform.
Stampede, Lucius and Coelacanth (aka Hummingbird) have no production reported for several months and have been estimated to match BOEM total numbers.
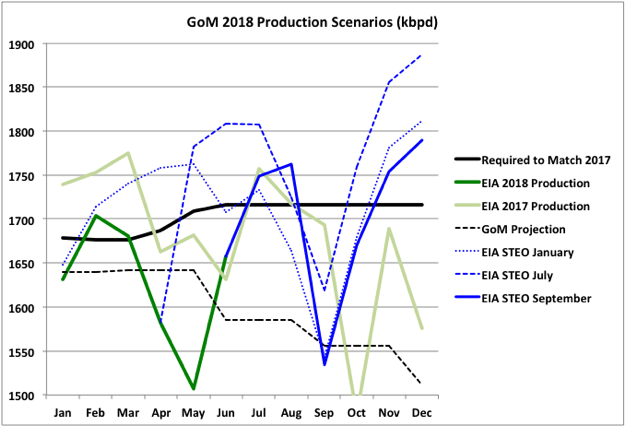
2018 production has so far been below 2017 for every month except June, which had a high maintenance load in 2017 (and it’s likely the final adjusted number will be lower there too if the BOEM estimates prove better). It has even averaged below my projection from earlier this year, which I expected to be a median-to-low estimate, and especially so as it did not included the Kaikias development that was accelerated by about a year; plus I had not realised some of the large developments (Jack, Tahiti, Great White) hadn’t quite finished ramp-up in 2017 and maybe I relied on the BOEM reserve numbers being less conservative than is becoming apparent. I think the projection will still be lower than actuality unless the overall average availability in the second half is particularly poor (e.g. hurricanes, late year turn arounds or unplanned maintenance).
The thick black line shows what the remaining production must average to exceed last year’s average, which looks unlikely, although it should catch up a bit. The EIA STEO forecasts updated each month must be generated by some algorithm because the future figures all change each release but I don’t know how. The start is always fixed to actual production (which may later be adjusted) and I think there is some compensation to try to match the expected yearly average – i.e. lower than predicted actual monthly production tends to lead to higher later forecasts – having said that though, the September numbers show a marked drop for both this year and next, and for the first time that I’ve seen they now have this years average production below that for last, it does of course still increase again next year.
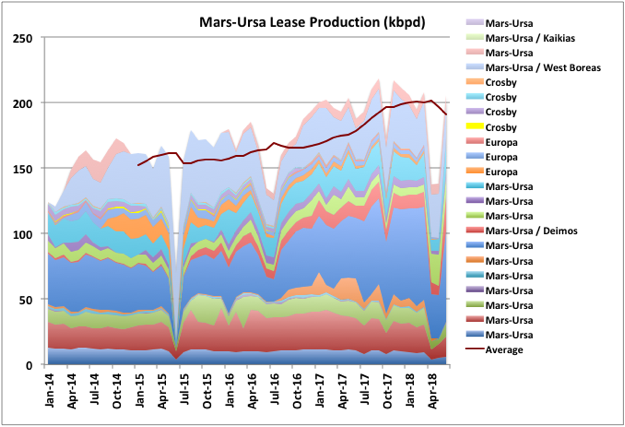
The Mars-Ursa complex, operated by Shell including two drilling and production TLPs, Mars and Olympus (Mars B), is the largest overall single producer in the GoM. The chart above shows the production by leases and fields. There has been significant production increase over the past couple of years. The West Boreas field is showing relatively rapid water breakthrough and the older leases are declining but there’s still continuous drilling with two or three rigs. Having an available platform based drilling rig for the largest fields usually results in better recoveries and longer plateaus, but can sometimes mean more rapid declines at end of life. The Kaikias development was started in May and is being ramped up, which I think will provide 40 kbpd; it will be interesting to see if that is enough to compensate for the declines in the other leases over the next year.
Two of the fields that showed relatively large increases in reserve estimate were Lucius and Marmalard, but that is maybe belied by their recent performance. Like a few recently started deep water fields Lucius wells show dramatic decline when water breakthrough starts. It’s unclear if new drilling will allow recovery of production, but it may be that the reserve increase is because of the planned development of the Hadrian North field through the platform. Dantzler, Gunflint and Heidelberg show similar behaviour following water breakthrough, and Heidelberg has had a large write down in reserves, which may mean there will be no phase II development there.
Stones looked like there was some unexpected water production initially, which has been stopped. It has not yet reached its nameplate capacity after a couple of years, its production history has been a bit erratic and it looks like it has been taken off-station recently, but there was a large increase in reserves and probably more upside potential yet as the recovery rate is in single figures. The FPSO for the field, Turritella, was supplied by, and originally leased from SBM, with Shell exercising a purchase option last year. There have been other SBM projects with operating issues (e.g. Tyr in Norway, where the platform was condemned, and Deep Panuke offshore Canada) so it will be interesting to see how the ExxonMobil FPSOs for Guyana, also to be leased from SBM, perform.
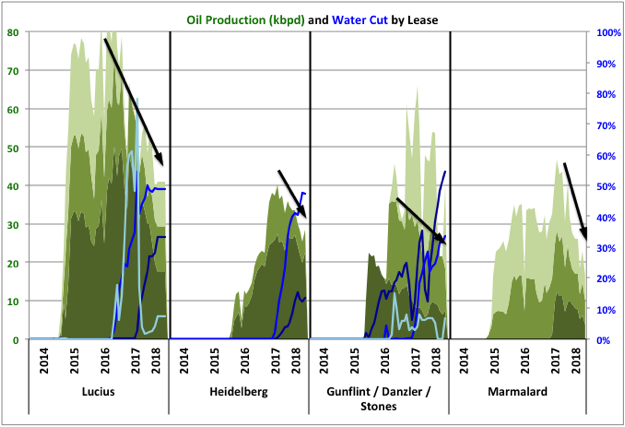
Marmalard has no water production but all three leases are declining quickly and maybe a bit faster than the remaining reserve estimates would warrant.
Natural Gas Production
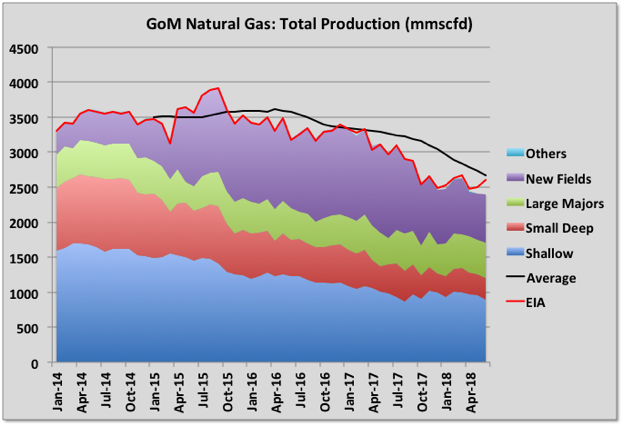
Gas production increased slightly in May because of the startup of the Coulomb II tie-back to Na Kika and again in June because of the restarts from some major turnarounds. June figure is 2604 mmscfd (down 12% y-o-y). Like oil the EIA gas production number is much higher than the BOEM estimate of 2439 mmscfd (down 17% y-o-y). There is general decline, especially in the shallow fields, but the main difference with last year has been the loss of Hadrian South production.
Off Topic Finish
There are a few coots’ nests on the rivers and quays around where I live. They are fascinating to watch. From what I can see, over a few seasons now, they build a small nest in early spring (often including a lot of human litter) and have a couple of chicks (or ducklings or whatever) and then the parents go completely bonkers for about a day making the nest much bigger with each adult seemingly trying to outdo the other; hence maybe the expression “queer as a coot” – in the mad sense of the word (they are not bald so I don’t know where that one comes from). With the bigger nest they sometimes have other chicks, I think mostly in pairs, but at some time it looks like one adult and some or all of the chicks just aren’t there any more, they may get eaten but it seems too regular for that, so I think they leave for pastures new. Sometime later the remaining chicks leave, sometimes there’s a lone adult (possibly a grown chick) swimming around looking a bit lost, then it goes too. I don’t know if the same adult pair come back to the same nest site the next year and I’ve been wondering if the nest building display has anything to do with which adults leave when.
Coots are also violently territorial, especially in mating season, and give vicious pecks on the back of the head to rivals (or they might be unwanted suitors or it’s just part of playing hard to get for all I know), which sends the victims under water for several seconds and several yards of swimming to get away. But I’ve also seen adults do the same thing to chicks – they’re swimming along, the adult feeds the chick every so often then the chick takes off, often trying to fly, the adult goes after it, a bit faster, and whack, right on the back of the head, then back to feeding as if nothing has happened. I don’t know the issue there – maybe the chick takes off first and the adult is reining in some youthful exuberance, but it looks more like the chick knows something is coming and sets off to get away. I guess they are closely related to moorhens and the chicks look particularly alike with red bills that then go pure white in an adult coot. I could Google it all, but it’s more interesting watching the nuances of the behaviour and trying to work it out myself, even if I get it wrong.

All of the above is, of course just, like, my opinion man, but for something that is a fact The Big Lebowski is twenty years old and there’s a new print out in cinemas.
https://www.worldoil.com/magazine/2018/september-2018/features/us-drilling-plateaus-modest-increase-seen-for-second-half
Overview of US activity in the short term. Rigs are less in the GOM, yet they are following the EIA line that production will be over 1.9 in 2019. That’s about 200k over its Feb 2018 high. It’s a hard one to estimate, but I think if I stick with 1.7, I will have a good chance of being close within 100k barrels?
Guym,
George has not updated his projection, but he seems to hint that there may be some new projects ramping up or being built, and some fields were down in the spring and have come back online. It is not clear whether these will be enough to keep output on a plateau or not as some of these may take 10 years to develop (for the ultra deep fields).
He does say he expects output will be between his previous projection and the most recent STEO projection, or at least that is my understanding of what he wrote. So I think 1.7 is probably close to what his current estimate would be for the 2018 average (though maybe 1.65 to 1.7 might be closer to his estimate, he didn’t guess at a number or I missed it).
I think more likely 1580 +/- 100, but July numbers should show better as they are likely to be at very high availability and the following months will show decline.
Thanks George for clarifying.
George, great post really! I enjoyed reading it.
I don’t understand the long term enthusiasm when the agencies are projecting production for mature basins. Sure, production can be increased given both a big effort and a time lag for a limited period of time.
kolbeinh – much appreciated, not sure I’ll do too many more so that’s a nice note to ease out on.
What happened to global crude oil production after the first peak in 2005?
http://crudeoilpeak.info/what-happened-to-crude-oil-production-after-the-first-peak-in-2005
Matt,
Taking the long view (past 36 years) output has increased at about 800 kb/d on average each year (linear trend on monthly EIA data from July 1982 to May 2018).
George,
What is the URR of the logistic from your chart? Also what is the cumulative output for that logistic through 2017?
Hmm,
Generally a least squares fit to a set of data is pretty standard, also there was no extrapolation in my chart above. I doubt that the linear trend will be followed beyond maybe 2020, I expect after that output will increase more slowly until reaching a peak in 2023 to 2027, but just a guess based on an intermediate URR between 2800 (Laherrere) and 3300 (USGS).
https://www.eia.gov/totalenergy/data/browser/xls.php?tbl=T11.01B&freq=m
Link above has the data used in my chart.
It doesn’t seem that future output would follow any particular logistic function (whether generalized or skewed).
And that chart tells you exactly nothing about what comes next. Extrapolation is the lousiest way to look at the future.
Look at what happened 2005-2010. Matt is right. Had it not been for US tight oil The Oil Drum would have been correct. Now the US tight oil cannot be repeated elsewhere because of lack of good plays and lack of financing muscle to overcome the losses and huge indebtment. So what will be the trick this time?
https://imgs.xkcd.com/comics/extrapolating.png
Carlos Diaz,
The chart has no extrapolation and none is assumed.
The point of the chart is to show what consumption growth for C+C has been for the past 36 years.
Often it is claimed that future growth in oil consumption will be 1000 to 1500 kb/d each year (there are various estimates, typically it is about 1200 kb/d for yearly consumption increase of “all liquids”). “All liquids” is a very poor metric for energy consumption because the energy content of different “liquids” (such as ethanol, NGL, or crude oil) are very different, so at minimum the “barrels” should be converted to “barrels of oil equivalent” to make the numbers more meaningful, but thus is seldom done.
One might object that output and consumption are not necessarily equal in the short run, and I agree. In the long run (36 years), the amount consumed and the amount produced will be fairly close to equal. Future growth in the consumption of oil is likely to be less than 800 kb/d each year, when that occurs will depend on the output of C+C, the price of oil, the rate of economic growth, and the rate of change in technology. All of these are impossible to predict.
The chart above makes no prediction and no extrapolation, it is historical.
I think you may have assumed that I expect the historical trend will continue in the future. I do not expect the historical trend will continue, I just don’t know.
If the historical trend in C+C output does continue (because the financial crisis that some expect any day does not happen for 5 or 10 years) my expectation is that it will end by 2020 with a gradual decrease in the rate of output growth to zero by 2023 to 2025, with a gradually accelerating decrease in output starting between 2025 to 2027 and reaching a 2 to 3% annual rate of decrease in C+C output by 2040 or so. Again too many variables to predict, a depression in 2030 to 2035 might result in more rapid decline for a few years due to lower consumption of oil and lower oil prices, likewise a rapid transition to electric land transport might reduce oil consumption and oil prices and lead to more rapid decline in oil output (this second possibility is likely after 2045 or so). I also believe an economic crisis about 5 years after peak C+C output is reached has more than a 50% probability.
Carlos,
After oil output rose more quickly than normal from 2002 to 2005, it then grew more slowly (or not at all) from 2005 to 2010 and yes tight oil and Iraqi oil output increased from 2011 to 2017.
There is room for continued growth in tight oil output for a few more years (until 2023), higher oil prices might lead to more intensive development in some OPEC nations and Russia, Brazil and Canada also have some room for growth over the next decade, but by 2023 to 2025 a peak is likely to have been reached in World output and it will be sooner if World oil resources are smaller than I estimate, perhaps as early as 2020 (assumes about 2900 Gb total C+C URR). My estimate is a URR of about 3100 Gb for C+C resources.
Outstanding reports Matt and George. Hats off!
International Energy Agency – Oil Market Report: 13 September 2018
Now available to non-subscribers, download from here: https://www.iea.org/oilmarketreport/omrpublic/currentreport/
Chart of OECD inventories: https://pbs.twimg.com/media/DoHFdnCW0AwvT2W.jpg
Chart of inventories for OECD Europe & the USA. It’s a monthly chart but for the USA there is also the weekly data point Sept 21st
https://pbs.twimg.com/media/DoHQePFXgAIns2n.jpg
News on GoM front: Chevron have dropped the Tigris project, which would have been a 100+ kbpd hub, collecting from a few fields, and rescinded the leases. Another disappointment on what looked like a promising deep water project like Kaskida, Shenandoah and Phobos in the last few years.
100+ kbpd is quite large, larger than most of the Recent Additions chart. This was it last year:
https://www.ogj.com/articles/print/volume-115/issue-5d/general-interest/early-work-stage-confirmed-for-tigris-anchor-prospects-in-gulf-of-mexico.html
Wonder what happened?
2018-09-27 (S&P Global Platts) Interview: Pemex’s CEO expects FID for four new fields in 2019
.
The company will not be able to achieve its (2018 production) goal because of water invading its Xanab shallow water field in Tabasco’s coastline. Xanab’s production has been in a freefall since January, decreasing its output by 68,200 b/d.
.
According to Mexico’s National Hydrocarbon Commission, Pemex requires an investment of at least $20 billion to be able to develop the acreage it won at hydrocarbon auction round zero.
According to CNH, this will allow Pemex to increase its crude oil production to 1.96 million b/d by 2022 from a bottom of 1.7 million b/d in 2020.
https://www.spglobal.com/platts/en/market-insights/latest-news/oil/092718-interview-pemexs-ceo-expects-fid-for-four-new-fields-in-2019
Production is faling at 150 kbpd per year (or more and accelerating I think), they are going to add 135 kbpd total, and in five years just about maintain current production. How does that add up?
They never say enough in news articles it’s just a few pieces of the jigsaw puzzle. They say that their production will bottom in 2020 but at a level only just below today (July was 1816 kb/day). I don’t know but I would guess that they’re being optimistic 🙂
Xanab peaked before January and the decline doesn’t look particularly extreme, though they haven’t issued individual field data for the last couple of months. Looks like they might have pulled on it quite hard.
Ok what can OPEC come up with?
https://oilprice.com/Latest-Energy-News/World-News/Saudi-Aramco-Set-To-Boost-Oil-Capacity-By-550000-Bpd-In-Q4.html
Saudi – 300k Kuhurais, 300k Manifa, possible 300k from joint Kuwait/Saudi fields, eventually. Or, 900k with no definite start dates.
UAE says it can boost its spare capacity by 500k by the end of the year.
SA says Iraq can go another 300k even under current internal problems, which seems iffy to me.
So, in the best case scenario, talk has it at around 1.7 million with absolutely no spare capacity. None of this has been pressed into the market yet. If they do, Ron’s guess of 2019 as Peak would be a better guess, I think.
Is that enough? Well, it looks like inventories are still dropping, so I doubt what OPEC + has done with a 500k increase has equaled it out, yet. Not so sure that it was done by production or out of inventory.
We still have demand increases coming up, and US and other can’t come close to meeting that. So, I would say in best case scenario, we are probably far short when you deduct Iran potential losses.
In other words, my calculations don’t match the pundits. Then again, I don’t get paid to do that, ergo, I am not an expert.
On another note, Sinopec is halving their Iranian oil purchases, which sent oil up another buck. India is going to be close to zero, so Iran’s sales may be mostly under tankers with their locators shut off.
There is just too much potentially bad news at the same time being ignored. I have a difficult time trusting the arabs. If they only could be clear about when the Khurais expansion (repeating for the 10th time it seems like) is online that would be a start. There is a saying that when making a deal with an arab, make sure you count your fingers afterwards… US production going upwards all the time, source EIA (presidental influence maybe?). Does LTO from Delaware (Permian) equal Brent/WTI quality oil or is the value the half of that? Have the pundits in the oil market used their fingers and toes for each country and counted in Venezuela and all the countless countries relying on offshore production showing a negative projectory? And what to make of the whole Iran situation? Do the US want oil prices to increase, do Iran want it or maybe the whole of OPEC+Russia want it? Because it is obvious that keeping Iran out of the game is going to make oil prices rice substantially. OECD inventory is held up at the expense of other countries outside OECD it seems from some sources. No wonder oil prices are rising against a wall of worry.
I too make a living on oil income in some way, so biased maybe. But facts are facts after all, everyone can scrutinize and judge what is thrown towards them by the media.
SA’s projection of Iraq’s capability seems more than iffy. 30k is less than 300k.
https://oilprice.com/Latest-Energy-News/World-News/Iraq-Aims-At-60000-Bpd-Production-At-Newly-Restarted-Oil-Field.html
And the 300k from joint SA/Kuwait fields is still just being discussed. They have preliminary approval on just 100k which will probably be after the end of the year.
Some weekly inventory numbers
Total of available weekly numbers https://pbs.twimg.com/media/DoKGWrgXoAAXWd7.jpg
Products https://pbs.twimg.com/media/DoKGMHnXsAAHj9S.jpg
Fujairah Inventory Data https://pbs.twimg.com/media/DoKHOG8XcAAiDYY.jpg
Japan https://pbs.twimg.com/media/DoKG0DVWsAABIOy.jpg
EIA Weekly U.S. Ending Stocks to Friday 21th September
Crude oil up +1.85 million barrels
Oil products up +2.34
Overall total, up +4.19
Natural Gas: Propane & NGPLs up +0.44
EIA 914 survey – US July crude production 10,964 kb/day vs 10,695 in June (revised from 10,674)
https://www.eia.gov/petroleum/production/#oil-tab
Gulf of Mexico: +189 kb/day
Texas: +46 kb/day
The average for the weekly numbers in July was 10,932 kb/day
Yeah, 914 is out, and it doesn’t look right at all. It’s almost 11 million. GOM up almost 200k, and there is little doubt in my mind that they are over on Texas by almost 200k, or at least 150k. They adjusted June production up, not down. Politics.
I can’t speak for GOM, George would be better at that. My estimate for July could be off by 50k, at any given month on first months production estimates. However, they are over Texas RRC posted second month production by 79k in June, which has not happened in the three years production I have compared. Even during Hurricane interruptions, of which we had none in July.
I guess this is what Perry meant when he said production going forward will match Iran droppages. Just change numbers, and everything balances out. I’d get thrown in jail for it, but it’s fine for the government.
Guym,
My estimates based on the EIA 914 for TX C+C in kb/d from Jan 2018 to July 2018 are:
3850
3976
4147
4201
4226
4394
4452
For July 2018, my estimate is 17 kb/d lower than the EIA estimate for Texas.
Note that much of the EIA increase in US output from June to July (about 300 kb/d by EIA estimate) is from a 189 kb/d increase in output in the GOM, my estimate is that Texas output increased by 58 kb/d. There were other increases (using EIA estimates) from Colorado (18 kb/d), New Mexico (13 kb/d), North Dakota (41 kb/d), Oklahoma (19 kb/d), all states where LTO output is important (besides Texas which has the largest LTO output).
The EIA monthly estimate for L48 onshore seems quite reasonable. I will let George Kaplan comment on the July 2018 GOM estimate, he knows far more than me for that area.
Well your entitled to your opinion. So am I.
You use secondary source data, and I use primary source data. The secondary source gets it from my primary source. Whatever the primary source reports by the second month is very close to final. So, to argue it further, I’ll wait until August numbers come out, and will look again. They are over in June to the tune of 79k barrels. About 59k barrels over of what I take to be a reasonable variation.
Guym,
Actually it is a different source and method.
You use RRC data and pending file, until recently you have found your method agrees fairly well with the EIA estimates. My method compares 914 survey data with drilling info data (which uses RRC and pending file data and perhaps a more sophisticated method than yours to come up with estimates), the 914 survey data is about 90.3% of the drilling info estimate on average from April 2015 to Jan 2018, to estimate from Jan 2018 to July 2018, I assume the 914 survey data is 90.3% of the actual output for those months. The 914 survey is based on the responses of large oil companies to the EIA survey and is independent of the RRC data. Rather than a secondary source, it is an alternative source of data for the most recent months, the EIA uses some other algorithm to estimate output as it is slightly different than my estimate.
I make no claim that my estimate is superior, simply an alternative estimate.
My Texas C+C estimate in kb/d (labelled DC) is compared with the EIA estimate from April 2015 to July 2018 in chart below.
And you get your drilling info data directly from them? Or, is it that data that is posted on the EIA site? Subscription to drilling info is pretty expensive, I hear. My comparison up to May with the EIA 914 looks comparable. We went through this all before. I said EIA looks like good numbers. Now they don’t.
Guym,
Do you think the drilling info data found at the EIA is incorrect?
Yes I know we have been through this before,
I checked some of my old data. The method works quite well. You have thought in the past the EIA data was bad and it was not. Perhaps this time you are correct.
We will know in a few months. The EIA monthly data is never perfect (especially the most recent month), but typically it’s within 50 kb/d of the correct result.
The most recent 5 months of drilling info data is not very accurate, but prior to that it is pretty good.
Generally I don’t comment because your estimates are pretty close to the EIA estimates, when you start to think they are way off, I check with a different method, to see if something seems amiss.
In this case the EIA estimate looks reasonable, though if there was a big change in output in the 10% of Texas output not covered by the 914 survey (about 432 kb/d in July), and this fell to say 299 kb/d from 374 kb/d in June, then your estimate would be correct. I just doubt the output from small producers has fallen by 20% in a month.
Could be wrong though.
Yeah, a I think all we can leave it is time will tell. For my purposes, it will be next month when the second month for July is posted. Although, George’s comment below tends to make me think I will find more support for my estimates, later. Small producers may only be part of the problem.
On a different note (but maybe not), I was the CFO with a CEO who had megalomaniac traits like Trump. I needed the money from the job, but not the daily stress. Finally just walked away with no immediate options. I just would not lower myself to make up numbers. The immediate relief was tremendous, it was an emotional strain to put up with the irrational outbursts. But, there were repercussions, megalomaniacs like him, cannot stand it when someone wants to leave, so for a long time afterward, I was blamed for about every problem that came up. I can see this same trait with him. Story ended two years later with a very bad story for the Corp. I am glad I made that decision, but it hurt financially, at the time.
Guym,
I think your estimate for June may be 4344 kb/d, my estimate is 4392 kb/d, so we are within 48 kb/d through June. On July we will check back next month, currently our methods give very different estimates for July, with mine being 193 kb/d higher than yours. My guess is that your estimate using second month data when next month’s data comes out will be 4400+/-20 kb/d for July 2018 Texas C+C output.
Hi Guym,
I retired a couple of years ago after working for the same kind of CEO. It was a good, well paying job, but I felt a million percent better and my health improved. I also fortunately had saved all of my life enabling me to now farm most of the time. I would never go back to working for someone else.
Well, if you use EIA’s data on their site to check if I’m wrong, or Dean’s wrong using primary data, what can I say? Dean’s is a good estimate based on partial preliminary data. Mine is an estimate based on more complete primary data. The second month is very little of an estimate, it is most of the data that will ever be reported on the primary site. Companies do report production to the RRC within two months, with minor exceptions. They have to, royalty owners demand it, and so does the State. A 79k variation is over 2 million barrels of oil that would be unreported. Always possible, but not likely. If it happens again next month, but higher, the probability that EIA is correct would be highly suspect.
Guym,
The pending lease data is pretty messy,
I do not doubt that the data for every barrel produced is in the RRC database somewhere, by the second month. I just question whether it is easy to determine what it is for all of Texas. Your estimates for Texas output from Jan 2018 to June 2018 went from being higher than the EIA estimates to being lower, my method is simply an alternative based on the 914 survey data. I am not suggesting your estimate is “wrong”, just different.
The pending lease data file seems to repeat output for many leases reported in the main RRC database, it is not easy to determine which leases are reported twice.
Not a problem for an individual lease owner looking up individual leases, but when we roll up all that data for a Total estimate for the state, it is a problem.
Yeah, I remember you saying it was “messy”. It’s really only good the first few months, then the other problems become more pronounced. But, the logic is that the RRC data would show more production, not less. It does, over time, because of those problems, which I pointed out to you. But, it’s only a friendly argument, and time will tell. But, it will be way after election time before I am proven wrong, if I am. Right or wrong, it wouldn’t make a issue for traders, anyway. Most of them do not read it, anyway. The bigger issue is that it would keep OPEC from raising production, because they do read it. Although, my belief is OPEC is not interested in keeping prices low, anyway. If it’s hokey, it’s completely counterproductive. But, more or less, a tempest in a teapot. Though, that would not be a new action by this administration.
There is no reply button available to your comment below. The Texas production increases over time as reported on the website, due to well data from the pending data file being moved over. Late reportings are not substantial. It’s an EIA wives tale. And, I am not changing my estimate of 4257k for July to agree with you, yet. It may balance out later, like before, but it is what it is. I said my estimate for June was 4364, and second month RRC had 4344, so little argument, there. But note, EIA has 4423.
Guym,
My estimate is a bit lower than the EIA’s estimate and a bit higher than yours, the correct number is the eventual RRC reported data, but that usually increases gradually over the 18 months after the data is originally reported.
Chart below compares your method (second month data) with mine using EIA 914 survey and drilling info data from August 2017 to June 2018. The average output for your method is 3919 kb/d over the period, for my estimation method it is 3909 kb/d over the same period.
Basically it seems the data has a bit of noise so we can only approximate to about +/-50 kb/d, if we arrive at different estimates (especially for second month) the right answer may be between our estimates, so for June, perhaps 4366+/-25 kb/d may be a good guess, in my opinion.
Oh and on the July estimate, when one considers the 914 survey reported data for June and July, it is clear that for the producers that produce about 90% of Texas output (large companies only), output increased by about 52 kb/d, perhaps the other smaller producers saw big downturn in output, was there a big change from June to July in the number of active wells in Texas (not sure if this gets reported). In Feb 2018 about 29% of wells were shut in in Texas, couldn’t find more recent data. I agree waiting a month will tell us more. The most recent month is always difficult to guess, but the large producers reported 4020 kb/d to the EIA in the 914 survey, the smaller producers are more difficult to add up, probably somewhere from 237 to 427 kb/d.
Baker Hughes US rig count
Oil -3 to 863
Nat Gas +3 to 189
Permian: -2 to 486
Cana Woodford +7
Canada
Oil -13 to 122
Nat Gas -6 to 56
Nat Gas rigs https://pbs.twimg.com/media/DoMqJ2AXUAcK_Ag.jpg
Oil rigs https://pbs.twimg.com/media/DoMqNhQXgAAGR3U.jpg
BH –> http://phx.corporate-ir.net/phoenix.zhtml?c=79687&p=irol-reportsother
July’s GOM production of ~1.85 mmbopd is an all time monthly high. Certainly higher than I expected. Not sure if 2018 will exceed 2017 in terms of yearly production, but if GOM averages over 1.7 for the rest of the year, it will. 2017 averaged about 1.68 mmbopd. Through July, 2018 the average is about 1.67.
SouthLaGeo,
Does the 1.85 Mb/d estimate for GOM in July seem reasonable?
In March , April, and May 2018 the BOEM actually reports higher output than reported by the EIA for GOM, but for June the BOEM estimate is lower than the EIA estimate (by about 37 kb/d). I know much less about what might be possible in the GOM than you or Mr. Kaplan.
I wouldn’t expect the “final” number to be too different – certainly over 1.8. While it is higher than I expected, it isn’t unreasonable. It shows what the GOM is capable of.
As George commented, a number of fields had shutins in previous months and are back on production. And a number of the bigger fields are seeing the benefits of increased production from new wells. Chevron’s Jack St.Malo facility is at or near nameplate of ~170 kbopd with production from those fields plus Exxon’s Julia. Mad Dog is back on production after May-June shutin, now around 70 kbopd. Caesar Tonga and Tahiti are both near record high levels of production – about 150 kbopd total.
I’d like to see the July field-by-field breakdown of the biggest fields – those mentioned above plus Thunderhorse/THN, Atlantis, Mars/Ursa.
Thanks SouthLaGeo.
It’s a big increase and a bit hard to understand. There wasn’t that much offline in June and there would need to be about 30 new typical wells started to make the difference – or maybe a couple of monster Thunder Horse/Mocando type is more likely (Kaikias or Jack?). Even then I don’t know where the processing capacity would be. The June numbers for EIA looked about 30 high based on individual lease numbers but they’ve actually been revised up. The BOEM numbers on Monday will be interesting but there are a lot ot well values out already so any increase would be in one of the late reporting fields – Lucius, Stampede, Hummingbird, Jack, Kaikias – and they may still be late (i.e. the increase is mostly in EIA estimates for unreported leases and may not be verifiable for a couple of months yet)..
SouthLaGeo,
An alternative estimate to the EIA for Jan 2018 to July 2018 below, just takes “914 survey reported” data compared to “Current Reported State data” from Sept 2016 to Nov 2017 with survey data averaging about 97.8% of state data over that period. Then simply dividing 914 survey reported data by 0.978, I get the following estimate for Jan 2018 to July 2018 (in kb/d):
1600
1672
1647
1551
1472
1624
1810
On average these estimates are about 34 kb/d lower than the EIA estimates for each month in 2018. Overall the 2018 average from Jan to July is 1625 kb/d for this estimate vs 1659 kb/d for the EIA estimate.
Simplistic view, but relevant. OPEC is not interested in containing prices, and Trump is powerless to stop them. Though I hope he will not give up his tweets. I find them intellectually stimulating?
https://thehill.com/opinion/energy-environment/408938-the-upward-march-of-oil-prices-shows-few-signs-of-stopping?amp
Canada, Alberta AER, Total Crude Oil and Equivalent Production at 3,729 thousand barrels per day in August, up +240 kb/day month/month
Up +545 kb/day from the average during 2017 which was 3,184 kb/day
(2017 August 3,406 kb/day)
https://pbs.twimg.com/media/DoQBCmsXcAA3r1w.jpg
Upgraded +123 kb/day month/month
Non-upgraded +96 kb/day month/month
Crude Oil + Condensate +22 kb/day month/month
https://pbs.twimg.com/media/DoQBSS8WsAA9XqJ.jpg
Canada, Alberta AER, crude oil closing stocks at 75,081 thousand barrels in August, up +6,623 kb month/month
Up over +16 million barrels from 2017
https://pbs.twimg.com/media/DoQBp5eWsAAJD4K.jpg
I have an unconfirmed report that Venezuela production will be less than 1 mmbopd for August. This is from a single contact who lives in Colombia. My estimate has been 1,1 mmbopd average for december. If this drop is confirmed this means there is active sabotage and the regime is collapsing.
If you don’t get enough to eat, you don’t actively have to interfere with your job, it happens, naturally.
Thanks for the input, Fernando.
Wishing for the best for your Venezuelan friends.
Traveling in circles. We have gone from burning wood for energy to burning wood for energy.
https://oilprice.com/Alternative-Energy/Biofuels/Bioscience-Breakthrough-Turns-Plant-Waste-Into-Gasoline.html
Ain’t modern day alchemy wonderful?
Horizontal boom affecting stripper wells in the Permian. This article is on the NM side of the Permian, but I am sure it is much more prevalent on the Texas side. Besides the small horizontal producer who is being forced to shut in their wells due to transportation problems, how many of the stripper we’ll operators will have to do the same thing? In the Texas Permian, which has operated for many decades, the stripper well would make up probably more than 10% of the production prior to the horizontals. How much is that? The article gives us a hint, but no hard numbers. It’s something to think about instead of just looking at horizontal well output. The output drop would be made up for by increases in horizontals, for sure. But that would mean horizontal growth would not be without a deduction.
https://www.abqjournal.com/1159236/tectonic-shift-rumbling-across-southeast-nms-oil-patch.html/amp
Guym,
EIA has data on oil well production rate distribution in Texas through 2016 (see appendix C link below).
https://www.eia.gov/petroleum/wells/
For 2016, 75% of all TX oil wells had output of 10 bopd or less, total wells were 133,495. Output from these wells was 8.93% of total TX oil output and average output from these wells was 2 b/d. If we jump to the slightly higher 15 bopd or less category, we have 81% of total Texas wells (142,733 wells with 15 bopd or lower output), and those wells produced 12.3% of all Texas oil output in 2016, average rate of output for that group was 2.5 bopd. Total oil wells in 2016 were 175,808 wells and the top 25% of oil wells (in rate terms) or 42,313 wells, produced 91% of total output.
To make a guess at hard numbers, if output was 4300 kb/d in July 2018 in Texas and wells with 12 b/d or less output produced 10% of Texas output and there were 150,000 of those wells producing (the guess is based on the 2016 oil well rate distribution), then we would have average output of 2.9 b/d for those wells.
Bloomberg article on SA spare capacity and storage that I found interesting: https://www.bloomberg.com/news/articles/2018-09-28/saudi-arabia-faces-the-ultimate-oil-test-producing-at-the-limit
Particularly the part on storage and satellite:
“Antoine Halff, an executive at Kayrros, a company that uses satellite data to track storage, takes issue with the Saudi numbers.
“From the sky, we see 70 million barrels in storage,” he said, out of the 125 million barrels that the kingdom can store in 231 tanks spread across with terminals and refineries. “We don’t see anything extraordinary either in Saudi overseas tanks.”
Do they have any significant underground storage? 70 mb left is big “oops”…
Looks like I was wrong about Khurais coming on in June, wonder where they did get the oil, and why it was so late (almost three years I think, maybe they just delayed it when the cuts started). Also when is there going to be something to tie together lack of spare capacity, lack of discoveries and lack of new project starts not in the big five OPEC, which is what is going to be important in 2019 and 2020.
Not strictly oil-related, but perhaps somewhat.
Want to see what oil can buy?
Norway is spending 47 billion dollars on a single highway. It will go along the coast and much of it will be underwater. Hundreds of feet underwater.
Do a search for B1M on youtube. This is what you can do when your Sovereign Wealth Fund is one trillion dollars, funded by oil.
I went looking for it.
The video included in this article covers it. It strikes me as pretty insane to spend so much money to connect some islands in a relatively small country. Talk about counting on business as usual for your future. Imagine what else could be done with that money instead.
https://drivemag.com/news/norway-will-spend-47bn-to-create-1-100-km-long-coastal-highway#lg=1
Insane? Maybe. But to be fair, it is connecting the largest cities/towns #2, #3 #4, #5 and important industry regions. Today the trip take ages to cross due to the fjords / ferries and mountains.
The official numbers for July confirm previous estimates from the various news agencies that world crude oil production is breaking out to new record highs.
And from the numbers released so far for August, world production is higher in August
Chart: https://pbs.twimg.com/media/DoU-sfYXgAE7XAZ.jpg
This is the EIA’s version, it contains more countries but it’s only up to June
https://pbs.twimg.com/media/DoU-3nsXcAUEmcm.jpg
An update to July for the UK
https://pbs.twimg.com/media/DoVOFlTXoAAsOmu.jpg
Unless Clair Ridge gets going quickly it looks like UK will be around 50 kbpd down on predictions for the yearly average.
Came across this piece.
https://cleantechnica.com/2018/09/25/tesla-an-uncomfortable-wake-up-call-for-germany-all-hands-on-deck/
I am supposed to be getting my Tesla Model 3 soon, Long rang battery AWD, will post a picture when it arrives.
Keep us updated Dennis.
I’m curious as to how this unfolds.
I have some real time experience with this in NorCal.
Hightrekker,
Was hoping to get the car today, was just notified the home delivery will be delayed until midweek.
I really didn’t think I would get one before Dec 31, so I am pretty happy. Frustrating when you expect to get it by month’s end (as the delivery specialist told me), but problem with delivery truck, first world problem.
You should do a little reading about all the problems with Model 3.
Tesla is a fraud. Will be bankrupt soon. Has some debt maturities in the coming quarters.
You should post a link of the documents you have in mind instead of just wild accusations.
If Tesla is a fraud, it’s certainly the “long con”. The company has been around for fifteen years. Saying they are going bust next quarter without any real evidence is a bit like the Jesus freaks saying the end is nigh. They’ve been saying it for 2000 years, so I’m not holding my breath.
LOL. Even if Tesla goes bankrupt, someone will make after market parts. As it was the forefront in EV, it would no doubt become a classic much sooner than most. Take a look at what the Edsel models sell for, now. If your happy with it, who cares what someone else says.
Enjoy the unique driving experience Dennis. Five years from now they will be much more common.
Well, now you will not have to worry about the price of the black liquid?
Hey Dennis, you must have been part of the push to deliver record numbers for the end of Q3. I read about the logistics hell over at insideevs.com. Tesla was considering building their own car carriers to alleviate the shortage!
At any rate the Q3 numbers are out over at insideevs.com with a total of more than 83,000 units for the quarter. According to the insideevs Monthly Plug-In Sales Scorecard, in the month of September Tesla delivered an estimated 22,250 units of the Model 3, 3,750 Model S and 3,975 Model X for a total of just under 30,000 vehicles.
Why am I posting this on a petroleum thread? People who are not interested in non-petroleum topics should be aware of stuff that is happening that has the potential to significantly impact demand for petroleum products in the future. Tesla is on the verge of leading a major disruption of the automobile markets. For the month of September, In Norway, 60% Of New Vehicle Sales Were Plug-In Electric Cars.
I have discussed writing an update to an article that I submitted to theoildrum.com more than 9 years ago with Dennis. I have been waiting for an opportune time to put all the current developments together but, the last couple of weeks has seen a frenetic pace of announcements coming out of the Internationale Automobil-Ausstellung (IAA – International Automobile Exhibition) Commercial Vehicle show in Hanover Germany and has seen a deluge of new information that I will need to assimilate. Needles to say, just about every major truck manufacturer has battery electric vehicles (trucks, buses and vans) either available now or scheduled for first deliveries by 2020.
Barring a black swan event, EVs should start having a significant impact on demand for petroleum products by the middle of the next decade, maybe sooner.
Cure for post Peak Oil = don’t burn it as a fuel= EV = less oil, no problem
Here an owner of an EV goes through the costs of running an electric car. Note that he compares it to a 50 mpg ICE car to see the savings.
True Running Costs Of An Electric Car!
https://www.youtube.com/watch?v=XWg5tGyvq5U
I personally know 5 people with one of the various Tesla models, and all are very pleased with their purchase. Enjoy.
Thanks everyone,
Hopefully tomorrow around 3 PM, fingers crossed.
I have test driven the Model S and rented a Model 3 for a day. Both very nice cars.
Yet another delivery mishap has delayed my vehicle delivery.
Unfortunately, I would have to pay the higher Massachusetts sales tax (an extra 0.75% compared to my state), so they are delivering to my home to avoid this, saving me a 8 hour round trip to pick up the car as well.
Problem is they seem to have trouble driving the car onto a car carrier and actually getting it to me. Eventually I imagine they will figure out how to do this, but in the mean time it is frustrating. Maybe by December… 🙂
https://www.houstonchronicle.com/business/energy/amp/As-pipeline-shortage-slows-Permian-output-sand-13264406.php
Tale of two cities. And both are the same city.
Guym,
The article mentions an EIA estimate of DUCs, shaleprofile.com has Permian basin DUCs at 1964 in Dec 2017 and at 1072 in May 2018, is there any data on this at RRC? Not sure why the big difference between shaleprofile and EIA estimates.
I couldn’t find information on drilling at RRC (only completion data), but I found some well distribution data at
http://www.rrc.state.tx.us/oil-gas/research-and-statistics/well-information/well-distribution-tables-well-counts-by-type-and-status/
About 464 fewer stripper wells (10 b/d or less) in July vs June, and 1235 fewer active oil wells in July vs June, with 867 of the wells between 10 and 100 b/d of output. About 464 of the stripper wells would reduce output by about 0.9 kb/d. The other 867 wells would need average output of 114 b/d to account for a 100 kb/d decrease in output.
BYU analytics has 1500 DUCs the end of June. On the other note, EIAs drilling info file can be off by timing for June. Drilling info would have to pull June’s info from RRC during a less than two week period and then get it to EIA who would have to post it on their site within that time frame. Somewhat unlikely it has the corrected data from drilling info by that time. For July, it is only an estimate, it has the same timeline. What alternative would drilling info have to do, but to project production from shut ins even if it is more timely than my guess? There is no vehicle from RRC to have shut in wells reported that I know of. I didn’t say stripper wells were the only cause of a drop, only a possible factor. Is it potentially possible? Yeah, new production can increase production easily 100k within a month, the next month 100k gets kicked off the pipeline and has to shut in, as there is no economically viable method to move it. Then it is likely to go back up the next month. Thats why I said it is likely to go up and down until the 90k additional pipeline is working. Or, just maybe, completions for the month did not keep up with declines. It’s only a guess. That’s all we have to work with, and I no longer trust EIA for most of the data, including monthlies. But, that’s just me, and I choose to trust RRC more than EIA. And from George’s statement on GOM, I will continue to use 1.7, not 1.8whatever. As I put what EIA has to say equivalent to the credibility of the National Inquirer, or the Mirror.
Woodmac is using, what they quote as an EIA estimate, and saying Permian production is at 3.6, or 800k over Dec31 numbers. That’s their prerogative. I think it mostly belongs with the cow patties. As, I think production will not get that high this year.
Guym,
I agree the EIA’s forecasts such as the STEO are not good, and the weekly production estimates are also not very good, and the Drilling Productivity report (which is more of a model or forecast) is also not very good. On all of that we may agree.
I disagree that the EIA monthly data is not good, it is as good for the most recent month reported (or better) than the RRC data, for the “second month” as you call it or what I would describe as the month before the most recent month, the EIA data is pretty good, maybe 50 kb/d too high at most, often it is on the money.
Currently the EIA 914 reported survey data is about 90.3% of the drilling info data from April 2015 to Dec 2017, if we take the 914 survey data (direct information reported to the EIA on the 914 survey by the largest oil producers that produce about 90% of Texas output on average) and divide by 0.903, the estimate is quite similar to your second month estimate using RRC data. In fact the average of my estimate for Jan to Jun 2018 is 4128 kb/d and yours is 4141 kb/d for TX C+C. Not really a big difference. The EIA estimates are not perfect, no estimate is.
WoodMac must be using the Drilling Productivity report, which is not good.
Through August, Permian tight oil has increased 528 kb/d since Dec by EIA tight oil estimates to reach 2812 kb/d, this does not include conventional output.
When you say over 90% coverage, is that from EIA’s calculation? The top 35 producers last year in Texas accounted for 71% of production, with the bottom producers each representing close to .5%. Supposedly, through their methodology, they survey about 450 producers nationwide, to try to account for 85% of the production. And, if their results seem inconsistent with what they expect, they go back to drilling info estimates. Ok. About that 914 from xyz company with one hundred k production for the month, does it look too low from last month???? Yeah, it’s inexact, drilling info is inexact, yours is inexact, mine is inexact, and Dean’s and everyone else’s is inexact. And I doubt any difference is intentionally political, but it does make a difference when you are given the marching order of use the higher estimate if there is any question.
Guym,
Usually the drilling info information is pretty accurate about 6 months before the most recent month. So the 90.3% is the average of the 914 survey reported divided by the drilling info estimate from April 2015 to Dec 2017, as to how many companies are surveyed in Texas, I do not know, only what the data shows for 914 reported output compared to the drilling info estimate.
See
https://www.eia.gov/petroleum/production/xls/comp-stat-oil.xlsx
Take column B divided by column F in the spreadsheet for April 2015 to Dec 2017, then take the average, it is 0.9033. Than take column B and divide by 0.9033 to get my estimate for Texas C+C output from Jan 2018 to July 2018.
I get:
3849
3974
4146
4200
4225
4393
4450
Average for first 7 months of 2018 is 4177 kb/d. Generally the EIA 914 estimate is about 15 to 50 kb/d higher than the final RRC estimate, from May 2015 to June 2016 the 914 estimate was 28 kb/d higher than the RRC estimate on average.
Guym – from BOEM well numbers looks like EIA numbers will hold. Availability is pretty much at 100%. Delta House came back on line and ther were big additions to Mars (maybe Kaikias but I’m not sure, they do a lot of drilling there) and Thunder Horse. I don’t know for the rest of the year, depends on hurricanes and there were turn arounds reported as planned for Jack and Shenzi but they haven’t happened yet.
https://www.nasdaq.com/article/canada-heavy-crude-discount-hits-widest-level-on-record-20180924-01158/amp
Wow, less than $30 a barrel.
Some more Canadian oil prices from http://www.oilprice.com, even the prices of the better grades are down.
Syncrude Sweet Premium $54.75
Central Alberta $46.25
Western Canadian Select $30.75
Only one possibility to keep the business rolling: pump even more…
crazy times
Art Berman has us in a surplus next year.
https://oilprice.com/Energy/Crude-Oil/Ignore-The-Hype-Oil-Prices-Arent-Going-Back-To-100.html
I think that might be temporarily possible, if OPEC churned up, and US production performed as EIA predicted, but naw.
This week hasn’t started like the traders are listening to him -straight in at over $83.
Closer to $85, now. If it continues at this same rate, it will hit $100 in a week. Or close to it.
Boy, that escalated quickly ..
Not much interesting in the latest monthly (June) figures for UK. Buzzard and Golden Eagle water cuts continue to increase and production declines are likely to continue fairly steply through next year (production decline for Buzzard looks to be about a year ahead of their P10 case when Buzzard II was approved). Scheihallion field ramp up has paused but the Loyal field, also through the Glen Lyon FPSO has started. No sign of Clair Ridge yet.
Other fields are continuing to ramp up but appear mostly to be pretty slow and might take a few months more to reach plateau. The Laggan Tormore gas condensate fields continue to decline much faster than planned but Total says this is due to (not entirely unexpected) reservoir compartmenalisation so they are going to have to drill more wells, which may or may not fix everything. The plant went into turnaround in June. They also made a reasonable gas find last month in the same vicinity so they should be able to keep the gas plant going (they had offered it partly for sale but may have withdrawn that now).
Permian – update through June 2018
https://shaleprofile.com/2018/10/01/permian-update-through-june-2018/
Thanks Energy News,
Enno’s presentation shows TX Permian tight oil output is up 51 kb/d in June from May. Horizontal wells only.
My estimate, your estimate, both show an increase, just in Texas that’s over that amount. Both of ours is less than the current EIA estimate posted on their site. It went from 4210 to 4223 this month. Production distribution by district on the RRC site indicates that Eagle Ford grew more.
Guym,
EIA estimate is an increase of 44 kb/d for TX and NM in Permian (their estimate includes vertical wells). Enno has a 61 kb/d increase in Permian for TX and NM horizontal only (based on RRC data). This suggests a fall in vertical well tight oil output of 17 kb/d from May to June, which may confirm your suspicion that small company output has fallen (at least in June in Permian). This assumes both estimates are correct.
Off Topic: How Much Oil Can Saudis Really Pump? We’re Set to Find Out
https://www.rigzone.com/news/wire/how_much_oil_can_saudis_really_pump_were_set_to_find_out-28-sep-2018-157065-article/?pgNum=1
Continuation of adding it up in the above article, what they left out is SA says they can get 300k more from the Manifa field, which they say has been repaired.
From the above, and what I read, the new total is the following:
SA- Manifa 300k supposedly repaired
Khurais 300k no idea when, but probably soon
Joint SA/Kuwait 300K
a preliminary agreement of 100k has been made from the offshore field that has capacity of 250k
no agreement yet on the onshore which could yield 220k, but I am guessing that will eventually pan out to another 200k. This is not ready yet, just future.
UAE 79k, earlier print had 300 and 500k
Iraq – 200k Halfaya, if no civil war
In the estimate I posted above, the total came to 1.7 million, now it is down to 1.179 million.
Besides maybe the Manifa field, all of these can not just have the taps turned on.
One of the most interesting developments resulting from US-Iranian conflict will be an opportunity to see How Much Oil Can Saudis Really Pump, if they should choose to try.
Bloomberg tanker tracking, Iran’s crude oil and condensate exports to September
https://pbs.twimg.com/media/DobXsESWsAEw1t0.jpg
Energy News,
Wow, looks like 1000 kb/d from April to Sept, and could possibly rise to 1.7 Mb/d.
Yeah, they are still short about 500k barrels from making up Ven and other losses. They will be a very substantial amount from making up their own losses. Exact measurement is not necessary. A bunch describes it well enough. On the non-OPEC end of supply, we will be another “bunch” short of meeting demand. So, we’re a bunch short? Precision measurement?
The great thing about being a non-paid psychic is that you can’t be blamed for being wrong. Your just off a little. I know that’s the proper description, because that’s how people describe me..he’s off a little, or is it, he’s a little off.
https://www.zerohedge.com/news/2018-09-30/us-naval-blockade-russian-energy-exports-option-interior-secretary
In a interview about fracking and the implications of making the United States less dependent on foreign sources of energy, Interior Secretary Ryan Zinke told the Washington Examiner that the US Navy has the ability to blockade Russia from controlling energy supplies in the Middle East.
“The United States has that ability, with our Navy, to make sure the sea lanes are open, and, if necessary, to blockade… to make sure that their energy does not go to market,” Zinke said on Friday at a Consumer Energy Alliance event in Pittsburg.
. . .
“A US blockade of Russia would be equal to a declaration of war under international law,” Russian Senator Aleksey Pushkov said, commenting on Zinke’s words. Russia does not currently export any energy to the Middle East, which itself is a major oil exporting region. The whole idea is an “absolute nonsense,” the Senator argued.
The Oil Industry Needs Large New Discoveries, Very Soon
https://oilprice.com/Energy/Crude-Oil/The-Oil-Industry-Needs-Large-New-Discoveries-Very-Soon.html
Not really surprising news.
The main reason for lower discoveries is that spending on exploration has drastically plunged since the 2014 oil price crash.
That is not true, discoveries were falling in the high price years since 2010 and the reason exploration is down is as much to do with a shortage of any kind of prospects, not just cheap ones.
Every time I read one of these articles, I wonder who the authors think should be paying for the exploration. If you don’t see sufficient return on investment, why should you explore for oil?
If it is a matter of national security rather than profit to find more oil, then shouldn’t oil companies be nationalized and citizens taxed to pay for more exploration?
Is it more palatable to suggest we’ll run low on oil because of inadequate investment than to say investment is low because the oil isn’t there? In the former case, it reassures people that we’re still in control; in the latter, it’s an acknowledgment that man can’t overcome what doesn’t exist in sufficient quantities.
It’s either, “we have a problem and we can fix it” or “we have a problem and we can’t fix it.”
.
The authors at OilPrice and WoodMac have job security and a sense of worth that is in part (maybe a big part) dependent on there being continual and adequate oil discoveries
Almost everyone has a vested interest in not admitting “we have a problem and cannot fix it.” Publicly traded oil companies are in the business of finding and producing oil. NOCs are typically the center pillar of governmental stability if not legitimacy/survival. For nations/markets that are oil dependent – well, imposing a hard cap on global oil consumption to combat climate change has never even been proposed.
The insight that they haven’t been finding much regardless of price environment is not special. I think plenty of these people who have it as their business to produce oil have reached the same conclusions. There’s just an incentive to come up with alternate explanations. Any alternate explanation.
This was a (former…) BP geologist five years ago with the same math.
https://www.theguardian.com/environment/earth-insight/2013/dec/23/british-petroleum-geologist-peak-oil-break-economy-recession
Yes, that’s my impression. They are tossing out alternate explanations to avoid saying that an irreversible decline is looming.
The story the Emporer’s clothes is a classic for a reason. Human nature. The first one to say he is naked is severely chastised. More fear than anything else. Who wants to start telling everyone that everyone’s lives may change dramatically soon? May as well don that clapboard that says the end is nigh. Hey, don’t look at me, I ain’t putting that on. Oil will just be a little higher in price, that’s all. My advice comes from the very old Western advertisement: “if you don’t have an oil well, get one!” Actually, getting an oil well is pretty pricey, but there are alternatives. Earlier this year I bought 69 USO calls at 14 due Jan 2020. I recently sold 30 of them, recouped all my original investment plus about 100% gain, the rest I’m letting ride. That was risky, and not what I would advise as a normal oil investment, but alternatives are there.
This WoodMac article says that resources sanctioned per year are around 10 billion barrel of oil equivalent (boe), down from 50 bn boe in 2010 ???
2018-10-02 (WoodMac) What’s holding back a new investment cycle?
Aren’t new project sanctions rebounding?
Yes, we’re on course this year to get close to pre-downturn numbers of 40 final investment decisions per year but scale has been sacrificed. Today’s new projects are much smaller, with capital spend averaging US$3 billion compared with US$9 billion a decade ago. And resources sanctioned per year are around 10 billion barrel of oil equivalent (boe), down from 50 bn boe in 2010. The average break even price for projects going ahead in 2018 is US$35 per barrel, reflecting demanding hurdle rates that defeat the bigger and more complex projects.
Will we see a bolder approach going forward?
You’d expect to, but the opportunity set of conventional projects is quite thin. We hold around 100 billion boe in our pre-FID hopper which sounds a lot, but it’s only around two years’ worth of global oil and gas production. Companies have been cherry-picking the best conventional projects: half of our set of pre-FID resources are higher cost projects, uneconomic below US$60 per barrel. On top of all that, risk aversion for the last four years has severely limited resource capture, and there’s been nothing like enough coming in to replenish the hopper.
https://www.woodmac.com/news/the-edge/whats-holding-back-a-new-investment-cycle/
100 Gboe pre-FID is less even than I thought. I’d bet less than half are oil. A big chunk might be oil-sands which are at least 8 years away from production and going out every day the pipelines don’t get sanctioned. They also mean less in terms of production than conventional as they are built for 50 year lifetimes. Another bucket might be redevelopments as there’s benn a lot of talk of those, they also don’t add as much production as true greenfield. And anoher lot will be Brazil, which can’t be accelerated as they have schedule crowding there already. The rest will look really sorry.
The gas side should also give some cause for concern. More and more countries want LNG, maybe they won’t get it now unless Qatar really heats up.
A coming concern will be industry capacity. The companies are losing the teams that used to be able to do the big projects. For example what do the completions and commissioning crews do after this year as all the projects in the pipelines get finished? Trying to do big projects again, assuming there are some, after a gap will be problematic and lead to delays and overruns and really fast cost escalation (probably from the off because the EPCs will know the problems they are going to have). No amount of digitization and ‘big data’ or the technology buzz words doing the rounds is going to change that.
Well, whatever we have come up with since his revelation (BP guy), it has only delayed it some. He wasn’t wrong, just timing delayed. It may not be peak, yet. Just damn close.
Bloomberg’s OPEC production survey, OPEC managed to keep production steady in September (+30 kb/day) despite the ongoing loss of Iranian barrels (-140 kb/day).
Saxo Bank chart: https://pbs.twimg.com/media/DoezgcNWwAEzfl5.jpg
Russia’s September oil output at 11.356 million b/day, a new post Soviet record
Bloomberg chart: https://pbs.twimg.com/media/DofAOL4W4AEnsgY.jpg
2018-10-01 (ANP) In August 2018, Brazil’s oil production was 2.522 million barrels of oil per day, a decrease of 2.1% compared to the previous month and also compared to August 2017.
http://www.anp.gov.br/noticias/anp-e-p/4803-brasil-produz-3-19-mmboe-d-de-petroleo-e-gas-em-agosto
https://oilprice.com/Latest-Energy-News/World-News/China-Boosts-Oil-Import-Quota-For-Independent-Refiners-By-42.html
Looks like the possible reason for the recent temporary spike in Oman oil to 90. Getting the imports up by Nov for next years teapot allocation. Just a guess.
https://oilprice.com/Energy/Oil-Prices/Why-The-Saudis-Cant-Keep-A-Lid-On-Oil-Prices.html
Yes, Irina, I believe that’s exactly what will happen. Oil may be at $100 at the end of the year, and reality will set in. I don’t think it will go down from that point, however. In that, we disagree. Higher oil price will not kill demand that fast. Over years, yes. Over months, not so much. Many may be looking at the weekly EIA figures and lamenting that oil should not be that high, based upon the figures. But, EIA doesn’t report world inputs, outputs, production and inventory levels, and not even US figures very well.
Gasoline’s short-term price elasticity is almost nonexistent. Other things like air travel DO respond to short-term swings in price but you’re still refining the barrels for gas and diesel.
https://www.eia.gov/todayinenergy/detail.php?id=19191
What happens in the short term is that the rest of the consumer economy pays for it.
… and credit cards are already getting maxed out again before the oil price increase feeds through. FAO food index is going to be interesting to watch now especially as the climate change related events are starting to have an impact as well. Barring a major recession in the OECD I can easily see 2019 or 2020 being another Arab spring.
Mentioned these guys recently. Don’t know why they don’t get more attention.
https://en.m.wikipedia.org/wiki/Gas_Exporting_Countries_Forum
Maybe GECF doesn’t roll off the tongue as OPEC does.
70% of global gas reserves. 38% of pipeline flow, 85% of global LNG.
US ain’t in it.
Interesting concept, but the list of countries involved doesn’t correspond well at all with the rankings of Nat Gas export. Seems to have a very big political bent. Guess that shouldn’t be too surprising in this world.
Looked at a list of exporters. And a list of importers. Several countries are on both lists. Most particularly, Germany, who makes the top 15 on list of exporters and is #3 importer. The US is top 10 on both lists. US consumption last year exceeded production.
This group doesn’t seem all that different from a net exporter list. Other than missing Australia, whose output growth has been somewhat recent. I don’t know what the politics thing would be.
The $Midland to $Cushing price discount has narrowed
Updated chart https://pbs.twimg.com/media/Dokhl_uW0AEUfuS.jpg
November futures https://pbs.twimg.com/media/DokiBOvXUAEpyq3.jpg
WTI Midland (Argus) vs. WTI Financial Futures Settlements
CME –> https://www.cmegroup.com/trading/energy/crude-oil/wts-argus-vs-wti-calendar-spread-swap-futures_quotes_settlements_futures.html
The spread between ORB and WTI has widened, now at $8
updated chart https://pbs.twimg.com/media/DokmzzhXsAIXBGh.jpg
These are always interesting and tell a lot. Addition of 90k pipeline from Midland to Cushing due on the end of Oct. If production was still increasing like EIA says, these spreads would be increasing vs constricting. There is no additional way to get it out, other than the above and towards the end of next year. Canada has it much worse, with spreads approximating $40, at times. WTI/Brent/ORB spreads cause US exports to rise, as we can see in the last two weeklies. As production is stalled, and exports increase, it should provide some equilibrium in inventory levels.
Although, it could actually be increasing some in the Eagle Ford, and that would not affect these spreads, at all. Most Eagle Ford goes directly to WTI MEH. I do see more DUC activity in the Eagle Ford, but not so much completions. Some producers actually do as they’re supposed to do, and post a completion after drilling as shut in. These are up over 200 year over year.
Guym,
EIA data through July only, if you look at the July curve you will see the spread was getting wider at that point, as we would expect. The EIA forecasts are never very good, I ignore them. Probably after July, output in the Permian may be flat. Note that the August estimate may not be good for Permian output, no clue what the basis of that estimate is, perhaps based on Drilling Productivity report as RRC data and drilling info data for August may not be available, unless they have some survey data from the 914.
It’s almost entertaining reading the stuff by some of the companies and institutions that use EIA projections of production. All is going great and production is booming. Then you read excerpts from support companies that say completions are stalling. Well, you can’t get additional oil without completions. More drilling and hoopla from the EIA will not produce it. It either is growing, or it isn’t. EIA discounts Schlumberger reports as being discredible? Or, they don’t read it, or what???? What’s it going to take for EIA to admit they have their head up their posterior?
Guym,
For Texas in 2018 from Jan to August the average oil well completion rate was 711 wells per month, with minimum of 601 in August and a maximum of 914 in June and July was 753 completions (which was above average for the year.) So completions are down a bit from the 2018 average (about 15% lower in August). This is based on RRC data
http://www.rrc.state.tx.us/oil-gas/research-and-statistics/well-information/monthly-drilling-completion-and-plugging-summaries/
All you can get from the completion statistics is trends, and I agree it is trending down. However, a completion posted in August, might actually have an earlier month they were actually completed in. And many are. I’ve seen completions posted on the RRC inquirey site from over a year ago. I’m pretty sure they don’t include these really old ones in the totals, but there is a substantial delay on many. Of those 601 completed in August, one quarter to one half can have an earlier month they were completed in. Another oddity of RRC. The only timely information on those reports is permits. That is actually how many permits were issued in that month?
Guym,
The number may not be exact, but it is all the information I have, permits don’t really tell us much. Note that from Jan to June the trend was up, from June to August the trend has been down, based on the reported data. The RRC data is often not very accurate for completions, in terms of the actual total for each month.
Saudi Arabia energy minister Al-Falih says that the kingdom is pumping right now at ~10.7 million barrels per day
(August was 10.4 million b/day. The high set in November 2016 was 10.72 million b/day (secondary sources 10,625 kb/day))
2018-10-03 (Bloomberg) “We’re meeting every single demand for barrels” “We’ve increased production quite significantly. We just have to be responsive to demand” “Market Well Supplied, Possibly Slightly Oversupplied”
Saudi Energy Minister Khalid Al-Falih says in Moscow at Russian Energy Week forum
2018-10-03 (S&P Global Platts) Asked what Saudi Arabia plans to produce in November, when US sanctions on Iran are set to go into force, Falih declined to give details. “We will see when November demand comes in,” Falih told reporters on the sidelines of the Russia Energy Week forum in Moscow.
https://www.spglobal.com/platts/en/market-insights/latest-news/oil/100318-saudi-crude-oil-production-currently-107-million-bd-energy-minister-falih
“Saudi Energy Minister Khalid Al-Falih says in Moscow at Russian Energy Week forum”
The Russians are creating a forum to replace CERAWeek. That will be interesting. CERA may support blockading their oil export shipments, like the Secy of the Interior.
Can anybody explain to me why the Western Canadian Select is in free fall? Just pipeline constraints or other or a combination?
Pipeline constraints. Otherwise, the oil is quite salable. Rig count is dropping, too. Rig count would drop faster in the Permian, but their expanding the DUC count. It’s going to take quite awhile to work through the DUC count, now. Getting set up for when the pipelines expand, and in Texas, if you drill a rig, you are showing good faith effort to keep a lease even if there is no oil, yet.
It MAY extend the lease past the primary term depending on the shut in language, Usually it is 2 years max and sometimes that may be restricted to gas (pipeline access). You can not just drill a well and let it sit there. They need production
One producing well will hold the leases in the unit. I would not doubt if these yahoos are drilling alternate unit wells and not completing them, which is just further proof that they would be better off setting their cash on fire and using it to heat their homes this winter.
When they drilled one of our wells on a new lease, they asked us for an additional extension for a nominal amount. Oil was selling at $30 then, and we all agreed. Isn’t automatic, but it can be done. Yeah, it is damn wasteful.
At the moment there is a combination of the usual pipeline constraints but also refinery outages/maintenance.
September 26, 2018 (Financial Post) BP Plc’s Whiting refinery in Indiana and Marathon Petroleum Corp.’s Detroit refinery, two of heavy Canadian oil’s key customers, have been offline and undergoing maintenance.
Scotiabank expects differentials to return to the normal US$18-$22 as those two refineries wrap up their maintenance programs next month, and oil-by-rail traffic picks up the slack over the remainder of 2018.
https://business.financialpost.com/commodities/energy/canadian-heavy-oil-trading-at-outrageous-40-discount-as-global-prices-rally
Good info, EN.
U.S. Petroleum Balance Sheet
Crude: +7.975 million barrels
Gasoline: -0.459 million barrels
Distillate: -1.750 million barrels
http://ir.eia.gov/wpsr/overview.pdf
Saxo Bank chart summary https://pbs.twimg.com/media/Dol2xFFXoAAT_vQ.jpg
Oil traders getting smarter? Oil is back up slightly, instead of diving over an 8 million build. Exports were down close to a million a day, imports were up over a million a day. Refineries were operating at about the same capacity as last week, so a 14 million build would be possible, except it is only 8. Meaning demand is still pretty strong.
Brent almost 86, now. Only 14 bucks more.
Tesla Model 3 is the 13th best vehicle in sales in the US for Sept 2018 and the 4th best selling car.
All Vehicles
http://www.goodcarbadcar.net/2018/10/september-2018-the-best-selling-vehicles-in-america-every-vehicle-ranked/
Cars
http://www.goodcarbadcar.net/2018/10/september-2018-ytd-u-s-passenger-car-sales-rankings-best-selling-cars-in-america/
Not bad for an EV.
Daily Brent spot prices from July 2017 to Oct 2018, linear trend has been an annual rate of increase of about $24/b over that period. If the 21 month trend continues (and this is of course unknown) we would reach $100/b by next August or so, (the trend line is at about $81/b at the end of Sept 2017, so might reach $105/b if the trend continues for another 12 months. I expect the trend will end at about $90 to $100/b as pipeline capacity increases in the fall of 2019 in the Permian basin, prices may remain at around $100/b until Iranian, Nigerian, Venezuelan, and/or Libyan issues are resolved or deepwater projects get developed, whichever occurs first. Probably that doesn’t happen (no increase in output from OPEC or deep water to save the day) and oil prices pause at $100/b before rising further to $150/b by 2024 or 2025.
Forgot chart see comment below.
Chart
Lol. In the past month, it has had an upward trend of about $10 a barrel. In the past week, about $5. Does that mean it is not linear? How linear is the past ten years? My guess, based upon current trends, is it will be at $100 by year end, and $150 when the panic hits by June of next year. Seems I have to give traders more credit. They seem to have an amazing ability to use their own mind when they get too much of Obvious mistruths. Disregard OPEC, EIA, IEA and the big banks, and follow the barrels.
Or, much of the contrarian viewpoint is contained in Barclay’s outlook.
https://oilprice.com/Energy/Oil-Prices/Why-The-Oil-Price-Rally-May-Soon-End.html
In my opinion, a really badly thought out viewpoint. It would have some credibility in places if non-OPEC production was going to continue to grow into the first half of 2019. The joint Kuwait/SA fields are not going to yield 500k, and not even 300k in the near future. And gimme a break. SA isn’t interested in keeping prices “reasonable”, anyway. Release the SPR? Reminds me of a bad movie, when they released the Kraken. Yeah, we could do that. Pretty stupid, but we could do it. The only thing that makes any sense is in granting waivers, but I wouldn’t hold my breath over that one. In all, the lack of knowledge and poor logic makes this banks outlook pretty awesome compared to others.
Guym – $150 in such a short time could do some real damage to the world economy and hence demand, especially in importing countries with weaker currencies, and those are the majority. Do the central banks have anything left they can do to keep things growing in the face of such a hit after they through everything at the economy after 2008? The FAO food index would hit the danger zone for social unrest at about $120 and then watch out – of course the riots could end up hitting oil supply as well.
I think the risk of recession is one thing that is probably going to keep the E&Ps from committing too much to major new investment but there are others: lack of decent prospects; the certainty that Permian oil supply will grow again sometime fairly soon; general geopolitical risks; the Trump is an arsehole factor – his ego could require him to simply declare that the Iran sanctions have worked, no matter what the reality, and remove them overnight, (and his supporters are such unquestioning, moronic ideologues – almost self-brainwashed cultists – they’d probably accept this as true) or some new crisis going to come up and the White House team will show itself as a totally incompetent and corrupt bunch of buffoons, so that a possibly minor issue will become a full blown disaster.
There’s continuing evidence that the IOCs, especially US based, are concentrating in fewer areas: Brazil, Guyana, US LTO, LNG (or large gas projects in general) and … er … not much else. They continue to pull out of the North Sea and now appear to have started the same in GoM with the recent announcements from Shell and ExxonMobil about selling assets (no matter what the trade blogs and press releases say if they are selling up there it means they don’t see opportunities for expansion, it’s not just about short term efficiency).
I really have no idea what the price of oil will be at today, and definitely no idea of future times. It would make logical sense for it eventually to be over the cost of producing it with a profit. And for a significant amount of that, it is probably not $71 as Barclays predicts. So, it may go to $71, but we will have less oil produced than if it went to $100. The concept that WTI could be $60 or $65, and we could still get the growth projected out of the Permian, seems pretty stupid to me. But, hey, we’ve been there before. Henceforth, I think the price of oil will be based on perception. Anything becomes possible. For all I know, we could be draining inventories at $71 ‘til they are gone.
Brent 1987-2019
brent 2009-2011
brent 2016 to 2018,
If the 2016 to 2018.7 trend continues, we would see $90/b in a year, though obviously actual prices will not follow a straight line as they never have and never will.
OIL (BRENT) PRICE COMMODITY
85.89 USD +1.25 (1.48%)
Remember when the Brent spread was supposed to disappear as soon as restrictions on US oil exports were removed?
No, got a link to remind us?
Some time ago, I looked into credit ratings for the various shale operators. Before QE, such things would actually determine the interest rate at which a company can borrow. My recall is I found interest rate spreads that were tiny. Companies whose bonds did not achieve investment-grade were borrowing at a very small interest rate premium above that of companies with the best ratings from the various rating agencies.
As of the past 36 hours, a new reality has arrived that has the potential of shutting the industry down. The 10-year US Treasuries have spiked their yield nearly 25 basis points in just that amount of time.
Now shale financing might have been defined by a tiny spread above IG bonds, for whatever reason. And let’s be clear here, there is no good reason for that. But regardless, the floor is now raised. There is likely no escaping that. Investment-grade vehicles will have a particular yield that is floating above the riskless rate of return, which is the US Treasuries. With that floor spiking upwards, IG paper will as well, and so must junk.
Perhaps worth noting again that the GDP equation includes both taxes and spending by government. Taxes are a burden on the equation and spending is a benefit to the equation. Fiscal year 2019 deficit is going to be about 1 trillion. That is 4.x% of GDP pumped into the economy by the US government. Not capitalism, not organic growth, the US government. Some might suggest bond traders are in the process of informing the government what will or will not be permitted, but that would be a scenario meaningful only before the arrival of Sovereign Wealth Funds, that have been buying US Treasuries as well as equities.
It is they who can move the interest rates.
As for recession, to get negative GDP you have to counter that 4.x% deficit spending and that’s a big hill to climb. As best I know none of that government spending is going to pay for shale drilling, so interest rates rather than economic pressure will likely have the most influence on the industry.
some news headlines…
2018-10-04 (Bloomberg) Trafigura said consensus in the oil market is that sanctions on Iran will now remove up to 1.5M b/d of exports from the market, up from an earlier range of 300K to 700K b/d. US State Dept issued statement calling on OPEC to dig deeper into spare capacity.
2018-10-04 (Reuters) Saudi Energy Minister Khalid al-Falih says OPEC is technically able to raise oil production by 1.3 million barrels/day, TASS news agency reports
2018-10-03 (Platts) Trump admin officials working with OPEC to produce spare capacity they are not deploying; citing 1.2m b/d in spare capacity – state dept spox
2018-10-04 (Bloomberg) The share prices of Indian oil refiners are taking a big hit:
Indian Oil Corp 11.4% (biggest one-day drop since 2008)
Hindustan Petroleum down 13.5% (biggest one-day drop since 2002)
Bharat Petroleum down 12.3% (biggest one-day drop since 2004)
2018-10-04 (Bloomberg) India; Federal government will cut excise duty by 1.5 rupees a liter and asked state-run oil marketing companies to absorb 1 rupee/liter on the sale of diesel and gasoline, Finance Minister Arun Jaitley says in New Delhi.
NEW DELHI (Reuters) – India is facing an “economic crisis” due to its huge oil imports, two local TV channels cited Transport Minister Nitin Gadkari as saying on Thursday, ahead of a meeting of key ministers to discuss the falling rupee and the nation’s widening trade deficit.
Interesting. Above, I came up with a little less than 1.2, so 1.3 is definitely believable to me. But, hardly any of that is available within a short period of time. Remember, we are still about half a million short of covering Venezuela drops, add 1.5 and subtract 1.2, and OPEC end is still short. Then we have demand, and the fact that US can’t come close to meeting the demand plus non-OPEC declines. Or, a “bunch” short. My guess is that even if we were not pursuing this action of depriving the world of needed oil, we still be quite a bit short, just not a bunch.
As other articles (and the IEA) have been pointing out refineries want medium grades…
4 oktober, 2018 (SEB Bank) The Oman benchmark with gravity and sulphur of (API; S%) = (31.3˚; 1.4%) is the typical medium-heavy and sour grade benchmark of the Middle East. Most modern refineries are built exactly for this kind of crude grade because that is the kind of crude which is most abundant in the world.
http://ravarumarknaden.se/oman-leading-the-way-as-sanctions-hits-physical-market/
Chart3: (SEB Bank) Global crude volumes by grades according to ENI
I’m still wondering how much LTO refiners around World could blend in. I guess it’s more than they are now?
The big US producers that have pipeline contracts to the Gulf Coast say that they get higher GC prices for their oil. And so I’ve got no idea how much of US exports see this wide WTI Cushing discount to World prices.
I’m guessing that most of the exports reported on the EIA weeklies are going at close to WTI MEH prices. No idea what MEH is at now, but it was going at $5 to $6 below Brent.