The first half of this post is a guest post by Enno Peters. The second half is taken from the latest EIA Drilling Productivity Report.
GEOGRAPHICAL ANALYSIS OF WELL QUALITY IN NORTH DAKOTA
by Enno Peters
SUMMARY
I was interested in doing a geographical analysis of the oil production in North Dakota. Detailed information made freely available by the NDIC allowed me to analyze how, geographically, wellperformance has been changing over time, in the area of North Dakota where most oil is produced.
RESULTS
In the following animated gif, you will see part of North Dakota. It contains the North West corner that borders Montana and Canada. The scale is in miles, with a rather arbitrary origin. Projected on this map is a contour map. The numbers of these contours are the cumulative 1 year returns for wells drilled within that area, and the unit is 1000 barrels of oil (no gas). For example, contours with the value 50 mark the area in which wells produced at least 50 k barrels of oil in their first year.

I could calculate the surface areas of several levels of first year well returns, in order to determine the trend of these areas. In the following chart you can see for each year the (estimated) surface volumes for 3 levels of first year well returns, 50k, 80k, and 110 k barrels of oil.
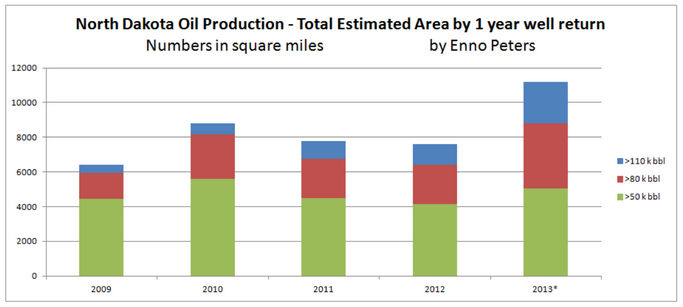
The sudden increase in 2013 of estimated productive surface area, in which wells could produce at least 50 k barrels of oil in their first year, may be explained by
1) the fact that I could only use data until June 2013 (as the 2014 May data is currently the latest one available), and therefore the number of data points are 1/3 of what I have for 2012. The method to determine the contours may not be suitable with this number of data points.
2) changing well practices
3) entering of new formations
So far I suspect that it is mostly 1), but that 2) and 3) could also be part of the answer, and therefore recommend to mostly ignore the 2013 results for now.
As a guide to interpret these results, I estimate (based on a discounted cash flow analysis) that a well that returns 50 k barrels of oil needs a minimum WTI price of about $120; about $82 WTI is needed for 80 k wells or better, and a well that returns 110 k barrels of oil in its first year is about even with $64 WTI. These are rough indications; I have seen a good analysis that estimates 10% higher required WTI prices for these levels of well performance. With current prices that would mean that 50 k wells are not profitable, while 80+ k wells clearly are.
I further estimate that the estimated total oil return (EUR) of a well is just over 4 times its first year return.
METHODS & DISCUSSION
My analysis is based on the public individual well data from NDIC. NDIC also provides the latitude and longitude for all wells, and based on that I could create plots of 1 mile by 1 mile, in which I averaged the 1 year well returns from wells in that plot (although most plots just have 1 well, at least currently).
For the 1 year return, I count all the oil produced by the well until the 11 month after its peak month.
This is slightly more than 1 year, as most wells produce also in the month(s) before the peak month, but this amount is not so much more, and it partly corrects for the fact that I don’t calculate the actual producing days (which is less than the calendar year), which is not (easily) available. Although the numbers go to 120.000 barrels of first year return, there are a few cases where much higher returns were achieved, even up to 350.000 barrels. For clarity these are all grouped in the 120.000 barrels category. The average first year return for plots with > 120.000 barrels was 155.000 barrels.
Based on those plots, the contours were created. The method I used for this is called Kriging (provided by the GIS software).
As my GIS knowledge is limited, the projection of the data on the map is slightly distorted (as Google maps have this distortion), but the distortion is less than 10 miles, and for most areas much less.
Unfortunately the public NDIC data doesn’t provide individual data for the different geological formations. It would have been interesting to see this analysis for each formation (Middle Bakken, Three Forks, etc). NDIC estimates more than 95% of the activity targets the Bakken and Three Forks, so these results include mostly these formations.
As I wanted to zoom in on the most productive area of ND, I only include part of North Dakota. It will be very interesting to see in the coming period how the well spacings develop, e.g. how many wells can be productively squeezed into these productive areas, which will then give a more complete picture of how this trend will develop.
I would like to thank Rune Likvern for his numerous insights and comments, and WES453 for showing where to get the well location data in an easy way, without which this would not have been possible.
___________________________________________________________
This marks the end of Enno’s post. It was rather short so I decided to combine it with a bit about the EIA’s latest Drilling Productivity Report.
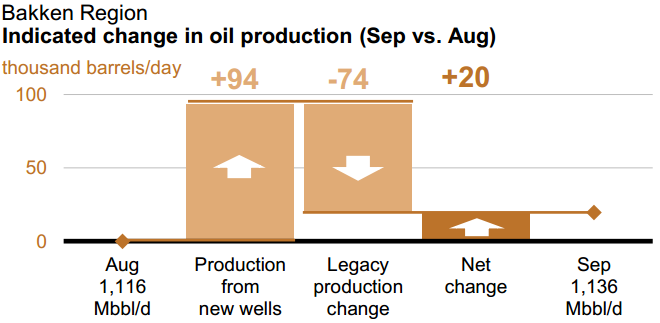
The Bakken must produce 94 kbd of new oil in order to increase production by 20 kbd. That is because the old wells declined, or will decline in September, by 74 kbd. They are assuming the Bakken will produce 1,135,441 million barrels per day in September. This would mean that the Bakken has a decline rate of 6.52 percent per month.
Assuming each new well produces, the first month, 400 bpd, then they would need 184 new wells per month just to break even.
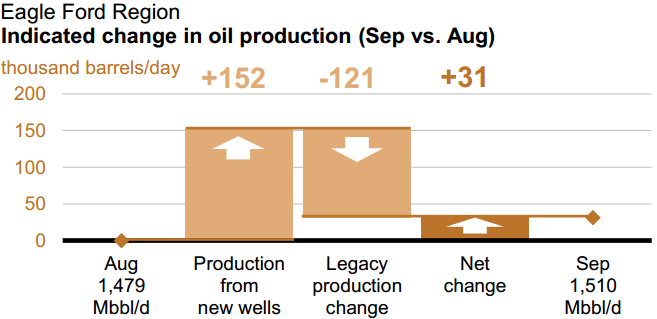
In Eagle Ford they must produce 152 kbd of new oil just to increase production by 31 kbd. The EIA expects Eagle Ford to produce 1,509,863 barrels per day in September. Eagle Ford’s old wells will decline by 121 kbd. That gives them a decline rate of 8 percent per month.
If their new wells produce an average of 400 bpd the first month then they would need 302 new wells just to keep production flat. However each new well may produce more than that. I have seen no stats on what the average new well produces in Eagle Ford.
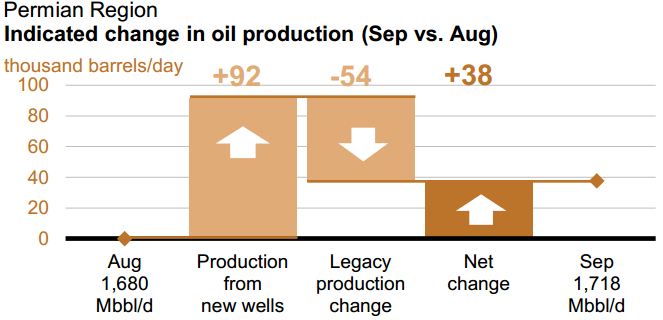
The Permian is the largest field in the USA. They expect the Permian to produce 1,717,750 bpd in September. New wells will produce 92 kbd while old wells will decline by 44 kbd giving a net increase in September of 38,000 barrels per day.
The Permian has the lowest decline rate of any LTO field, 3.16 percent per month. That is because many of the Permian wells are conventional wells. But at 400 barrels per day per new well it requires 135 new completed wells per month to keep production flat.
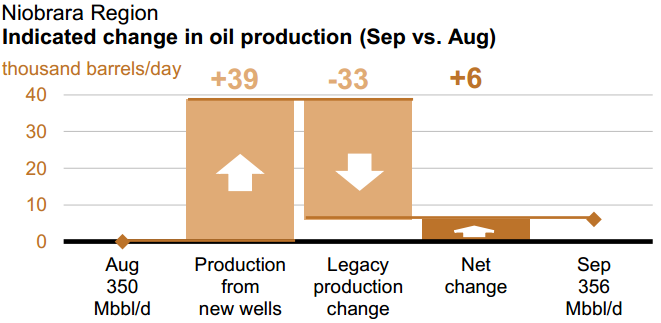
Niobrara according to the EIA, will produce 356,445 barrels per day in September. They will have 39 kbd of oil from new wells and a decline of 33 kbd from old wells giving them a net increase of 6 kbd. Niobrara has a whopping decline rate of 9.17 percent per month and needs 82 new wells per month to keep production flat.
The EIA has three other LTO areas, Haynesville, Marcellus and Utica. Utica is a new one they just added this month. However it literally the area of the Marcellus that is in Ohio. But they have little change each month. For September they showed no change for Haynesville, they have Marcellus up 1 and Utica up 3 kbd.
This you might find interesting. Listed below is the total decline of all LTO fields in barrels per day.
Field Decline in barrels per day per month
Bakken 74,022
Eagle Ford 120,806
Haynesville 1,087
Marcellus 2,146
Niobrara 32,684
Permian 54,202
Utica 2,373
Total Decline 287,320
Every month the oil production from all Light Tight Oil fields in the US decline by 287 thousand barrels per day. And if production keeps increasing that figure will be between 350 and 400 barrels per day per month by the time the peak arrives. That is a huge decline unless they can keep that Red Queen running like hell.
However, this is important: While the Drilling Productivity Report does eventually catch up and report the actual data, their production numbers for the last 9 months or so must be taken with a grain of salt. Example below, the last data point is Sep. 2014:
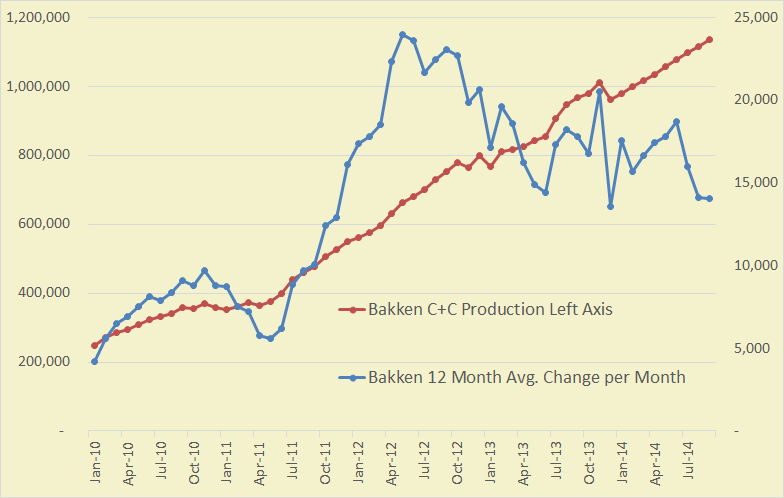 They are reporting the correct numbers, total Bakken North Dakota + Montana, through December 2013, but for the next nine months it is pretty much a straight line, averaging about 19.5 kb/d increase every month. However that is pretty close to the actual reported numbers by North Dakota and Montana average (through May), their numbers are not nearly that linear.
The Right Axis is the 12 month trailing average of the change per month in barrels per day.
Basically the EIA’s Drilling Productivity Report is just guessing for the last nine months even though the near complete data, through May, is available, for all states except Texas.
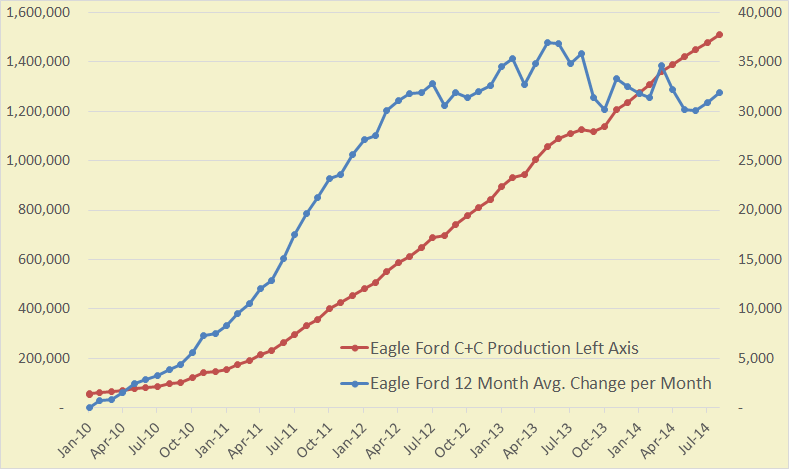
This chart is comparable to the Bakken chart above but using the DPR Eagle Ford Data. Production is the left axis and 12 month average change per month is the right axis.
Could we treat this like calculus does with distance, speed, and acceleration?
Production is the variable. Change per month is the 1st derivative. Change per month per month is the 2nd derivative.
Figuring out where the trend in acceleration is we could do an integral to pinpoint when production growth will reverse, hit zero, and go negative. From there one more integral will yield when production itself should peak.
This would work so long as the 2nd derivative (acceleration) follows a linear equation with a high R value, right?
You do it, work it up into a nice presentation with charts and stuff, send it to me and I will post it.
You’d need a function to take the derivative of. These charts are simply observations.
The point is, altough that’s what I believe: when one models the data, the first derivative of the model should fit with the change in the data.
I am intrigued by the discounted cash flow analysis mentioned in the post. Are any details available?
Below in my response to Dennis I provide some details on the way I have calculated it.
A back of the envelope calculation:
If the Bakken has 1800 new wells in a year
If each well is $6M
If additional total revenue for May 2014 is $700M higher than May 2013
Then how is that squared with the numbers presented here? If some data wrong? If this were temporary, I’d see it because it seems to be the case for years.
Ken,
I wouldn’t go any lower than a cost of $8 million/ well (on average). Besides, because of the use of new/old differing technologies much larger amounts of sand (proppant) and water are expected to be used in the near future. Sand costs are set to explode because of shortages, and ceramic proppants have mostly priced themselves out of use with present day technologies. Well costs are expected to rise considerably, but will be offset by considerably higher EUR’s. As usual, nothing in the Bakken can be accurately predicted at present. There are always far too many variables. Everything mostly consists of guesses, some educated, most not. Trying to guess the Bakken peak is a complete waste of time at this point. Everyone should just put it on the shelf for at least five years.
Meanwhile in Belgium. We have 7 nucleair reactors,
Doel 1: Sceduled to be shut down in 2015 due to aging.
Doel 2: Sceduled to be shut down in 2015 due to aging.
Doel 3: Shut down temporarily due to “little cracks in the reactor vessel.”
Doel 4: Shut down due to an act of sabotage last week. The lubrication oil of the turbine was drained purposely! The turbine may be total loss.
Tihange 1: Sceduled to be shut down in 2015 due to aging. Policy reconsidered. Life time stretched with 10 years.
Tihange 2: Shut down temporarily due to “little cracks in the reactor vessel.”
Tihange 3: Up and running.
Brownouts are being planned for next winter. Rural areas will be cut off the grid “for hours” at times of peak demand.
Design PWR’s or BWR’s.? What is age of the reactor vessel?
Kinda dark here in the Sunshine state
http://grist.org/climate-energy/no-solar-please-were-florida/?utm_source=newsletter&utm_medium=email&utm_term=Daily%2520Aug%252012&utm_campaign=daily
http://www.latimes.com/nation/la-na-no-solar-20140810-story.html#page=1
All Belgian reactors are PWR. The age of the vessels with the little cracks is 31 years. The cracks appear to be little hydrogen deposits that got stuck in the steel during the production of the vessels.
From the comments in the LA Times article…
“Is it really of any surprise that Republican dominated states don’t get to use solar power products? How silly is that Republicans will be the first to cry about limits on liberty, but when it’s gay folks, women, or solar power installations liberty goes out the window.”
North Carolina is a state that is as red as coal fire. Solar is booming in NC.
But in general I agree that reds are not as friendly business wise as blues when it comes to renewables. Texas is the other whopping exception but they have a superb wind resource to help them feel the renewable breeze.
Come to think of it most of the midwestern farm states are kind of commie red tinted (sarcasm) and that is where most of the wind farms seem to be .
Of course they are where most of the insanely stupid ethanol farming and refining is done too.A huge portion of what has been accomplished by building out solar and wind in this country has been negated by the moonshine industry.
I wonder how big a portion.
An intellectually honest commenter or reporter will not cherry pick his facts in order to get in a few cheap partisan licks.
If anybody wants to know why FAUX news is so popular they might spend a minute thinking about this sort of thing.
Of course Faux is equally guilty and mostly even more guilty but we only notice the cherry picking when one we are well enough informed to notice it and two when it is the other side doing it.
So far as I can ascertain there are no clean hands in politics in this country. All hands are dripping slop from being constantly buried in the govt slop trough. Gimme a road I will give you a wind farm.Gimme another football stadium or museum I will give you a few more acres of designated wilderness or whatever.Gimme a contract for hundred more giant jet aircraft or bailout my automobile industry and I will be your sex slave for the next decade at least.
And when you get to the point of bailing out the banks and the mcmansion industry….We are pretty much all guilty red and blue.
Considering such facts as these, is easy to see ” why capitalism doesn’t work anymore”.
We don’t actually have much in the way of real capitalism left.
A real capitalist would not expect a bailout if his business turned sour because he would understand this would put him in the position of bailing out everybody else in a financial bind.
What we have is a nation of bastard children both born of socialists and capitalists sleeping together.
Both sides hate their unwanted political children.Neither side seems to have realized that Mother Nature did not create us as sexual creatures just so we could have some fun.
Sex is for reproduction. Our current situation is the result … well call it what you like.
I hope the regulars realize that this comment is part sarcasm, part humor and only in part serious and metaphorical in referring to sex.
The connection between wind and ethanol is that both benefit farmers, and farmers have political clout.
It is true that farmers in the farm states do have very enormous political clout way out of proportion to their actual numbers in relation to the rest of the country.
But this is true of other special interests in other parts of the country too. Organized labor has enormous clout out of proportion to the number of people involved in some states and some industries such as tobacco have had enormous clout in some southern states. I will point out that tobacco farmers and tobacco companies are not and have never been friends.
Mining interests have dominated West Virginia politics politics for decades.
Tourism and real estate own the Florida political landscape.Used to any way.
And organized labor of the government sort threatens in my estimation to own huge tracts of the country all over the place pretty soon since government managers can promise anything to be delivered long term so long as the delivery can be postponed short term.
Living in Florida, the Sunshine State, I am impressed with how little PV is produced here.
Oregon produces 3x the amount of solar per capita, and it would seem that there is no other reason that this could be aside from politics. On a pie chart of reasons, politics would certainly be the largest wedge, but not the only wedge.
Lower electricity costs make solar less competitive in Florida compared to Northeaster and Western states. If your electricity is already cheap, then it’ll take that many more years for the cost/benefit to pay out.
In the legal arena, Florida has a well-intended law mandating that only utilities can sell electricity to customers, so solar companies must first sell to the utility, which then sells to customers. This keeps prices down because Duke energy can negotiate low wholesale prices per kilowatt, and pass the lower prices to customers, but this makes entry into the solar market futile because it destroys any profit margin.
A well intended, good law in theory, but, as always, it is the unintended consequences that are wreaking havoc.
Then, there’s the plain clothed politics. The state does nothing to incentivize homeowners, businesses, or developers to install solar even though Florida is ideal for such incentives.
In the long run this saves the state money (reduced outlays for tax credits). It basically mooches off of other states that are paying the upfront costs of subsidizing the emerging solar industry to achieve economies of scale.
A few years from now a threshold will be passed where solar will be competitive regardless of tax incentive or subsidy. At that point solar will boom in Florida without the state having lost hundreds of millions in subsidizing the development of the industry. I personally think we don’t have all that much time to transition, so this short sighted strategy of letting other states pay for industry development and riding those coattails later will likely bite us in the ass, but que sera sera I guess.
Well, Brian, my fellow Floridian, I too share your perception. Of course when the ‘Americans for Prosperity’ a misnomer if ever there was one, are hell bent on disseminating false information about the cost of solar to the consumer it might give you a clue that certain vested interests are also in play…
http://www.tallahassee.com/story/opinion/columnists/2014/08/07/abigail-maciver-robbing-peter-pay-paul/13746861/
Cheers!
Fred
Just a matter of WHO own’s the PV, went fishing over the weekend and forced by law to toss Snapper and trigger fish back to the gulf. Chance of survival low when yanked up from 80ft. Fisg Police everywhere. In the Sunshine state, no affordable Sun OR Fish period.. It’s all brokered by the Tallahassee Mob. Florida imports 99% of it’s energy, Likely to get really ugly as NG Prices normalize.
As complementary information, Doel 1, Doel 2 and Tihange 1 will be 40 years old next year and there is no plan to build new nuclear reactors (decision to go out of nuclear power by 2025).
Different gas turbine plants have been closed in 2013 and 2014 with no new plant built. This is due to a lack of rentability caused by renewable energy sources. Renewable part of electricity production was around 15% in 2013. This part should increase to 21% by 2020.
Hi Enno,
Very nice work. Thanks. In your DCF (discounted cash flow) analysis, did you use the usual values that Rune Likvern uses? My recollection is that he uses royalties and taxes at 26.5% of well head revenue, transport costs at $12/barrel, discount rate of 10%, well cost at $9 million, OPEX at $4/barrel, and other costs (mostly financial I think) at $4/barrel. If that is not quite right could you fill us in on the assumptions of your DCF?
Thanks Dennis.
I still use slightly different numbers than Rune Likvern, but his input definitely helped improve my DCF. I base many of the numbers from the financial statements of several Bakken-heavy companies. The way I do it:
– I modeled the well profile based on the average monthly well numbers I regularly present, for the first 5 years. After 5 years I use a monthly decline of 0.8% (annual about 10%), and let it run for 40 years.
– I use a gas price $2 higher than HH, as it seems that gas in NDcomes with NGL, which are sold for a higher price.
– 16% royalties. There are no public numbers, but based on forums I belief it is the right order of magnitude.
– $9 million well cost. Official numbers tend to be lower, but they exclude some of the CAPEX.
– $10 WTI/bbl differential due to transport, for barrels of oil sold.
– $6/BOE lease operating expenses.
– 11% ND production & extraction taxes. The official number is 11.5%, but there seem to be some tax breaks, so the average rate is slightly lower.
– $2.7/BOE overhead costs
– 8% Annual discount rate. Given low long-term interest rates, I think this number should not be higher.
– interest rate : 4.5%
– I include an overall income tax, by estimating an income tax rate (effective rate 14%) on the gross well income, but I have this income tax only paid at the end of the well life, as it seems that these companies can defer most income taxes for a very long time. I may be quite off with this number, but because most of it is deferred anyway, it should not have a too big impact.
Thanks Enno,
Can you clarify how you apply the interest rate? Do you use an average level of Debt per barrel of oil produced?
Do you assume all natural gas produced is associated gas and just apply an average CF of natural gas produced per barrel of oil produced to figure in the value of the Natural Gas? I have tended to ignore Natural Gas because my guess is that the oil companies barely break even on any associated gas so that it likely does not effect the analysis that much. Is your discount rate a real rate or nominal rate? I do these analyses in real dollars so my discount rate is 7% in real terms and 10% in nominal terms (assuming 3% inflation).
As always, your analysis is excellent!
I performed the DCF as an individual investment decision, unburdened by other debt. Debt is then incurred at the start, and earned back with free cash flow. I charged interest on the early negative balance, until the debt had been recovered.
If your goal is to determine how much a well needs to earn to also cover the average debt of the typical Bakken company, you can indeed add a continuing interest expense.
For gas, I assumed a fixed ratio of gas to oil of 1.2 to 1 (BOE). If you check the financial statements, you will see that gas in the Bakken seems to be sold higher than the HH index, with the NGL explanation. If that is all correct, I think the impact of gas is too big to ignore.
I didn’t include an inflation factor, mainly because I personally have low inflation expectations of the near future (and further out it doesn’t matter much anymore).
Enno,
For what it’s worth, (probably not much to you as I mostly just generalize about such things) I usually use an average well cost of $8 million, a well head price of $80/barrel, and therefore the first 100,000 barrels as the breakeven point to get the original investment covered. A great well (EUR of 1 million or more) produces that much within six months to one year, a good well (EUR of 750- one million) 12-18 months, a good enough well (500-750 k) 18-24 months, an okay well (300-500k) two to three years, anything below 300k is not okay for me, as I use that level as a financial break even point. (Correct, or not.) It is actually probably somewhat lower than that, 200-250k perhaps. I don’t really know, or care. It’s way below my radar. No investor is interested in any EUR that low at a well cost of $8 million, or more. Way too much risk!
regarding the discount rate:
In determining whether a project should be pursued or not generally one looks at the return on alternative – like – investments, not long(er) term bond rates. As most PE firms would not consider a project which has a projected return of investment of less than 10% gross (and then they take out their fees and pass the rest on to investors) 10% is probably not an absurdly high number.
Rgds
WP
WP,
I agree, I assume you are referring to a nominal rate of return rather than a real rate (where inflation is deducted). When we adjust for risk, a 10% nominal discount rate may be too low.
I think that Warren Buffett makes a very good point explaining that for investment decisions the for the discount factor the rate of long-term treasuries should be taken, as the risk-free alternative.
I work with PE firms and UST rates are simply not even looked at when evaluating potential investments.
If Buffet actually were to live by his words he would have zero cash on his balance sheet (because there are so many investments with an expected risk adjusted return in excess of treasuries) but in reality he’s sitting on 50B+ in cash. There is a discrepancy somewhere…..
Rgds
WP
Hi Ron,
For the Bakken in North Dakota, legacy decline was about 50 kb/d in May 2014, if 175 wells per month are added each month on average until Sept 2020 and there is no new well EUR decrease the legacy decline only increases to 62 kb/d by Sept 2020. Note that a fall in new well EUR would make the legacy decline smaller rather than larger. Chart below with legacy decline in kb/d on left axis and legacy decline rate (%) on right axis, horizontal axis is months from start of model (Jan 2010 is month 1).
Hi Ron,
I am not sure how easy it is to get the state level data for specific plays, it is easy for North Dakota, Montana has annual data for formations, but monthly data is harder to find, possibly there is good information from drilling info,but I don’t have access to that service. For the Montana Bakken, the EIA seems to use all Montana output, but the Bakken is only about half of Montana’s C+C output the last time I checked (through 2012).
I double checked May 2014 and when I subtract North Dakota Bakken output from the Bakken DPR number for May 2014 I get 81 kb/d, EIA Montana C+C for that month is 80 kb/d. I did a quick check on May 2014 Montana Bakken data, most of the Bakken output is from the two Elm Coulee fields and in May 2014 these two fields produced 46 kb/d or 57% of Montana’s C+C output. If we assume about a 6% legacy decline then we would have 3 kb/d from Montana. Using NDIC statistics we get a 49 kb/d legacy decline for the ND Bakken (assuming 216 wells completed in the Bakken. 95% of completed wells, and 400 kb/d for new well first month average output) for a total of 52 kb/d legacy decline for the US Bakken in May 2014. The DPR gives the legacy decline as 68 kb/d in May 2014 for the Bakken, I do not think the EIA does a very good job with their model.
What I see on Enno’s stuff:
The .gif would appear to show the early 2013 ramp up in fracking stage count, with that big dark red smudge exploded into place all in Mountrail county. A similar thing doesn’t show in MacKenzie, but it produces big numbers.
A factor could be Dickenson city is more or less due south of Mountrail, closer substantially than MacKenzie, and of course Dickenson is where the trucks have to drive to and from to load proppant and offload “oil”. It’s the mega rail hub. So if you’re going to do your zillion stage fracks anywhere, you do it to minimize the truck trip duration, one supposes.
The timing and results do not bespeak any sort of sweet spot this or that, it would appear. Do we know if one company dominates that acreage in Mountrail? That would be useful to know, because they definitely outproduced elsewhere.
Mountrail County is dominated by Whiting (WLL), EOG (EOG), and Hess (HES) — they each operate about 20% of the wells there.
Below, the current operators of Mountrail County (list does not include confidential wells).
Good job, Regex. EOG are the guys doing the mega giga fracks and maybe their numbers corrupted the overall average and generated that boomage.
Watcher,
I agree. I am quite certain it is EOG. Apparently they own the entire sweetest of all sweet spots in Montrail county, of about 20,000 acres. They are not at all generous with information about their operations though, while they are ongoing. But, rumor has it that they are on to something mega big, that they are first trying it in Montrail county, and then they will later use the same technology and practices in the Antelope play in Mckenzie county. It is referred to as cross basin technology as EOG first used in the Eagle Ford with great success, and is now applying it to the Bakken. It is yet another game changer. EOG and CLR are going all out in a friendly competition to try to decide once and for all what is the best way to develop the Bakken, and who is the better operator. We will know the final results in about one year. I’m betting on EOG.
Pipeline wars: Union Gas takes a swipe at Energy East
Union Gas says TransCanada’s Energy East project will increase costs and risks for Ontario natural gas users
John Spears, Business reporter, Toronto Star, Published on Mon Aug 11 2014
Hat Tip: Inside Climate News
NWT CURRENT FOREST FIRE SITUATION REPORT
August 12, 2014 13:04 hrs
Total Area Affected in Hectares for 2014: 2,856,670.90
Total Number of Fires in 2014: 365
Fire map link.
Worth noting where the treeline ends in NWT. There are no forest fires above the treeline since there are no trees.
http://www.geomatics.gov.nt.ca/maps/NWTTreeLineBasic_V3_low.jpg
Sorry, I should have cropped the top of that last image. Anyway…
Terrible Thunderstorms of Fire Over Canada as Arctic Territory Continues Record Burn
by robertscribbler on August 7, 2014
Normally Steve gets the prize for The Most Depressing News of the Day, however, this time I might be forced to make an exception.
Dataset Name: Natural Gas, Marcellus NE PA
Enno said: “In the following animated gif, you will see part of North Dakota. It contains the North East corner that borders Montana and Canada.”
It’s actually the North West corner.
Just checking if people read the post careful enough, congrats, you did! 🙂
You’re absolutely right.
I have corrected the typo. It now reads the North West corner.
Hi Enno,
I failed the test and missed this completely, would you like me to correct it in your post?
Pipeline problems in Texas:
http://www.reuters.com/article/2014/08/12/us-pipeline-fire-texas-idUSKBN0GC25O20140812?feedType=RSS&feedName=domesticNews
Brent oil price continues its decline to $102.50, a one year low, apparently on decreased Asain demand, increased US production and rising global commercial stocks.
What is causing this decreased Asian demand? Is it simply that China has stopped filling it’s strategic reserve for now, or is economic reality catching up with the area, and we are facing headwinds into the next global recession?
Either way, how far and how long does price need to decline before the financing bubble that is US shale drilling burst? It would only take a few months of significantly decreased drilling rates for the red queen to catch up and tip shale production into decline.
What is the US strategic response to this problem? Could it be that the economic sanctions on Russia are designed to accelerate their decline from peak production, and to prevent them replacing Saudi Arabia as the global swing producer? This administration appears to have abandoned Libya as a lost cause, and reluctantly decided it has serious unfinished business in Iraq. Intervention began within hours of IS launching its offensive on the Kurdish controlled oil areas.
There is no shale oil financing bubble. Sorry! Please do some actual research on this subject before expressing such nonsense in public. But, at about $80 some marginal production will start getting affected. Serious problems only begin at about $60. No chance of it getting that low. Problems in the ME, real or imagined, will only increase with anything below$90, and that will likely push it back over $100. Not to worry.
Mexico has been fudging their production numbers by counting water as oil.
Mexico Oil Output Bloated by Water Barrels, Official Says
Petroleos Mexicanos, facing a 10th straight year of production declines, is including water in its oil output and may revise previously reported data, according to a company official briefed on the matter.
A record gap this year between reported output and what the state-owned company processes is partly explained by measuring systems at older fields that are unable to differentiate water-heavy oil from actual crude, the official said, asking not to be named as Pemex debates reducing figures for the past three years or more. Last month, the company cut its 2014 output forecast to 2.44 million barrels a day.
Pemex, which is preparing to form partnerships with private producers for the first time in seven decades, produced 2.48 million barrels a day through June, while its distribution system processed 2.32 million barrels a day, according to the National Hydrocarbons Commission. The commission didn’t give a reason for the 6.5 percent gap. In an e-mail, company press officials attributed the difference to evaporation, statistical variations and storage, without commenting on the inclusion of water.
Pemex was probably “setting goals they weren’t achieving and postponing the moment to correct the information,” Adrian Lajous, the oil company’s chief executive from 1994 through 1999, said in a phone interview from Mexico City.
6.5 percent is a huge gap. That’s 160,000 barrels per day of oil they reported that was just water.
As Matt Simmons noted at one time, the output from a lot of old giant oil fields, e.g., Cantarell, was better characterized as “Oil stained brine,” rather than crude oil.
And as discussed in earlier posts, it’s likely that KMZ is beginning to follow the same downward trend as Cantarell.
But hey, with all that ***EXPERTISE*** about to arrive via US companies, they will create oil from empty rock pores!
260K not 160K
And in the delightful subject of counting things that are not oil (ala VOCs in Bakken ouput):
http://www.nytimes.com/2014/08/13/business/energy-environment/with-a-natural-gas-byproduct-iran-sidesteps-oil-sanctions.html?_r=2
hahahaha look familiar? Condensate can be exported when there are oil export restrictions. Iran is selling 500K bpd of condensate. Maybe they label condensate API 39.
Sorry, left out the relevant quote:
“Condensates represent a gray area in the oil and gas world, and even OPEC is challenged about how to define the product. Under OPEC rules, condensates are not included in oil export quotas allotted to its members ***even though they are commonly included in statistics for oil production and reserves.***”
err 160, you’re fine.
Sounds like the major effect of shale oil is to provide money to all the support industries (drilling, fracking, trucking, piping, railroads, etc.). Can’t stop drilling or production drops like a rock. Not only does this “new” method of oil production have monetary problems but it appears to have lower EROEI and therefor a higher greenhouse gas production per unit of usable energy. It is also soaking up a larger amount of society’s resources with less net effect.
The key factor here is the trend that energy production has followed. With advances in production techniques for electronics and other industrial products, price per unit has fallen dramatically. With energy production, advances in technology coincide with increasing costs. With that kind of result, fossil energy production is doomed in both total availability and from economics.
From a personal survival standpoint, I only need about 12,000 BTU of food energy per day to survive. The rest is destructive excess. It seems that civilization goes to extreme excess to provide mostly unnecessary products. Apparently, in the US, the per capita energy use is over 700,000 BTU per day! Not a very efficient system.
The North Sea might be a case history for your argument(s). With (rapidly) decreasing production it is nearly five times more expensive to extract a barrel of North Sea oil than it was in 2002. It seem as though the law of diminishing (oil and gas) returns is like time’s arrow – only one direction allowed.
Hi Doug,
It is a good thing that oil prices are roughly 5 times higher than they were in 2002, otherwise new wells would not be worth drilling, at this point North Sea output is not as big a factor in World output (due to rapid declines). Oil is indeed becoming more expensive to produce as you have pointed out on a few occasions 🙂 At some point oil will be used more efficiently as oil prices rise and if not (or if prices rise very quickly) the economy will crash, such a crash is likely inevitable, how soon it occurs is the subject of much debate and depends a lot on decline rates.
I think it is much easier to give a concrete explanation of what future decline rates might be by considering estimates of reserves and depletion rates, others prefer to make assertions that the decline rate will be x or y.
Hi Dennis,
“…at this point North Sea output is not as big a factor in World output (due to rapid declines).”
True and I don’t know a lot about the UK but the EIA estimates Norway was the third largest exporter of natural gas in the world after Russia and Qatar, and the 12th largest net exporter of oil in 2013. I know quite a few oil people in Norway who insist that this status is projected to continue for many years yet. So, Norway, “not a big factor”, perhaps, but not a small bits player either. I MUST add, Norway is the largest holder of oil and natural gas reserves in Europe and provides a great deal of the oil and natural gas consumed on the continent. My wife made me add the last sentence. [yellow face].
Doug
12,000 BTUs is 3000 food calories a day. That’s a lot.
Not really, depends on levels of physical activity. Extreme athletes can burn through a lot more. 3000 for an average male performing significant physical work would be about right.
My guess is that Allan H is physically quite active.
Or fat. haha
I assumed an active life, even at my age I lose weight at 2000 Calories a day. A tour de France rider uses over 4400 Calories a day including the rest days on one of the most efficient travel methods devised with a very fit efficient body.
If your raising your own food and animals, chopping wood, doing all the other things needed to survive and live, I assume 3000 might keep you alive.
Here is a more detailed article on how many Calories people burn per day.
http://www.outsideonline.com/fitness/nutrition/How-Many-Calories-Do-You-Burn-Each-Day-.html
A 200 pound farmer or builder calculates out at 3850 calories.
That just raises the bar for when the time comes to consume storage. The nomad army with rifles and national guard armory mortars coming to take your storage burn even more, so they have to take even more.
If you are lucky enough to live in the south where soldiering is a respected part of life the guys in the guard are friends and neighbors.
I expect to share with them but they are not likely to raid me no matter how bad things get. But they might wind up running emergency food distribution if things get really bad. I expect that in some developing countries and third world situations and maybe a few places even in the US but not in the agricultural south.At least not within the next decade or two.Food stamps yes. Three or four times as many people on welfare and make work jobs. Maybe half of us before things stabilize. But probably not forced confiscation of crops from farmers and that sort of thing.
I didn’t say it was guys in the local guard. I was just describing where they would get their mortars.
Two links from the post did not show correctly:
1)The method I used for this is called Kriging
2) as Google maps have this distortion
Hey Enno, this is a good analysis you have presented here. With the exception of the 2013 data, you should be happy to know that what you have plotted appears to correlate well with the work the North Dakota Geologic Survey has done concerning delineation of the Bakken-Three Forks sweet spots. See, for example, the posters here and here. The only thing I would really question is your 2013 data. Clearly something is “off” there. I would probably lean on the first explanation you gave since your contours suggest a dramatic march eastward of drilling and well completions, far into Ward County even, when in reality that has not happened.
Speaking of the Geologic Survey, over on the Million Dollar Way Blog, this link, which you may be interested in, was shared. I guess that is a “hidden” page on the NDDMR site that shows cumulative production statistics for Bakken source system horizontal wells. Importantly, there is a general distinction made between Bakken and Three Forks wells (not the individual benches of the Three Forks, though), as well as some other configurations, such as the wells that try to simultaneously target two formations, a practice that has now mostly been abandoned since the operators feel they can get better results by placing separate wells into each formation.
That last phrasing is a big deal. Some investor presentations hyped dual layer targetting as a way to get big IPs without a stage count expansion. Apparently it failed.
Oh and the march eastward may not have happened. It might be that eastward is where the big stage count increase happened. Not more wells in Mountrail. Just longer ones. The Ward county stuff makes no sense, tho.
Thanks for your great comments and links again Wes. I agree with you on the 2013 data. I will take some time to pour over your links. Very nice to find formation data for individual wells.
Enno,
I use an application called Canvas, current version 15, and it is widely used for GIS by Landsmen and many others with Geo referencing needs in the Oil business.
There is a projection under WGS84 called North Dakota CS27 North Zone
The method is Lambert Conic Conformal (2SP)
Area of Use USA – North Dakota – SPCS -N
Longitude of false origin -100° 30’00.000
Latitude of false origin 47° 00’00.000
Latitude of 1st standard parallel 47° 26’00.000
Latitude of 2nd standard parallel 48° 44’00.000
Easting at false origin 609601.219 m
Northing at false origin 0.000 m
I’m pretty sure that most GIS apps already have this projection as a built in option.
It shouldn’t be too hard to re-project the maps with it if one wanted to, though frankly I think your maps are fine as they are.
Thanks Fred. I used the application “Surfer” for this effort, which also makes a quite comprehensive impression. I now see that the coordinate system you describe is indeed available in this package, so that will be helpful for a next time.
Hey Ron!
I found something u might b interested in:
http://www.kayakfishmag.com/news/hobie-adventure-island/
NICE!
What do you guys think about this??
http://www.zerohedge.com/news/2014-08-13/oil-market-qe-premium-coming-out-price
Can’t be bothered with a long answer.
Short answer: not much.
Question: Does anyone know the approximate number of barrels of Shale Oil, (LTO), per metric ton? A ballpark figure is all I am looking for. I know there is a difference between the Bakken, Eagle Ford or where ever but I am looking for an average number. Or as close as anyone might guess. I know it would be more than WTI crude but I don’t know how much.
Also, what would be the average number of barrels per ton for world production? If they, Russia, makes a prediction for future world production in tons, what multiplier should I use to get that in barrels? Best guess?
I am trying to do some work with Russian predictions on future shale oil production and they always use tons, never barrels.
When I surfed for distribution yields in the assays, I constantly found disclaimers about the huge variability of Bakken oil. An average may not help you much. It will vary year to year by which county is being drilled.
And a huge item was talk of how much metal content was in it. Whatever weight numbers you get, it’s not all oil.
An average will help me and that’s all I want. Otherwise I will just have to use my own best guess.
Hi Ron,
BP uses 7.33 barrels per metric ton in their statistical review of world energy for all world oil. I do not know if a barrel of LTO is close to average.
Never mind, I think I have enough info to work with. I went here:
EIA Barrels of Crude Oil per Metric Ton.
I averaged all their world numbers for 2012 and came up with 7.274 barrels per ton. So I am going to use 7.27. It is not all that important, all I need is a ball park figure.
I also found, on the web, that a ton of condensate contains about 8 barrels, according to BP. So shale oil is just a little heaver than condensate so I am going to use 7.8 barrels per ton for light tight oil.
Close enough.
good number, have seen several places a Mountrail county API of 42. That’s just 3 away from official condensate.
Ron,
http://www.oecfh.com/api-baume-specific-gravity.htm
Here is a link that converts API to Specific Gravity, pick your API and you should be able to work it out from there.
1bb=159litre
1m³ = 6.2898US bbl oil
Rust and depletion,courtesy of Matt Simmons,never sleep. Neither does inflation, courtesy of OFM.
We will never see eighty five dollar oil again except maybe as the whiplash negative feedback response to a sudden spike as happened the last time prices spiked very high. Think five hundred car pile up on a freeway after that happens with everybody flying and then traffic stopped or almost stopped with nobody buying but a lot of people contracted to take delivery- and the gasoline and diesel piling up at the retail end. Prices may collapse temporarily into the eighties or even lower but only for a few weeks or months.
Any body who had money and means of taking delivery of actual oil when it fell into the thirties made a killing when it went back up. And given that the marginal cost of the last few million barrels (I have no idea how many million but a lot) on the market was much above the thirties it had to go back up or else the economy had to collapse at that time due to oil starvation.
The people who believe in deflation lowering prices are confusing deflation with collapse. No government with the power to print money is ever ever ever going to allow an outright collapse when it can be postponed for at least a little while by printing money.A properly managed inflation might even postpone a collapse for quite a while if the underlying causes are not getting worse too fast.
Now the banking system we have at the moment is feeding all that printed money to the only sobs in the country who have no actual need of it- the owners and managers of the super banks, the ones too big to fail.
BUT when the fecal matter really hits the fan the federal government can and WILL do a whole damned bunch of things to put the money into the hands of the people including mandating a living wage. Call that welfare writ large for all the people having a hard time making ends meet. It will not actually cure our problems but it will alleviate the worst of the symptoms for a while. Think having a lot of pain and getting drunk.Drinking helps the pain enormously in the short term but makes the overall situation worse over the long term.
Now a controlled inflation is and has long been established public policy in this country and so far as I know just about every country with a central bank.
If the underlying economic malaise is not TOO bad inflation may control it to some extent in combination with other policies.
Uncle Sam can print money and provide low interest loans to the domestic oil industry but there is almost nothing at all he can do about the undeniable fact of the depletion of the old legacy fields that supply the vast majority of the worlds oil.
And while I am mightily impressed with the success of the tight oil industry in this country I have not seen any realistic scenarios indicating that tight oil is going to ramp up fast enough and and long enough -meaning for decades – to offset long term depletion of conventional oil.
Agreed
Blogging comment are apt to be off the top of the head and incomplete. Mine often are.
In the case of a severe economic slowdown oil might descend into the eighties for a while because there is still a huge amount of oil on the market that costs eighty or less to produce it.The suppliers of this oil can continue to sell at a profit.
Beyond that there is the possibility- the almost dead certainty- that some producers will run at a loss maybe for a long time for the simple reason that they have no choice.
Costs are best thought of as variable and fixed in a business for discussion purposes.
Once an oil field is developed it might cost for example twenty five dollars a barrel to pump the oil and deliver it to a buyer even though the total cost including all interest, land rights, drilling expenses, and so on plus the actual day to day operating costs of the field might add up to a hundred dollars a barrel.
If the owner finds himself in an eighty dollar market and is short of cash he will either have to sell for eighty to get the sixty in cash flow or sell out and quit the business. Either case is unsustainable for any extended period of time but since most of the oil coming to market world wide is government owned and governments generally have access to enormous amounts of credit as well as enormous financial obligations –Well then , that oil will continue to flow at a loss.
But a losing business cannot be sustained over the long term even by a government when the business is as big and as critical as the oil business.Even governments sooner or later run out of ” other peoples money”.
Incidentally there is no discrepancy between my argument that governments can print money and their still running out of other peoples money. Printing money is a form of tax collection.If you have a million in cash and the bank is paying you two percent and prices are going up at four percent because of printing money the government is in effect either stealing or taxing you ( take your choice )at the rate of two percent annually of your cash reserve.
Holding onto any substantial amount of cash over any extended period of time is about as sure a way of losing half or more of it to inflation as tossing it in a fire.
But a big old cash stash would still be a great thing to have when the fecal matter hits the fan because there are going to be bargains ” cash only ” that yard salers and pack rats like yours truly can only dream about in ordinary times.These bargains will extent to the stock market if you have the cash and are willing to assume the risk of the market coming back.
https://en.wikipedia.org/wiki/Wampum
The economics of a sustained oil shock are difficult to define. Supply shock in general is challenging, but in a Peak scenario (falling ceiling), it won’t correct the same way as, say, 2008.
I would like to compliment Enno for his efforts, but I am affraid that the method used and consequent results are fataly flawed and should not be used to take definitive conclusions at this stage.
The reference to “distortion” in the maps from Google means that Enno conflated two coordinate systems, upfront casting immediate doubts on the validity of these results. It also appears that Enno calculated areas in a geographic reference system – although GIS software allows users to perform such things, it inevitably introduces relevant errors (note that in this case what you are calculating is the area of a section on the ellipsoid surface).
Secondly, I have major reservations on the way the results are presentend. The expansion of the area where productivity stands above 100 kb/a may be misleading without knowing the number of wells producing in this area. Essentially, Enno assumed this to be a phenomenon continuous in space, which I would say it is not. Still on this point, by using Kriging you are assuming the mean to be stationary, which is neither clear.
None of this may be too hard to resolve. Please contact me if you need help.
Cheers.
I think some sanity checks are in order, so I would suggest that some aggregate numbers are pulled together to verify what is happening.
2D contour maps are always impressive to the eye but often the human brain can’t process them fully to understand what they mean. This is in addition to the concerns that Luis has pointed out.
Consider the 2D contour maps that show El Nino activity in the Pacific. These are very complicated and so the aggregate is shown as a reduced SST index or atmospheric pressure measure.
It is way off topic but still the sort of thing important to a lot of us here and well worth reading.
I forgot to copy the link – oops- but at the Energy Matters blog by Euan Mearnes the current post is about the Earths magnetic field reversals and it ties them to climate change.
The goal for this effort was for myself to get a visual rough idea on the location and size of the area where the Bakken gets its success from, and the trend in that data over the last few years. We have seen claims on this website that the hot area is as large as 10-20.000 square miles. I could not find a public similar effort, although Wes now posted some links that look very useful.
I acknowledge that I am an amateur GIS user, and would not use my results for financial decisions. But I’ve done enough data transformations to know what a reasonable (for my purposes) approximation is.
I’ll be happy to share the source data (long/lat/1 yr return triplets) with you and challenge you to show me where the results are fatally flawed. I agree on the doubtful results for 2013.
How big is the error from these map distortion effects? miles or 10s of miles? We may have the explanation now for the big red splotch extending eastward of Mountrail county.
Enno,
Congratulations! Best and most informative Bakken article I’ve ever read at this site. However, coming from me, I suppose that’s much like a kiss of death, so I hope you don’t receive too much flak on my behalf. I have not yet had the time to fully analyze it, but there is nothing about it which caused me much concern. The maps you made are very clear and revealing in my opinion, and again just at first glance, I believe they give an accurate view of Bakken well developments and EUR’s over time. I’ll have to get back to you later on this. Many thanks!
Luis,
Keep in mind that Enno has confirmed that there is at least, and about, one well/ square mile (on average) over most of this map space. But, there is a far lesser well density in the outermost (low EUR areas). And in several high EUR areas there are on going well density experiments (up to 16 wells/ square mile… in four different levels (zones) or four wells/sq. mile/zone.) Besides that, a few companies have plundered their respective sweetspots with 4-8 wells/ sq. mile, but all in all there has not been that much focus on oil production from the so called sweet spots, as many peak oilers erroneously believe.
So, on AVERAGE, one well/sq. mile about gets you there. There are presently about 10727 wells in ALL of ND, which pretty much equals the size of the thermally mature Bakken, which is about 10,000 sq. miles. That entire area is expected to be produced on 160 acre spacing/ zone, or 16 wells/sq.mile, so you can expect to see no less than 160,000 wells put in just there alone. The Bakken peaking any minute now? Ya, right! Reality check, anyone?
http://www.greencarcongress.com/2014/08/20140813-stringfellow.html
The first sensible article I have seen on the contents of frac fluids. It basically comes down to corrosion inhibitors and biocides as the baddies. Both are understandable, as Guar gum goes rotten very quickly left to its own devises.
“54 of the compounds are organic; of these 27 are considered readily biodegradable.”
Hmm, is there a lot of biodegrading going on 2 miles down at that temp?
Probably not much bio degradation but at ambient temperatures and pressures a mile or more down most larger organic molecules will gradually decompose. That is why there is oil and gas there as opposed to organic sediments.
It might be that if these chemicals escape to the surface or to potable water aquifer depths there will be some real problems. My guess is that the probability of this happening occasionally is pretty high and that the problems will be serious ones.
The majority of state and local governments are not likely to stay on top of such a fast moving business as the oil and gas tracking industry.
If I lived where fracking is going on I would be very concerned but not panicked.I would definitely have my well water tested by labs on the lists of companies that are approved by health departments and the results notarized and filed safely away in the case of future contamination.
The real problems if any most likely won’t be felt for years in most cases as old wells that are inadequately sealed off start to leak.
By then the guilty parties will be either dead if human or will have changed identities half a dozen times if immortal corporations.
Some people live in heavily fracked areas fifty or a hundred years from now may be compelled to drink rain water and maybe bathe in it too but my guess is that most farmland will still be farmable. Crops mostly don’t absorb noxious chemicals from the soil but it does happen and some of these chemicals might go right into grain or veggies or up the food chain into meat and milk.
Since most of them have apparently never been used on farms I doubt if anybody really knows which ones if any are going to be taken up by plants and travel up the food chain.Finding out is going to take a few years and a few million bucks per chemical.
Watcher,
They are more concerned with how to treat the frac fluids that return after the frac has taken place. A fair bit comes back to surface and currently it is reinjected into deep permeable formations. If it could be treat at surface and returned to at least industrial quality water or better still pot water quality, then all that water can be recycled, and not just wasted and thrown away.
Quality posts is the key to interest the viewers to go to see
the web page, that’s what this site is providing.
Press release
http://www.marketwatch.com/story/vine-oil-gas-and-blackstone-energy-partners-to-acquire-shells-haynesville-assets-2014-08-14
The only info in it I think is relevant is that Shell is pulling out of another hundred thousand acres of shale gas holdings. Maybe the buyers can make a go of it and maybe Shell is too big and clumsy to get that gas out economically. Maybe Shell is wrong about gas prices staying down for a few years.Maybe the buyers are confident gas prices are going to go up.
All I can conclude personally is that a company such as Shell is very apt to have top of the heap economists and geologists and marketing specialists on board as well as their engineering staff and if they think gas prices will stay down for a good while they probably will.
On the other hand maybe Shell came to the conclusion that there is not nearly as much gas under that hundred thousand acres as they thought when they bought into it.
The old military adage is to watch what the enemy actually does as opposed to what he talks about doing and to always be aware of what he CAN do as opposed to what you EXPECT him to do.
Shell cannot develop that acreage without buying it back.So they either most likely think it cannot be developed profitably or else—— maybe they just needed the billion bucks they got for it to keep the stockholders from getting to riled and firing senior management.
What I have been watching is who. Not where or what.
This is why I urge folks to spend less time worrying about the economics of shale drilling and oil plays in general. We’re talking about government here. It is utterly, absolutely, unequivocally conceivable that a government would subsidize consumers consumption at exactly the same time as they subsidize producer efforts, and RDS is not an American company. They can’t hope to ever get subsidized — so I do wonder if there is some esoteric tidbit in the oil relevant tax regulations that are helping to fund shale production.
The point being, when you have to have the oil, what it costs to get it out of the ground Does Not Matter because those costs are measured with a parameter that can be created at whim. If you have to have the oil, and it’s there, regardless of cost, you’ll get the oil.
Mac,
Shell, technically wise, is a great company, but high cost. The Haynesville has been dropping ever since the price of gas started to fall, where as the Marcellus has kept on increasing even with local nat gas prices of around $2 mcf, a lot less than Henry Hub. So Marcellus looks low cost where as Haynesville looks high cost.
Over the next 2 years several large gas pipe lines that were built to take GOM, Tx and La gas to the north, are being reversed. This will put even more pressure on the price the Haynesville producers will get for their gas. So for me there is no surprise that Shell is getting out, as they are selling up many of their high risk, and low return assets.