The Eia’s latest Drilling Productivity Report is out. However they have only updated the PDF file. The spreadsheets have not been updated and still have last month’s data. But I will give you what the PDF file shows and perhaps add some charts tomorrow if they get around to updating the Excel spreadsheets.
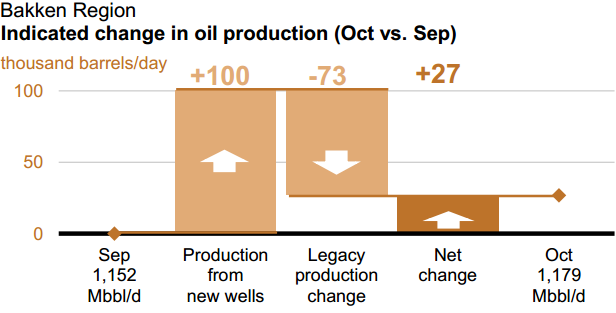
The EIA says Bakken new wells will produce 100,000 bpd in October but all the old wells will decline by 73,000 bpd and leave a net increase of 27,000 bpd. If these numbers are correct and September production was 1,152,000 bpd then that means the monthly decline rate is 6.33%.

The EIA says Eagle Ford new wells will produce 154,000 bpd in October but all the old wells will decline by 123,000 bpd and leave a net increase of 31,000 bpd. If these numbers are correct and September production was 1,551,000 bpd then that means the monthly decline rate is 7.93%.
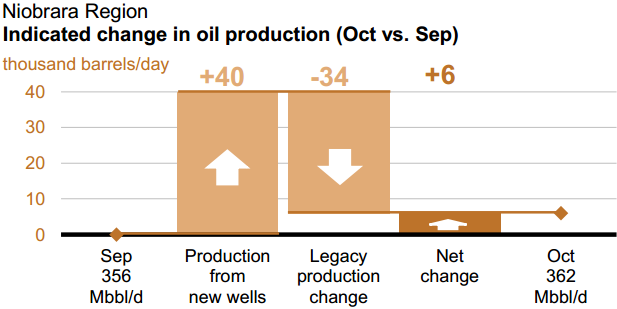
The Niobrara, located in Colorado and Wyoming produces a lot of shale oil but also has the highest decline rate of all. Niobrara new wells will produce 40,000 bpd in October but old wells will decline by 34,000 bpd. If September production was 356,000 bpd and the decline was 34,000 pbd then Niobrara has a decline rate of 9.55%.
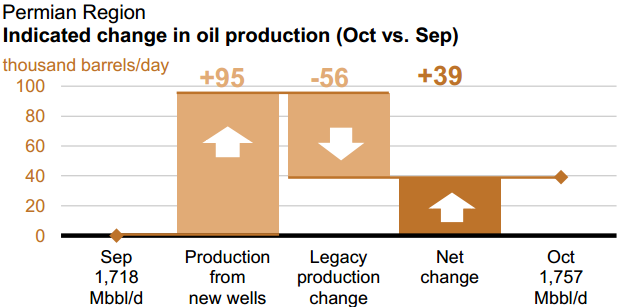
The last big shale oil producer is the Permian. The Permian new wells will produce 95,000 bpd in October and their old wells will decline by 56,000 bpd leaving a net increase of 39,000 bpd. That gives the Permian a decline rate of 3.26% per month. The reason for the low decline rate of the Permian is because most of the old wells are conventional wells and not tight oil wells at all. However I would imagine most of the new wells are tight oil wells. “Drilling the source rock” is the new big thing in the Permian, or the “Petroplex” as some of the promoters have dubbed it. Of course all the older conventional wells are in the higher reservoir rock.
The combined decline rate of all the tight oil plays, including the Permian, is 6% per month.
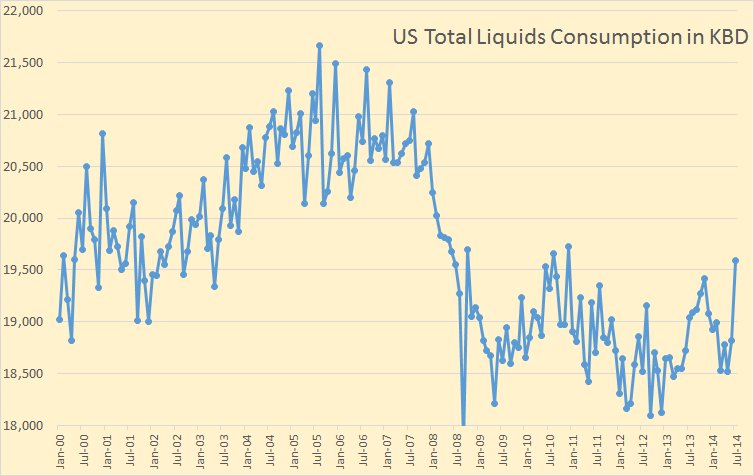
US consumption reached 19,595,000 barrels per day in July, the highest since December of 2010. The consumption data is from the EIA’s Monthly Energy Review. They call it “Total Products Delivered”.
The most successful oil trader of all time is betting oil prices will go up… way up.
Crude oil trading legend makes his boldest bet yet
“When you believe something, facts become inconvenient obstacles,” Hall wrote in April, taking issue with an analyst who predicted a shale renaissance could result in $75-a-barrel oil over the next five years.
Hall is going all in on a bet that the shale oil boom will play out far sooner than many analysts expect, resulting in a steady increase in prices to as much as $150 a barrel in five years or less.
And here is something that I did not know:
Investing ever-larger sums of his own money, he’s buying contracts for long-dated oil, to be delivered as far out as 2019, according to interviews with two dozen current and former employees and advisers who are familiar with Hall’s trading but aren’t authorized to speak on the record. To attract buyers, the sellers of these long-dated contracts — typically shale companies that have financed the boom with mounds of debt — need to offer them at a discount to existing prices.
People who are selling these far out contracts are typically shale oil drillers who are trying to raise money. They are already up to their eye teeth in debt and to raise more money they are selling their oil, oil they hope to produce in 2019.
In his counterarguments, he digs deep, delving into the minutiae of how Texas discloses oil production, the tendency of some shale wells to play out quickly and the degree to which the boom has relied on debt. The simplest of his reasons, though, is that producers have already drilled in many of the best areas, or sweet spots. Hall predicts that growth in shale output will begin to moderate this year and U.S. production will peak as soon as 2016.
Richard Heinberg has a new article out on “OilPrice.com”
Why Peak Oil Refuses To Die.
Perhaps you’ve seen one of the recent barrage of articles claiming that fears of an imminent peak and decline in world oil production have either been dispelled (because we actually have plenty of oil) or are misplaced (because climate change is the only environmental problem we should be concerned with). I’m not buying either argument.
Why? Let’s start with the common assertion that oil supplies are sufficiently abundant so that a peak in production is many years or decades away. Everyone agrees that planet Earth still holds plenty of petroleum or petroleum-like resources: that’s the kernel of truth at the heart of most attempted peak-oil debunkery. However, extracting and delivering those resources at an affordable price is becoming a bigger challenge year by year. For the oil industry, costs of production have rocketed; they’re currently soaring at a rate of about 10 percent annually. Producers need very high oil prices to justify going after the resources that remain—tight oil from source rocks, Arctic oil, ultra-deepwater oil, and bitumen. But oil prices have already risen to the point where many users of petroleum just can’t afford to pay more. The US economy has a habit of responding to oil price hikes by swooning into recession, and during the shift from $20 per barrel oil to $100 per barrel oil (which occurred between 2002 and 2011), the economies of most industrialized countries began to shudder and stall. What would be their response to a sustained oil price of $150 or $200?
I’ve commented about Andrew Hall’s ‘Great Trade’ elsewhere, the point to consider is that the petroleum industry is already broke — there are articles about the credit risk of the industry (junk) — so are the customers who are the industry’s other source of credit.
That is, the customers borrow to buy fuel; that is, the industry borrows against the accounts of its customers.
If both industry and customer are unable to borrow (which would be why oil extraction is faltering) who will do so? Don’t say ‘government’ because that is simply a stand-in for the customers (who would be on the hook for repayment just as they are when they borrow themselves).
Right now, current prices are bankrupting customers faster than the drilling industry can wheedle new loans (these new loans by themselves being a cause for customer bankruptcy). This ‘Red Queen Wins’ credit race between drillers and their customers is why prices are declining in the teeth of two major wars and a multitude of other, smaller wars. Of course, reductions in supply will not make either drillers or customers richer. They will be able only to afford less … at lower costs, a self-amplifying cycle that will only end when the price of crude falls to near zero dollars and extraction falls sharply.
Remember, we don’t have any cheap oil left, the last was burned in 2009. Also, at some point Hotelling’s Rule comes into force, where the future VALUE of a resource is greater than any present WORTH of it. When Hotelling’s Rule breaks it is because there is no future, that is no ability to use the resource by way of industry.
Steve from Virginia,
I totally agree with your comment. Just like Jean Leherrere stated, “shale oil reserves depend more from economy than from technology.” I don’t believe many people really have a clue just how fast the Financial and Energy system can come crashing down once the forces of GRAVITY works its magic.
steve
One more thing,
Deborah Rogers at the EnergyPolicyForum.com, does some excellent work writing about the DELUSION called the Shale Energy Industry. I recommend taking a look at her recent article called… THE SHALE SUGAR LICK: http://energypolicyforum.org/2014/08/13/the-shale-sugar-lick/
She presents this chart of 5 shale players’ interest expense percentage to operating income. As the saying goes… A PICTURE is worth a thousand words.
steve
Darn.. I forget the chart. Here’s the chart…
Ron,
Fer some strange reason… the charts are not coming through.
steve
This is a test to see if the Chart comes through. It is the combined production of Eurasia + C&S America + Asia & Oceania + Europe + Africa through May 2014.
Seems to work okay for me.
I think this is the chart you were trying to post.
Ron,
Yeah… thanks a million. That’s the beauty.
steve
That is an incredible graph. Thanks for posting it!
Income = revenue – expenses
If we throw in some numbers like:
Income = 10, Revenue = 100, Expenses = 90
then according to the chart, (interest expense) = 5
This seems rather low.
I agree with most of what you say. The way I put it is that peak oil is a low price problem, not a high price problem. It is very easy to show that the more important a quantity is for the economy, the lower its scarcity rent. This makes perfect sense, scarcity of an essential item makes the economy crash, lowering the price.
Where I disagree with you entirely is with respect to Hotelling. Hotelling’s rule is not verified empirically, and as far as I’m concerned it is a useless tool for predicting the future. However if the market price for oil falls below production price for any reasonably long period of time, one can expect oil production to fall precipitously. We seem to be close to this occurrence in the case of light tight oil.
Ok, so I am going to go out on a limb here and suggest that a monthly decline rate of 6% across all tight-oil plays in the US is quite steep? I’m not that good at mathematics, but would that not suggest something approaching 60% annually?
When the drilling stops, for whatever reason, there will be a lot of anger and tears.
It seems to me that almost no one in the media is paying any attention to decline rates. Note that a few years ago, circa 2005 or so if memory serves, ExxonMobil put the global decline rate from existing oil wells at about 4% to 6% per year.
The EIA’s numbers for the decline rate from existing Bakken and Eagle Ford Shale Play oil wells are at about 6% and 8% respectively, except that they are talking about per month, rather than per year, decline rates.
Some numbers for extrapolated declines:
If we combine the December, 2013 EIA numbers for Bakken + Eagle Ford, they produced 2.2 mbpd of Crude + Condensate (C+C) in December, 2013.
If we extrapolate the EIA’s estimates for month over month declines in legacy production*, the oil wells completed in these two plays in 2013 and in prior years would be down to a combined production rate of about 0.9 mbpd in December, 2014, about a 60% decline in one year.
Or, in other words, based on EIA data, the industry would have to add 1.3 mbpd of new production from 12/13 to 12/14, just to offset declines from existing Bakken and Eagle Ford wells (completed in 2013 and prior years).
The EIA puts US C+C production at 7.9 mbpd in December, 2013. If we assume that the balance of existing US C+C production (excluding Bakken + Eagle Ford) is declining at about 7%/year, the remainder of US C+C production in December, 2013 would decline by about 0.4 mbpd from 12/13 to 12/14.
Based on the foregoing, existing US oil wells as of December, 2013 would decline by about 1.7 mbpd from 12/13 to 12/14, and again based on the foregoing, just to maintain US C+C production for 10 years, the US would have to put on line the productive equivalent of about 17 mbpd, or approximately the productive equivalent of the current production from Iraq, times six.
So far, the US oil industry has been able to offset declines and add new production, but the higher the production rate, the greater the volumetric loss of production from prior wells, which is why Peaks Happen. It’s when, not if, that the industry is not able to offset the declines from existing wells.
*If we are looking an projecting multi-year declines, one would need a hyperbolic or two-step exponential decline estimate, but for just 12 months, I think it’s reasonable to extrapolate the current EIA monthly estimates.
Jeff,
So, you’re saying that in order for the Magicians drilling oil in the Bakken and Eagle Ford to offset the decline rates, the U.S. Glorified Oil Industry would have to add (6) times the current Iraqi oil production.
I don’t see this as a real problem if they can bring on say (20) new Monterey Shale Projects. Of course, it is a bit more of a challenge now that the Monterey was downgraded 96%, but there’s still an excellent chance that something else will come up with a little luck and a great deal of Funnel Fan Capitalism.
steve
It would be good to know how much production was put online in the last 10 years in the US. Then we can put the 17 mbpd figure into perspective.
Remember the concentration of production in year 1.
That 6%/month is all wells in production. Heavily concentrated in year 1 to 18 months. Older wells follow a negative exponential and once down to low production, decline slower.
Though . . . this may make no sense at all if companies decide to not bother with a truck trip to some of those wells, but keep them quoted as operating to avoid plug and abandon expenditure. Since royalties are collected by the state and land owner, essentially no one has any incentive to point out the oil is not really flowing from those old wells. Ten dollars in royalty per month to avoid spending $80,000 for P&A . . . .
From my post:
Ya, I’m good with that. Your first sentence is more thought provoking re the media not caring about decline rates.
No reason they should.
Seriously, I noticed in a recent data point on housing that all areas of the country declines with the exception of the Midwest. They weren’t talking about Iowa or Missouri. We know what drove that number. The frantic activity up there is nudging the needle SIGNIFICANTLY on NATIONAL GDP.
An oil boom . . . how much oil is coming out doesn’t matter one iota. A “boom” is defined by how much activity is going on. How many jobs are happening. How many people are paying taxes. Those companies suddenly can’t keep the music playing because the economics don’t work? Doesn’t mean a thing. The gubmint WILL keep that music playing.
Decline rates mean less oil is coming out? Doesn’t matter. The peak in NoDak may have already happened. Nobody has any incentive to say so. There is enormous incentive to not say so. If it’s borrowed money, you can’t even say something rational like “the companies would not be drilling so frantically if they weren’t making money”. Why wouldn’t they? Hell, maybe banks were told to keep that money flowing and the Fed will protect them from bankruptcy. It has a history of doing that with banks, after all.
ND didn’t participate in last decade’s housing boom. Instead it’s got its own housing boom going on now thanks to the Bakken.
Fortunately these lot should be able to pay them off. Unless of course they piss it up in the whore houses like their daddies and grand daddies did.
The old bumper sticker, “Please lord give me another oil boom, I promise not to piss this one up against the wall”.
Will times ever change?
Wow 2,000 houses. That’s enough to house 0.0017% of the country’s population!
Not much different from what Arizona has been doing since the housing boom went bust. Arizona though is about 9 times more populous than North Dakota. On a relative basis, the current housing boom in North Dakota is enormous. Perhaps even bigger than the one in the southwest (Arizona, California, Nevada) last decade.
Does the amount of water coming out decrease along with the amount of oil?
In conventionals, no. The water cut worsens.
In these, probably.
A decline rate of 6% per month means if no drilling, each month you will get 94% of what you had last month. A year has 12 months, so if no drilling, at the beginning of the following year, your production will be 0.94^12 (0.94 to the power of 12) = 0.476 of what you had at the beginning of this year. So the annual decline rate is 1-0.476 = 0.524 or 52.4%.
Not quite that steep. That 6% is the average of all wells. ALL WELLS. If we excluded wells < 18 months old, that 6% number would be much smaller.
So 40% of production is older wells and they are not declining at 6%/month and that 40% would shallow out the whole shebang.
It's steep. It's not that steep. Probably something like 20% loss in year 1.
Orrrrrrrrrrr one helluva lot more than that because if drilling stops, a helluva lot of truckers will read writing on the wall and leave. Then you get some serious steep declines because you have to shut off the wells if there are no trucks to haul salt water.
The truckers will stay so long as they are working and getting paid but not more than a few weeks longer waiting for work to pick up again.
But they will not leave any sooner than necessary because there is no significant work available elsewhere for them.
Possible.
I was thinking in a more macro aspect. The day the peak is acknowledged, what starts to leave town? Who starts to leave town? The banks probably do, unless the gubmint covers all losses and funds their continued loans for activity — but no more road workers widening highways. No more hotels being built. No more houses being built.
Ooooh, and no more permits for salt water disposal wells get approved because no more are submitted. The salt water disposal companies will be folding.
The loss of the aura of growth sends people elsewhere looking for opportunities that do not require them to endure 30 degs below zero winters. Now that I think about this deeply . . . THIS is what steepens the post peak decline. No one is going to stay up in that hell hole who wasn’t born there and thinks all winters are like that everywhere when they KNOW the future is bleak.
Do you have it backwards? Do the older conventional wells, particularly in the Permian Basin, have much lower decline rates? In which case the newer tight oil wells would have a much higher decline rate than 6% a month
Never mind, after re-reading, I misinterpreted what you wrote
How come these data are for Sep to Oct change when we are only at the start of September? Are these predictions or has someone got the months mixed up?
Hugh, the last several months are only the EIA estimates of what will be produced.
I’m sure somebody here knows what ”so4:38:05 PMells ” means but I don’t mind admitting that I don’t have a clue.
Pretty soon the world is going to be in the same position as the good kids in old movies with big fat old southern red neck sheriffs wearing the black hat.
The classic line is “You in a heap o trouble boy”.
That was an error in the “copy and paste”. I have corrected it.
Just a typo it should be some wells or something like that.
It was not a typo. The copy and paste function screwed up and I did not catch it. Sorry. And it was “some wells or something like that”.
In his counterarguments, he digs deep, delving into the minutiae of how Texas discloses oil production, the tendency of some shale wells to play out quickly and the degree to which the boom has relied on debt.
Don’t know if anybody has noticed but the US drilling count is up 145 unit from 12 months ago.
http://www.eia.gov/naturalgas/weekly/#tabs-rigs-2
“The total U.S. rig count rose by 18 units to 1,914 as of August 29, according to Baker Hughes Inc. The natural gas rig count rose by 8 to 338 and the oil rig count rose by 11 to 1,575. Natural gas rigs are 42 units below year-ago levels, while oil rig counts are 187 units greater than their levels last year.”
They have gone mainly into oil drilling, but not sure which areas. Is this increase drilling the only thing pushing the oil supply, and keeping the red queen at bay? Or has the lag not got through he system yet, and further increases in production will be seen? Another question I don’t know, are these old stacked rigs being put back to work, or new with higher capacities and new built in efficiency improvements. If they are new builds, I wonder if the drilling companies have gone into debt as well as the oil companies? Normally a drilling company will borrow against a signed contract for a large part of the new cost. Problem is if the contract falls over?
I think we will have to just wait and see.
Aren’t those guys leased?
Watcher,
The oil rig market maybe different on land in the states then the rest of the world offshore, when it comes to leasing, but there has to be some collateral in a lease or loan and I am sure anybody putting up money in the oilfield knows that when drilling/oil companies can’t pay their bills the market for second drilling equipment is not very good. So the loan or lease is still going to be against the contract, rather than equipment.
Demand destruction through efficiency gains, better trip planning, ride sharing and reduction of recreational trips can easily overcome the price rises. My personal situation may not be applicable across the nation or world but I have reduced my use of motor fuel by 80 percent over the last 10 years. Given the fact that efficiency of vehicles could be doubled and other conservation methods can be employed, demand destruction could easily overcome any price increases, thus moderating price increases and further destroying future production. The snake eating it’s own tail effect
The US is in a prime position to do this since it generally uses transportation fuel quite inefficiently at present. Eventually societal changes, which generally take longer, will also reduce the demand for transport fuel. Changes in housing construction over the last few decades have already significantly reduced the demand for heating fuels despite the increased size of houses. That type of change could occur in transportation at an even faster rate.
No reason whatsoever to reduce consumption because that just provides more to China. You want consumption decrease, talk to China first.
Emphasis on first.
China will not be in a good position to increase fuel imports as price rises will cause the world economy to falter, thus reducing their ability to make money. China will soon be the world’s largest importer of oil, making it especially vulnerable to market prices.
Probably. But since they’ll be getting it from Russia, who aren’t going to be too interested in measuring value by pieces of American paper, maybe “price” won’t matter much.
The best reason for the US to conserve it to stop hemorrhaging cash. Roughly 10m barrels a day at roughly $100/barrel is $1bn a day. That’s about $365 bn a year. By coincidence, the current account deficit in 2013 was $379 bn.
It is not quite that bad. Net imports have been running between 5 and 7 million for the last year.
See the EIA weekly report: Line 33 Net imports.
http://ir.eia.gov/wpsr/overview.pdf
Allan H says: “Demand destruction through efficiency gains, better trip planning, ride sharing and reduction of recreational trips can easily overcome the price rises.”
Yes, there is a lot of demand destruction to be had through the factors Allan H sets out, as well as:
(a) Buying a more fuel efficient vehicle;
(b) Moving closer to work to cut the commute;
(c) Getting a job closer to home to cut the commute; and
(d) Cities and States putting in better public transport (what in the US is called “mass transit”).
The significant fact, though, is that these things have significant lead times and, in the meantime, people scream blue murder about the price of petrol because they have no short term affordable way of cutting their consumption. If you look at the consumption figures Ron has graphed above, you’ll see that the US economy has spent the last few years becoming significantly less oil intensive than it was just before the Global Financial Crisis. This is, above all, a sign of people in the US, over time, adapting their consumption to the new higher prices.
The next rise in oil prices is likely to be a spike, as the market suddenly reacts to falling tight oil production. Because the rise in prices will be extremely rapid, it will hit the finances of many US people very hard and cause severe financial hardship for quite a few. And it will then take the US economy a few years to adapt to those prices through people taking various steps to cut their consumption. It won’t be done quickly, but it will be done.
Short term and instantaneous methods of cutting fuel use I have and am using.
1) plan your trips – do several tasks on one trip instead of taking several trips
2) ride sharing – both to work and for personal purposes
3) cutting unnecessary trips – if you don’t really need to go there, don’t – do something local or at home instead
4) keep your tires inflated, ease off on that accelerator (5 to 10 percent difference)
5) clean and change those spark plugs when needed, as well as the wires – have the spark pattern checked by a service station (ignition coils deteriorate)
6) if you have kids, let them take the bus to school and ride share to activities
7) buy things in larger quantities – reduces number of trips
8) use public transport, bicycle, walk when possible
All told, those things alone can reduce transportation fuel usage by 50% or more.
For heating and cooling, insulating and sealing the home is a great fix for energy use reduction. Living at cooler winter temps and warmer summer temps does make a difference, but insulation and sealing makes a much bigger difference and in most cases pays for itself quite quickly.
If you are an American, conservation is suicidal.
You are providing more to China to catch up, particularly militarily.
Hmmm, conservation is one of the few ways to not be suicidal. Are you going to just repeat your mantra about China or do you actually have some facts to support your statement?
What facts do you want? Chinese consumption growth rate? Growth in Chinese military expenditures? Here ya go:
http://mazamascience.com/OilExport/ check the chinese dropdown. That look like they have embraced oil conservation?
From the wiki:
“In 2014, the Chinese government released its official defense spending at 808.23 billion yuan ($131.57 billion), an increase from the previous year of 12.2%”
US defense spending is not growing, and much of it is military retirement pensions, which don’t effectively kill the enemy so even a comparison of levels is not proper.
Why fuel the Chinese build up by conserving? Do the persuasion there first. Cut their consumption growth rate to zero, and ditto their military spending growth.
Then come issue orders to Americans how to live their lives. Maybe they’ll listen.
We should be conserving to grow our own economy. Taxing gas at the pump would cut imports f fuel. This would increase net exports, resulting in a larger GDP.
We should think less in terms of winning relative to others and focus more on absolute growth.
The US military does not consider China much of a threat.
http://www.stripes.com/news/on-land-and-sea-china-s-nuclear-capability-growing-1.299381
Allen. All of above, plus car club where you call up the car you want, and only when you want it.
And on line shopping, where supermarket takes your order on phone, then delivers it, like my mother did in the depression- never drove a car. Big thrill hitching ride on model T delivery truck.
And- I think I made a bargain with PV+electric car. Have not spent a dime on fuel for last 7 months.
I think that demand destruction will be equal in productive, and non productive sectors of oil consumption. When prices will rise (I don’t think that they ever will above ~130 usd/bbl), some people will buy more efficient cars, but some productive ways of using oil will vanish as well. If oil would be 300 usd/barrel some people would still drvie big cars for fun.
I STRONGLY AGREE in respect to the potential for saving oil in the US in particular by doing the things you mention and agree that they will be done to some extent.
The problem is that people only change their habitual behaviors slowly and sometimes at the last possible minute unless forced to do so by some force such as government regulations.
If gasoline prices go up steadily but gradually people in this country will get the message in the same fashion- gradually – but this is a slow process. Think a decade for Joe Sixpack to realize he needs to get over measuring the size of his manhood by the size of his truck and come to understand that saving a couple of hundred bucks or more on gasoline every month means eating hamburger instead of beans.
This new reality just won’t sink in though until he is actually eating beans in order to make truck payments and buy gas.
When it comes on sort of suddenly he is in the position of losing his shirt trading in a vehicle that he owes a lot of money on and trying to buy a downsized truck. As often as not he is stuck and simply can’t trade. A whole lot of people are underwater on car and truck loans.
I have watched this process play out over the last ten years among my neighbors a good many of them actually so big they have a hard time driving some compact cars and trucks. They used to make fun of people driving them but now they are sucking in their belly and grunting and groaning getting in and out and driving compacts.
Motor scooters are getting to be pretty common around here but I am not yet seeing any electric bicycles.It is too bad the market for scooters has been soured by cheap junky you know where from scooters that seldom last more than a couple of thousand miles. I could buy a dozens on CL with less than a thousand miles on them for one third of the new price today within fifty miles and I live in the boonies.
Anybody who wants a scooter better make sure it is built in Japan with a Japanese brand name on it. It will last and parts and service will be available at established dealerships in any town with more than a dozen traffic lights. There are some good European makes too but they tend to be pricey and dealerships are few and far between.
One of the big reasons for lack of electric bikes is that they are basically illegal in many areas. http://blog.nj.com/njv_paul_mulshine/2013/11/when_it_comes_to_e-bikes_the_t.html
We already saw how demand destruction plays out in the 2005-2008 oil production plateau.
Part of oil consumption is elastic (quickly changed, i.e. vacations, driving the SUV, jet skiing, boating) and part of oil consumption is inelastic (essential use i.e. fueling ambulances, producing petrochemicals, refrigerant, antifreeze, plastics, trucking, freight, package delivery, etc).
From 2005-2007 destruction of elastic demand allowed for the global economy to continue functioning and prices rose slowly. In 2008, after all elastic demand had been destroyed, we ate into inelastic/essential demand – the stuff that keeps the structure of our financial, monetary, and economic system running.
Inelastic demand takes large price changes to have small change in demand, this is literally the definition of inelastic demand. The price spike in mid-2008 that precipitated the global financial crisis WAS the moment we switched from destroying unnecessary demand to destroying essential demand. The result was the near complete collapse of our entire economic and financial system globally.
A similar situation will play out again as production from unconventional oil plateaus. Depending on if we see a plateau like 2005-2008, or a rapid switch to decline, which we have not experienced (the idea of this happening scares me), we may see a few years of slowly rising prices as elastic demand is destroyed. Then, once we get to inelastic demand the price will spike rapidly (since inelastic demand changes require large price changes) and the wheels will begin to come off again.
If we go straight into decline within 1-2 years of peaking fracked oil I cannot fathom what will result. 3 years of stagnant production led to the GFC. I am genuinely frightened what declining production would do.
Keep in mind that all the efficiency gains of the last 5 years are already baked into current demand and thus prices. Efficiency will continue, but recent gains in fuel use efficiencies mean nothing to the future, we are already receiving the benefit, and that benefit is oil at only $100 barrel.
An article by Asher Miller, with the Post Carbon Institute, follows, regarding a column by Tom Friedman. Asher didn’t address the most ridiculous aspect of Friedman’s column, so I added my two cents worth.
Quite Possibly the Dumbest Thing the Mustache Ever Wrote
http://www.resilience.org/stories/2014-09-08/quite-possibly-the-dumbest-thing-the-mustache-ever-wrote
An excerpt from Tom Friedman’s column:
My comment:
I’m afraid that Asher Miller missed the most ridiculous aspect of Friedman’s comments. The most recent four week running average estimate for US crude oil production (actually crude + condensate) is 8.6 mbpd. US crude oil refinery runs were 16.4 mbpd. The US exported 0.4 mbpd of crude oil and imported 7.7 mbpd of crude oil, leaving net crude oil imports of 7.3 mbpd.
Let’s assume that the US increases crude oil exports by 2.0 mbpd, from 0.4 mbpd to 2.4 mbpd. However, to meet refinery demand, we would have to boost crude oil imports by 2.0 mbpd to compensate for increased exports. So, under this scenario, the US would export 2.4 mbpd and import 9.7 mbpd, leaving net imports at–drumroll please–7.3 mbpd.
How would this “Significantly dent the global high price of crude oil?”
The Resilience.org website is off line so you will get an error when clicking on Jeffrey’s link. It is not the fault of the link.
But the original article can be found here:
Quite Possibly the Dumbest Thing the Mustache Ever Wrote
Here’s the link to the NYT OpEd by Friedman:
http://www.nytimes.com/2014/09/07/opinion/sunday/tom-friedman-leading-from-within.html?_r=0
Waaaaaaay too many people calling for the crude export ban lift for it not to be a funded activity.
And this man is a highly respected journalist with three Pulitzer prizes to his name. Sigh!
Greenhouse gas levels rising at fastest rate since 1984
http://www.bbc.com/news/science-environment-29115845
Concentrations of carbon dioxide in the atmosphere between 2012 and 2013 grew at their fastest rate since 1984. “The Greenhouse Gas Bulletin shows that, far from falling, the concentration of carbon dioxide in the atmosphere actually increased last year at the fastest rate for nearly 30 years,” said Michel Jarraud, secretary general of the WMO.
The WMO data indicates that between 1990 and 2013 there was an 34% increase in the warming impact on the climate because carbon dioxide and other gases like methane and nitrous oxide survive for such a long time in the atmosphere.
For the first time, the bulletin includes data on the acidification of the seas caused by carbon dioxide.
Every day, according to the WMO, the oceans take up about 4kg of CO2 per person. They believe the current rate of acidification is unprecedented over the last 300 million years.
“The climate system is not linear, it is not straightforward. It is not necessarily reflected in the temperature in the atmosphere, but if you look at the temperature profile in the ocean, the heat is going in the oceans,” said Oksana Tarasova, chief of the atmospheric research division at the WMO.
Doug,
Nice to see you publish some of that GLOBAL WARMING WHACKO stuff. At some point, I will be publishing CLIMATE CHANGE articles on my site, but for now… it’s nice to come here and get some updates on the NEW NORMAL as it pertains to weather.
Doug… did you see this picture of the washed out I-15 north of Las Vegas. They are calling it a ONE in a 500/1,000 year RAIN EVENT…LOL. Again, this will be the new normal… 6 months to a year worth of rain in a day.
steve
Just heard this site on Savage. Wondering if any of you climate change fanciers can tell me why the world still has snow? In school, Mr. Al Gore scared me by telling me snow was going to be a thing of the past by now. Just like those poor polar bears up in the arctic.
NotALiberal,
That’s an easy question to answer. The reason why still have snow, because the City Unions have a large group of Snowplow drivers. If it stopped snowing, then what would these Snowplow drivers do for a living?
Ever think about that?
steve
Don’t forget about the communist snow. The Russians love fur hats.
I suppose that would be red snow?
There really is no hope… with nonsensical idiots like this about.
Wait, Savage is talking about peak oil?
Was it the queen who banned Michael Savage from entry in the UK? I forget.
Climate is very complex, but this is all anyone needs to know about the Global Warming brouhaha:
The warmists want your money. But they won’t tell you up front how much of your money they want to forcibly confiscate. They refuse to tell you exactly how much your money is going to lower global temperatures.
Warmists will give you platitudes, insults, obfuscations, straw men, red herrings, appeals to authority, bandwagon fallacies, fear mongering– but never ever a simple cost-benefit analysis in line with free market principles.
My belief is that only an under developed mind would fall for the global warming thing.
The end.
Drk Horse,
I thought acey.blue67 made the STPUIDEST comment I’d ever seen. He didn’t.
LOL… Steve
My under-developed mind likes pictures… from the handy Climate Reanalyzer
A more complete picture… Arctic Sea Ice Death Spiral
Very insightful, thanks
In the interests of science it is important to note that there has been a significant rebound in the summer ice minimum values reported in 2013 and 2014. The 2014 figure is expected to be the highest since 2009. This seems to indicate that the sea ice will melt less with a bang than with a wimper. Ie sigmoid rather than exponential decline. Probably the best analogous description is that the remnants of the ice has gone through the equivalent of a phase change, from a solid, rigid ice cube to slush, which has spread further across the arctic basin, and changed local weather conditions, delaying final melt out for a few more years.
OMG we’re all doomed! Bcuz your glorious “scientific” maps and models say so! We’re all gonna die unless we give all our money to the
commiecrats, oooops I mean democrats!The real map you should be looking at is here. Its free of the liberal bias of the mainstream media and pathetic grant hungry scientists at all our public universities. Open your eyes man, the combined ice extents of both north and south pole is far beyond the long term average.
Also behold the wonderful record of the climate warmists predictive prowess over the years, http://www.thenewamerican.com/tech/environment/item/18888-embarrassing-predictions-haunt-the-global-warming-industry. LMAO!!
Savage Nation master race represent!
The beautiful thing about Republican propaganda is that it converts complex issues into hate tirades against individuals. It replaces thought with hate, and hate feels so good. When you hate someone, you feel like a winner.
Al Gore isn’t running for president anymore. You won’t impress anyone outside your echo chamber by attacking him.
Funny how spending less money reduces the rate of global warming.
Drk Horse says: Warmists will give you platitudes, insults, obfuscations, straw men, red herrings, appeals to authority, bandwagon fallacies, fear mongering– but never ever a simple cost-benefit analysis in line with free market principles.
And just who are these “Warmist”? Well Scientific American tells us:
How to Determine the Scientific Consensus on Global Warming
Warmist are:
97% of all Scientists
89% of all Democrats
79% of all Independents
70% of all Republicans
If global warming is a conspiracy then it involves one hell of a lot of co-conspirators.
Scientific American does not tell us just who disbelieves in global warming but I would guess it is about 100% of all nitwits.
The Co2 PPM (parts per million) numbers are irrelevant because there’s a diminishing rate of return. In a 200 PPM system, the second 100 is half as effective as the first 100 and so on. This is why global warming stopped 18 years ago.
http://newsbusters.org/blogs/julia-seymour/2013/06/25/networks-fail-mention-lull-warming-all-92-climate-change-stories
“This is why global warming stopped 18 years ago.” Global warming DID NOT stop 18 years ago.
acey.blue67,
That’s the Stupidest thing I have ever heard. Well, maybe NECK & NECK with the Federal Reserves Economic Forecasting abilities.
steve
Acey blue 67 obviously never took a physics course.
Perhaps I should have included the following:
The World Meteorological Organization (WMO) is a specialized agency of the United Nations. It is the UN system’s authoritative voice on the state and behaviour of the Earth’s atmosphere, its interaction with the oceans, the climate it produces and the resulting distribution of water resources.
WMO has a membership of 191 Member States and Territories (on 1 January 2013). It originated from the International Meteorological Organization (IMO), which was founded in 1873. Established in 1950, WMO became the specialized agency of the United Nations in 1951 for meteorology (weather and climate), operational hydrology and related geophysical sciences.
Global warming is just another way for the leftists at the UN to get into MY wallet. The climate is in a continual state of change. Always has been, and always will be. Unelected bureaucrats at the UN are just out for more money and power. The other driving force in this is the fact that communists didn’t disappear, they just morphed into environmentalists in many cases and use environmentalism as a platform to attack capitalism and free enterprise. Green is the new red, and the UN is full of these ‘green’ communists. Consequently they no longer view the whole global warming thing as something scientific but rather a theology that continually needs new believers. I give you credit for being brave enough to admit to being a UN sympathizer. lol
How can I possibly argue with that kind of logic: green is red, black is white. You might paint me as a Godless heretic as well, that would be accurate. Meanwhile I’ll just continue with my delusions, trust consensus views on Global Warming and march along with my fellow communist conspirators.
Psst, Doug, let it go bro, ya ain’t gonna win this one!
http://goo.gl/LS3uEU
You’re right Fred.
Doug,
Fred’s right… Doug, you chain’t gonna win this one.
By the way, ELMER FUDD told me that we might think about passing a hat around and collecting some money to pay the Climate Scientists so they won’t have to LIE through their teeth to get funding.
steve
Man made global warming as communicated by the UN is not a lie, but is blown out of proportion exponentially by scientists that need to fear-monger in order to continually receive desirable grant money and politicians who want to tax and control the oil & gas industry above all else while giving our hard-earned tax dollars away to financially unstable green companies they’re in bed with. Very simple facts. Carbon output can correlate with temperature increase, we see that throughout history. However, it is not the only factor in climate changes. Natural ocean stagnation and geological/volcanic activity play a much larger role, as does solar activity. CO2 is a molecule beneficial to all plants, so more CO2 in the air correlates with a greater abundance of plant life on the planet. This is a very useful fact with regard to food production needed to sustain a continually increasing population. The only true damage that will be done by climate changes will be some minor small island and coastal flooding, but people have several centuries to get out of harm’s way before anything significant happens. Some alarmists talk about pre-planning like everyone needs to evacuate the island of Manhattan immediately or face being wiped out by a tsunami. That is not the case. And even if we curb our CO2 emissions to 0% for the next 1000 years, we will be facing some sort of major natural climate change event like an ice age regardless.
Nancy,
We are as good as the information that we LET IN OUT BRAIN. If you actually believe that, then my assumption is… that information is complete RUBBISH.
Doug, as you can see from the comments here…. there’s no hope for us…LOL.
All we can do now is just wait around for the Global Warming Impacts to KICK IN HIGH GEAR. When weather and climate events become too large to blame on conspiracy theories or the even more lame excuse that scientists are lyinglying through their teeth to get continued funding…. the GREAT HUMBLING will occur.
steve
Steve,
Actually it might be more productive debating: How many angels can dance on the head of a pin? There comes a time to just move on rather then getting suckered into lying scientists or conspiracy theories nonsense.
Doug
Doug,
Totally agree. Let’s move the discussion to Abiotic Oil. Do you think Abiotic Oil may help Chesapeake out from under its $30 billion of debt?
steve
Professional gardeners have known for years that global warming is real.
http://www.washingtonpost.com/wp-srv/special/local/planthardinesszones/index.html
CO2 is a molecule beneficial to all plants, so more CO2 in the air correlates with a greater abundance of plant life on the planet. This is a very useful fact with regard to food production needed to sustain a continually increasing population
Right, and H2O is a beneficial to all humans but if you get too much of it you can fucking drown!
Don’t suppose any actual peer reviewed science would make you realize what a bunch of rubbish saying that more CO2 is automatically good for agricultural production…
http://www.nature.com/nclimate/journal/v4/n6/full/nclimate2183.html
Nitrate assimilation is inhibited by elevated CO2 in field-grown wheat
Arnold J. Bloom, Martin Burger, Bruce A. Kimball & Paul J. Pinter, Jr
Total protein and nitrogen concentrations in plants generally decline under elevated CO2 atmospheres1, 2. Explanations for this decline include that plants under elevated CO2 grow larger, diluting the protein within their tissues3, 4; that carbohydrates accumulate within leaves, downregulating the amount of the most prevalent protein Rubisco2; that carbon enrichment of the rhizosphere leads to progressively greater limitations of the nitrogen available to plants4; and that elevated CO2 directly inhibits plant nitrogen metabolism, especially the assimilation of nitrate into proteins in leaves of C3 plants5. Recently, several meta-analyses have indicated that CO2 inhibition of nitrate assimilation is the explanation most consistent with observations6, 7, 8. Here, we present the first direct field test of this explanation. We analysed wheat (Triticum aestivum L.) grown under elevated and ambient CO2 concentrations in the free-air CO2 enrichment experiment at Maricopa, Arizona. In leaf tissue, the ratio of nitrate to total nitrogen concentration and the stable isotope ratios of organic nitrogen and free nitrate showed that nitrate assimilation was slower under elevated than ambient CO2. These findings imply that food quality will suffer under the CO2 levels anticipated during this century unless more sophisticated approaches to nitrogen fertilization are employed.”
Yeah, I know, as always innovation and technology will help us solve the nitrogen fertilizer issues!
Hi Fred,
Speaking as a former educator I must remind you that the vast majority of people don’t have a clue as to what is meant by ” peer review”.
Generally speaking if they do have any idea they think it means their intellectual peers have read their opinions and agree with them.
The sad fact of the matter is that you can graduate from some of the most respected universities in America with only ONE SO CALLED SURVEY course in the sciences.
Given this reality I tend to be somewhat of a snob in respect to my degree in AGRICULTURE since my course advisor enrolled me in calculus with the math and engineering majors, chemistry with the chemistry majors, and biology with the biology majors my freshman year.
It got worse after that except I was finished with math.
IT truly is a sad fact that the people of this country including the vast majority of graduates of our colleges and universities are abysmally ignorant of the natural world.
It is literally impossible to help people such as the ones here today denying climate change understand physical reality.
They lack the intellectual resources needed to do so and beyond that they have made up their minds.
Rush and Mitt have read the gospel to them and that’s all there is to it.
A human mind is somewhat like wet concrete when it is still young – plastic and shapeable. Later on it generally sets like concrete.
I have many friends and acquaintances of this stripe.
‘Nuff said.
Hey OFM.
I should have just followed my own advice that I gave Doug.
“Just let it go because we ain’t gonna win with these folks.”
Normally I would have but when someone says CO2 is food for plants and it’s good for future agriculture, my diplomacy dike shatters and the asshole that was held in check behind it, comes raging out wanting to bash some heads with a couple of two by fours, if you know what I mean.
Sigh! That is not who or how I want to be but that comment really pushes a lot of my buttons all at once.
Just have to remind myself not to feed the climate denialist trolls.
Peer review, what’s that? Dunno!
Cheers!
Fred
An abundance of co2 certainly does seem to help a few weeds grow ( The ag definition of a weed is any plant in a place you don’t want it.) faster. Now if there was a market for poison ivy………………..
Hang in there Fred.Venting a bit here and there and now and then feels great, does it not?
Every once in a while I have lost my cool with some hillbilly acquaintance who has sent a son or daughter off to university to study medicine or engineering and ask them if they would like to go to campus and ask the first hundred kids we meet if they believe in evolution..Five bucks a head even odds.They generally shut up at that point unless they get mad and change the subject.
We will have the last bitter laugh along with the Good Reverend Malthus.
But we need to keep in mind always that such people are not stupid….. they are just ignorant and uninformed.I have violated my own personal rule today in publishing the statement that they lack the intellectual resources to understand the issue… This is true but saying so absolutely guarantees that the target will only be reinforced in his determination he is right in addition to remembering me as an enemy of the political and economic sort.
It truly is astonishing just how ignorant of the real natural world people are.
I’m glad I took my science degree, before my arts degree and both before my professional degree.
Chemistry (inorganic and organic), biochem, physics, geology (great classes those, it really puts things in perspective), math, statistics, botany, genetics, microbiology. These are the foundations of my understanding of the real world. A real world that you can’t understand otherwise because you don’t know what it is. Top it off with history, literature and political science (the master field of study that rules over all else) and law, and you get my education. Hopefully, by that point, you’ve halfway understood that you really don’t know didly squat about anything, but you’re sufficiently learned to know this. Hopefully, I say, because many seem to think otherwise.
Nothing to disagree with here. The only thing I’d add is that once you understand how science works and how much really hard work usually for very little pay a scientist with a doctorate in say physics, chemistry, biology and certainly climate science had to put in. Just to be able to do the research that he or she does, you really cringe when some ignorant fool talks about conspiracies and that its all about the lucrative grants. If you want to know where the people who make the big bucks are, go to Wall Street! Because it isn’t in scientific research. Most people in the sciences do what they do for the love of knowledge. Which is why some of the most seriously depressed people on the planet are ecologists, they know the ugly truth first hand.
I think I just lost a lot of brain cells reading that comment.
I agree my comment needs some editing. Maybe it could use better grammar and punctuation as well. Though It didn’t think it would kill any brain cells…
Well.
You certainly have your talking points down pat. Nicely done!
Whoa…glad this blog was linked in today’s The Savage Nation mailing…let me just tell you nuts…,Global Warming, fails the test…not just of science…but mathematics…consider this, the earth is ~4 billion years old…the OLDEST (inferred) data that is being evaluated in support of the global warmists is roughly 400,000 years old…that means that the best that global warming scientists can claim is that their conclusions are based on observations of 0.01% of the earth’s lifetime…to put that in perspective…that would be equivalent to trying to reliably predict how much a typical 40-year-old will weight at age 50 based on observing his eating habits for 0.01% of his lifetime…or roughly 1.5
DAYS…thank GOD the hole warming bunk is getting harder and harder for the scientists to defend…
I would be disappointed if my seven year old grandson came up with such a pathetic argument, but he wouldn’t: Inane.
This doesn’t even come close to making any sense. It is amazing how many people have allowed themselves to be duped by liars like this. I strongly advise you to stop reading Savage Nation mailings.
It will improve your sanity anyway. Do you notice how they are designed to rile you up? When you are in that mental state it is much harder to think clearly. But it feels good. You feel like a winner. That’s the trick.
“… oldest data… 400,000 years old…”
Wrong.
Oxygen isotope ratios from more than 100 million years ago are routinely measured in foraminifera from deep sea sediment cores.
Other oxygen isotope measurements go back billions of years.
Fossil tree leaf stomata imprints stretch to 400 million years.
The Discovery of Global Warming
http://www.aip.org/history/climate/index.htm
There’s a “start here” button on top left of
http://www.realclimate.org
Hey nice to see a fellow Savage Nation reader here! Just remember that the climate religion transcends nation state borders. What better way for trans-national globalists to gain control of sovereign nations but to regulate their energy output because it affects climate, which has no borders and affects us all. In short, man made climate change hysteria is simply a way to destroy the concept of defined nation states and usher in the global governance of a New World Order. And the best part is that they will get us to pay for this through carbon taxes. Already some new cars print out “carbon footprints” or pounds of CO2 emmissions per year on their window stickers. You can be sure the next step for the government is to implement taxes based on this number. Government is parasitic, always out to take what belongs to you.
Savage Nation is focused on Peak Oil?
Borders : Language : Culture : Depletion
And I suppose the “globalists” also want to take away your guns, destroy the white race, ship all of your jobs to China, and make Islam the world religion?
Already some new cars print out “carbon footprints” or pounds of CO2 emmissions per year on their window stickers.
Well, it ain’t exactly rocket science, 1 gal of gasoline burned in an ICE produces roughly 20 lbs of CO2 (the miracle of chemistry). I drive a compact with an 11 gal tank so every time I fill up I know I’ve added another 220 lbs of CO2 to the atmosphere. I drive roughly 8,000 miles a year and my car gets about 35 mpg between highway and city driving. 8000/35 = 228.6 gal per year which comes to about 4,600 lbs of CO2 that I add to the atmosphere every year, just from driving alone. So even if gas goes to $10.00 a gal. my monthly gas bill will still be roughly $200.00 a month. More incentive to ride my bamboo bike, which I’ll be more than happy to do…
J. Howard Kunstler said that something to the effect that suburbia was the greatest misallocation of resources ever. Well, I think it also needs to be said that using 3,000 lb. steel boxes powered by ICEs to transport individuals all over the place, is just absolutely idiotic! Every car on the road, including mine, should have the words ‘IDIOT MOBILE’ painted in giant red letters on every visible surface just to remind people how dumb we really all are! /rant
Cheers!
I wondered how this site had suffered the equivalent of three dozen Mormon elders knocking at one’s door on the same day.
As one who has knocked on doors for political candidates, it seems to me that this was a test of ideological correctness for these visitors, a little visit into the belly of the beast, a way of showing them that even when the door slams in your face, you just dust yourself off and move on.
And hey, I’m all in favour of the moving on part…even though I do find your contributions hysterical.
And if I know the velocity and direction of a cannonball measured over .01% of its trajectory, I’ll know exactly where it is going to land 20 miles away. Physics is funny like that.
Since most oil used today comes from what I might call traditional oil reserves, I think a very critical figure to have, is an estimate for traditional oil well depletion. Can anybody point me to a reliable source estimate for that number? I had once heard at a conference that Andy Gould, Schlumberger’s chairman, once said in a conference call that their figure for traditional oil well depletion was 7%. I realize it is difficult figure to generalize on, due to the fact that all oil reserves are not equal. Jeff Brown mentions a depletion figure of 4-6% via Exxon. Jeff, do you have a source reference for that like an note in an annual report? Any other references would be most helpful.
Thanks
DMG, depletion and decline are two entirely different things. I have no clue about depletion rates, I only deal with decline rates. However the two are related because a field with a very high decline rate will also have a very high depletion rate. However it is possible, with massive infill drilling, to slow the decline rate to one or two percent and possibly even zero while massively increasing the depletion rate.
That being said, there is no set rate that fields decline after reaching peak production. Very large fields decline far faster than very small fields. Also deepwater fields decline much faster than shallow water fields or land based fields. And, contrary to what you may have heard there is no difference between the decline rate of OPEC fields and non-OPEC fields. OPEC fields have shown a much slower decline rate because they are mostly giant and super giant fields. But those same fields would have the same decline rate if they were located in non-OPE countries. And the decline rate will change depending on where it is on the decline curve. Decline will start slow, speed up in the middle of the curve and as it nears complete depletion it will start to decline slower.
Of course OPEC depletion rates seem much lower because OPEC Middle East and North Africa fields fields never deplete. Those countries never report any decline in their reserves. However the below PDF file seems to ignore what OPEC says and report their findings anyway.
OPEC fields seem to decline and deplete much slower because, as a rule, they are much larger.
A very good PDF paper on The subject:
Depletion and Decline Curve Analysis in Crude Oil Production
One thing about this paper is they explain the difference between depletion rates and decline rates.
Ron,
Excellent answer. You need to make a couple of corrections to your text in the first paragraph. These will be obvious when you do a re-read.
Doug
Yeah, thanks. I hope I have it right now.
For what it is worth I remember seeing various AVERAGE estimates of legacy oil decline rates that range from about four percent to seven percent if I remember correctly.
I would not remember them unless they were from organizations or people I consider reliable. That is a rule of thumb I have trained myself to use in storing odd info in my mental attic.
Ron is certainly right that the decline rate of any given field can vary dramatically for a lot of reasons.
Even the IEA itself said that the average decline rate was 6.2% in the 2009 WEO.
Before that they had just ASSUMED the decline rate was far lower. Like 3-4% I believe. Then they decided to do actual math in 2009 since their oil production predictions turned out to be so incredibly erronous and useless.
When that 2009 WEO came out with that data it was a watershed moment for me. After years of stagnant production, a price spike, and near global depression I was pretty confident we were all screwed the second growth picked up and we bumped into the declining production… then this shale oil boom happened, and, frankly, I couldn’t be happier.
Buys us just enough time to fully prepare ourselves. Electric vehicles are finally available, PV is far, far cheaper, and my fruit trees are almost fully grown. Just give me 2 more years Bakken! That’s all I ask.
thanks Ron, much appreciated
I hardly think it can be considered ethical to write a lease and then back out on paying for it because a nearby property turned up dry. If the ground turned out to be very productive and super profitable they would not have paid a dime extra. They anted up and took their chances as I see it, and lost. That does not mean you get back your ante money.
Lawyers may argue differently but I personally think a whole lot of people should go to jail for this sort of thing.
http://www.mlive.com/news/grand-rapids/index.ssf/2014/09/chesapeake_energy_ordered_to_t.html
I can assure you that Chesapeake would not hesitate to sue a mineral owner that tried to renege on an executed oil and gas lease, if in fact, Chesapeake really wanted said lease. Most of the time a Lessee (Chesapeake) will not execute a lease. As a general rule, usually only the Lessor( mineral owner) executes the lease.
If the Chesapeake Landmen are members of the American Association of Professional Landman, (Landman.org) or a local professional organization then they are obligated to follow a code of conduct and ethics. But it’s kind of like Congress swearing to defend the Constitution from all enemies, foreign and domestic.
There are also many good reasons why a company will use a land brokerage business ranging from confidentiality reasons to insulation from charges of ethical misconduct or fraud.
Gosh, …….don’t you just hate those e-mails that can never be permanently destroyed. It was so much easier in the olden days when we relied on telephone calls to communicate.
Being only an ignorant farmer I have a bit of trouble understanding the meaning of the sentence ”As a general rule, usually only the Lessor( mineral owner) executes the lease.”
Why would a landowner enter into lease at all unless he gets paid?
This wore ”executes” is not in my vocabulary in this sense.
As a general rule in other industries a lease goes into effect when it is drawn up and signed by the involved parties.Neither party has the option of withdrawing without penalty..
Ebola outbreak: Italy fears first suspected Ebola case, woman hospitalised
http://www.abc.net.au/news/2014-09-09/first-suspected-ebola-case-in-italy/5732130
Ancona is not too far from Rome, want to bet she flew into Rome international airport to get home…
Hopefully she wasn’t too contagious yet when she landed there.
It makes one wonder about just how widespread Ebola already is in Nigeria.
BBC WORLD NEWS (Today)
Liberia is facing a “serious threat” to its national existence as the deadly Ebola virus “spreads like wildfire” there, its defence minister says.
Ed Auden posted this link yesterday but since a new post was posted shortly thereafter I thought someone might have missed it.
Drillers Piling Up More Debt Than Oil Hunting Fortunes in Shale
These companies are plugging cash shortfalls with junk-rated debt. They owed $190.2 billion at the end of June, up from $140.2 billion at the end of 2011. (Six of the 60 companies that didn’t have records available for the full period weren’t included.)
Standard & Poor’s rates the debt of 41 of the companies, including Halcon’s, below investment grade, meaning some pension funds and insurance companies aren’t allowed to invest in them. S&P grades Halcon’s bonds CCC+, which the rating company describes as vulnerable to nonpayment.
These guys are paying junk interest rate on their borrowed money.
The key question remains how long American oil companies can lose money before they stop drilling and fracking. I’m surprised that WTI has consistently been trading at a lower price than Brent, considering US light tight oil is some of the most expensive to extract. Is it because American consumers are unwilling/unable to pay enough to make the oil companies profitable? Or is it because consumers don’t have to pay more as long as Wall Street is willing to absorb the losses?
It’s difficult to see how this Mexican Standoff can continue indefinitely. Can you just continue issuing debt forever without consequence?
“Can you just continue issuing debt forever without consequence?”
Yes.
It can be expunged by decree. The damaged counterparty can be made whole by the Fed.
Any weakening of the dollar by such Fed action can be countered by cooperative central banks of other countries who would buy the dollar and strengthen it, lest the whole global system collapse.
Money ceased to mean anything concrete in 2008/9.
Central banks can create money more or less at will just as kings used to create money by minting coins. When they debased the coinage the value of it fell meaning prices went up.
ALL it takes is some keystrokes or a few hours work manipulating purchases of paper or electronic assets. This is the modern form eequivalent of printing cash.
Money can be printed but real assets and saving cannot be conjured up with keystrokes or printing presses.
If debts are canceled by decree – which could happen at least to some extent- the people who have real assets will notice and refuse to sell such assets for the newly circulating money until the price goes high enough to cover the perceived risk.
In the end there just doesn’t seem to be any way of printing money above and beyond the amount necessary to keep a growing economy on an even keel without bringing on inflation.
Whatever is bought by the folks lucky enough to come into possession of the new ” extra ” money is than much less that can be bought by folks in possession of the old previously existing money.When the holders of old money go to buy something they have to pay more to get it since printing only increases the supply of money; printing does not increase the supply of goods and services.
Any body having a difficulty understanding this should envision a small isolated self contained community with a stable constant state economy and prices .
If one community member discovers the art of counterfeiting coins, and gets away with doing so, he can buy more than his fair share by bidding up the price a bit if necessary. Somebody goes short by whatever the counterfeiter bought extra. Pretty soon in a small place every body would have more coins but there would be no more goods and services. MORE coins would buy the SAME aggregate of goods and services.
INFLATION.
Now of course an inflationary effect can be hidden in the noise of possible deflationary effects such as increasing productivity.
When Lehman Brothers went bust they had about $12 bn in assets and over $600 bn in short term (mostly 30 day) debt. That’s three times as much as all these drillers put together. You can’t go on borrowing forever, but you can for a good long while.
According to Leigh Price’s findings, the presence of hydrogen in organic material will end up as oil under proper conditions, i.e. temperature and pressure, and the presence of oxygen yields coal, if his postulate is correct. If I read his paper correctly and am not mistaken, if I am, correct me if I’m wrong.
The interest expense is worse than what the US Treasury pays to Wall Street to borrow the US gov’s money. Holy Ripoff, Batman. It’s a money game, not accounting and Wall Street is first in line to make sure who gets paid first.
Nothing like jonesin’ for more money being funneled directly to Wall Street. Wall Street wins, everyone else loses. I do NOT digress.
A cumulative decline rate of 7.26 percent would translate to 928,000 barrels per day after the one million per day in the prior month’s production. Doesn’t really seem to happen quite so fast when new wells are pumping new oil and adding to the total to maintain a level of one million barrels per day. Decline rates are tricky, depletion is what needs the most attention.
The pace remains at one million barrels per day, regardless of the percentage of decline that is purported and not really there at all, in reality. Decline rates happen, but not at such a pace.
Depletion is an entirely different story and if the amount of oil shipped is one million barrels per day and the original oil in place plus new oil being formed totals between 400 billion to 900 billion barrels, then depletion is really meaningless until after some two to three hundred years. Depletion has brought us all to where we are now. That would be between a rock and hard place, me thinks.
If it takes three years, more or less, to produce one billion barrels from the Bakken, then 900 billion barrels will last at least 2700 years providing every last drop of Bakken oil is pumped out of the ground. Unless, of course, the rate of extraction is increased to two million barrels per day, then it will last for only 1350 years. I know, I know, it is pure fantasy, but one can dream. It’s a laugh-er.
You have to accentuate the positive and attenuate the negative.
It’s better to light a candle than to curse the darkness. Think of the Moon as a candle and the Super Moon has more candle power, dagnabit. I digress.
When you are pumping 4000 ppm of CO2 into the hundreds of hectares of greenhouses in Spain to provide the essentials to produce vegetables and what not to the population of Europe and working with temperatures at 40 C, you are producing more produce so everyone can eat. Another Catch 22, if you don’t goose the greenhouses with heat and CO2 generators, you won’t have yields that are necessary to supply the market; groceries are an important part of survival. I can guarantee you that when there is little heat and not much sunshine, plants have a difficult time growing to full maturity, Antarctica comes to mind. Thirty below zero has a devastating effect on some plants.
You need the phenotype to grow to full maturity just to make sure the genotype survives.
Did not the Carboniferous Period end up with lots of vegetation and laid the foundation for the coal deposits that circle the earth? Did it not also have CO2 levels that were some ten times those that exist today? The earth is going to survive, regardless of what one species can do to it.
Peak Food is also here and now, and I’m getting hungry. Enough to drive one to drink; it’s beer time.
“A cumulative decline rate of 7.26 percent would translate to 928,000 barrels per day after the one million per day in the prior month’s production. Doesn’t really seem to happen quite so fast when new wells are pumping new oil and adding to the total to maintain a level of one million barrels per day. Decline rates are tricky, depletion is what needs the most attention.”
You may not understand what decline rate is. Think in terms of a single well. First. What happens to it. They presume all wells act like that.
Decline rates in proper definition have no inclusion of new drilling in their calculation. New drilling (if it’s outside frack distance) has no impact on the decline from an already producing well.
Coal forms from buried swamp vegetation, oil from plankton (marine or freshwater.)
Someone was wondering the other day where all the drilling was happening… from the drilling info blog.
Beyond the Rig Count: Visualizing Patterns of Rig Activity
Posted on August 19, 2014 · Posted in DI Analytics
Permian seems to be a hot spot!
What the HELL is going on in Kansas? They are 100% off the radar screen.
Mississippian Lime. Kansas has had about 30 active rigs at any given moment for about the past four years. The wells aren’t so good (Kansas oil production is up only about 15 Mbpd over those last four years), but they’re cheap, and the money to drill them keeps on flowing.
http://theenergyharbinger.com/2012/09/13/comparing-the-bakken-and-the-mississippian-lime/
good data
US Boosts 2015 Oil Forecast As Shale Powers Push To 10 MMbpd
[Excerpt from article]
The U.S. government on Tuesday jacked up its forecast for oil production next year by 250,000 barrels per day (bpd) as the boom in shale oil drilling continues to confound expectations of slower growth.
The U.S. Energy Information Administration now expects domestic output to rise to 9.53 million bpd, growing by around 1 million bpd for a third consecutive year, according to its latest monthly short-term energy outlook. A month ago the EIA had predicted output growth would slow in 2015 to 800,000 bpd.
The U.S. shale boom has allowed producers to unlock thousands of barrels of reserves, putting the United States on course to become the largest producer of oil globally, which would dramatically reduce its dependence on imports.
“Rising monthly crude oil production, which will approach 10 million barrels a day in late 2015, will help cut U.S. fuel imports next year to just 21 percent of domestic demand, the lowest level since 1968,” EIA Administrator Adam Sieminski said.
The EIA also raised forecasts for 2014 U.S. output to 8.53 million bpd from the previous estimate of 8.46 million bpd. It said U.S. growth would account for 91 percent of the 1.3 million bpd rise in global oil output next year.
U.S. crude oil production has reversed years of decline thanks to the development of shale resources, which have boosted output by more than 70 percent in six years. Production averaged 8.6 million bpd in August, the highest level since July 1986, EIA data showed.
[End of excerpt]
BTW something I’ve been meaning to do.
Frack distance . . . let’s pick 1000 feet and omnidirectional. So that’s radius, not diameter. And a cylinder of that radius 1 mile long. What’s the volume.
A lot. 1.56 X 10^10 cubic feet = 1.092 X 10^11 gallons = 2.6 billion barrels of volume in that cylinder (that’s 1 well).
Middle Bakken porosity = 5%. This means 5% of the rock is holes in which oil could exist. So . . .
2.6 billion barrels of volume X 0.05 = 130 million barrels per well absolute physical maximum.
Now, there is this . . . the middle bakken layer is quoted all over the place as 35 feet thick. With frack distances of 1000 feet, clearly multiple layers are being accessed. Or if not and only one layer is somehow constrained (purely horizontal fracking with no vertical extensions along the cylinder) . . . we no longer have a cylinder.
It becomes a rectangle.
The volume would be 35 feet vertical and 1000 feet horizontal on both sides of the well. So 1 mile long and 35,000 square feet is 185 million cubic feet of rock. That’s 1.3 billion gallons or 30.8 million barrels of volume in that well. 5% porosity and . . . 1.54 million barrels absolute physical maximum production per well.
So . . . say, a presumption of 500K barrels per well over the entire lifetime of wells looks like a full 1/3 of what is outright physically possible to exist.
In this context, what can down spacing possibly mean?
Oh I buried the lead a bit. All those calculations above . . . porosity has a specific definition. It is not what % of rock volume is holes with oil in it. It is what % of rock volume has holes in it in which something might reside, not just oil.
aka salt water from the Western Interior Seaway. That 1.54 million barrels . . . gets real shaky as an absolute maximum when there are water cut numbers north of 9:1.
According to this link, a 600 foot half width seems more likely than 1000 ft.
https://www.transformsw.com/wp-content/uploads/2013/09/An-Analytic-Approach-to-Optimizing-Well-Spacing-and-Completions-in-the-Bakken-Three-Forks-Plays-MRoth-AAPG-ICE-FINAL.pdf
Slide 42&43!
It’s loading slow but looks pretty cool so far.
The 1000 ft number came from a CLR or EOG presentation with proposals to go to 600 ft spacing. I think it was 1200 but I reduced to 1000 for easier numbers.
And did it wrong for one part btw, 1000 ft should be 2000 ft for both sides.
The overall impediment to the oil content presumption out of pure physical measurement is that water content. All the pores don’t hold oil.
This is a great find, guy. Your conclusion is wrong (see quote below (slide 46), but the sheer quality of the presentation is great.
“Multi-variate analytics can normalize the impact of variable
completions and geology to isolate well spacing relationships
•
Based on regional analysis of Middle Bakken wells, decreasing
spacing from 1,200ft to 800ft appears to reduce well performance by 15 to 25%
•
Outside of 1,200ft spacing, Middle Bakken wells do not display negative
effects on production
•
Effect of decreasing well spacing is less for more modern completions
(more stages and proppant) than for older completions
“
And btw all, slides early 20s examines bakken/three forks interaction, which I think means fracks are 3D.
>Your conclusion is wrong
?? 600 ft half width is correct. 1200 spacing would be needed because both side-by-side wells have 1200 ft width, or 600 ft half width.Look at slide 42.
Yes, that’s on slide 42, but slide 46 says going from 1200 ft down to 800 ft cost 15-25% of production.
Ooh, wait, maybe we’re not in disagreement. 600 either side vs 1200 ft either side, maybe slide 46 isn’t clear on that.
Frankly, the more compelling question is the spacing vertically.
The bottom line here is how much volume is drained by a well.
1000 feet 3D (radius of cylinder) times 1 mile times the porosity (from my very first paragraph) is 2.6 billion barrels of volume.
5% of that (porosity) is 130 million barrels of volume.
90% water cut filling pores takes us to 13 million barrels (per well).
But of course the interface between vertical layers . . . is called an interface because presumably it has 0 oil content, so we don’t get a full 1000 foot radius cylinder.
According to slide 11 Bakken and Three Forks together are 308′ thick.
So 1000 foot vertical fracks drain nothingness beyond 308 feet?
And there remains the interface between these layers. We need to know if that’s some different kind of rock with porosity 0 and how thick is THAT layer.
Oh, also, there is a slide saying the long wells don’t improve performance. 1 mile may be too long.
The slides claim there is communication between Bakken and Three Forks, so I guess the barriers are permeable after fracking. Assuming 2/3 is oil bearing you get a thickness of 200. That makes 240,000. Multiply that by a half mile and you get 120,000 x 5280 = 633,600,000 I guess, say 6×10^8. Taking your 5% and factoring in the water cut you get about 3% 0r 1.8×10^7. Divide by four and a bit cubic feet to the barrel and I get 4×10^6, four million barrels, maybe 5.
Now what about recoverability? They say 2% is recoverable, if we factor that in we get 80,000 barrels a well. Not sure that that factor really applies at the well level however, I somehow doubt it.
The estimate seems low. If the well starts at 500 barrels day (EIA says 530) it would only run 160 days, or 320 with straight line depletion. Eyeballing the charts in the link, my guess is that I am off by a factor of three. At $100 /barrel that means the gross revenues are $25m a well.
Good number crunching. I followed and nodded to everything but recovery factor, and I’m also not sure how 5% porosity became 3% after a 90% water cut. The theory would be 5% porosity and 90% of those pores hold salt water, not oil. So 3% I don’t understand.
No interest in the economics. The exercise is just to compute the volume and then with hard data (porosity, water cut) have a feel for absolute maximum oil can be in the defined volume.
The frack should probably not be a perfect circle around the pipe. Deeper rock is under more pressure and the pipes have holes along their length to let the fracking pressure out, but they are not everywhere. Most of the pipe is pipe, not drilled holes.
Redoing your numbers, leaving out any doubtful parts — 2/3 of the thickness to 200 feet. (Not oil bearing, pore bearing). You are using a rectangle, not a cylinder so 240,000 cubic feet for 1 foot long well, but the well is 1/2 mile long so 5280/2 X 240K = 6.3 X 10^8 cubic feet total.
Porosity is published at 5% so that volume maximally could hold 31.5 X 10^6 million cubic feet of non rock pores.
Conversion to gallons is X 7.5 or 236 million gallons and /42 is 5.6 million barrels of pores. We reach similar numbers.
The water cut of 90%+ though says most pores are filled with water. so 560K barrels of pores could have oil it them. And if you want 560K barrels out, you have to drain every pore.
The only doubtful parameter in our calculation is the radius of cylinder / size of rectangle. Frankly, I think we were generous.
I hope Enno and Wes are following this boring sequence of computations because they should have a good estimate if wells after 2012 have a shot at 560K total.
I got the 3% by eyeballing the link. The water cut is between 0.2 and 0.65, I think. where are you getting 90%?
I went with the rectangle because the cross section is so flat. If the fractures make a circle, and the circle limits the long side, but the productive area is limited by the short side vertically, then the fractures will overshoot the short side and leave an almost full rectangle.
I agree that 2/3 is probably too generous.
A table appeared here days or weeks ago and most of the wells in the table were reporting north of 90% water. 90% water cut is not a bad number at all for oil wells. Very common to get 95+%.
Understood on the constrained circular cylinder.
Watcher,
I don’t think you should dismiss water handling costs which can be as high as 50 cents per barrel of water, at least in conventional wells. As I recall, a well producing oil with an 80% water cut, the cost of handling water can be as high as $4 per barrel of oil produced. I know for certain that in parts of the North Sea, water production is increasing as fast as reservoir oil rates are declining and its not a pretty picture.
Lots of impediments.
The overall exercise was just to characterize the 1 mile long cylinder or 1 mile long rectangular box and compute the volume within.
Only after we have that number (an absolute maximum possible output per well) do we start to carve down into it with porosity and water cut.
I think we reach a final conclusion of somewhere between 4 and 6 million barrels of pores in the volume. The remaining reduction is water cut and pores not touched by fractures.
One look at the retreat of glaciers in Glacier National Park will tell you that there is such a thing as global warming, temperatures increases at higher elevations, anywho. It waxes and wanes. A trip to the Byron Glacier will or should a make a believer out of anybody that when the temperature increases, glaciers melt more and lose more ice. Matanuska Glacier will tell the same story. Global warming might just be local, but it works on a global scale. When Eric the Red lived in Greenland, it was said the weather was better than in Norway. That was ca. tenth century, the good weather lasted for about 400 years, then Greenland became less inhabitable. Global cooling occurred and nobody was at fault. Can’t blame humans for every little thing that goes wrong on earth, give them a break, humans are lost souls these days. If anything is heating up, it’s war. What a waste.
“The glacier of Chamonix, France, advanced, because of the Little Ice Age (1550-1850), causing massive floods, destroying 3 villages and severely damaged a fourth. One of these villages had stood since 1200.”
http://www.telusplanet.net/dgarneau/euro66.htm
What anthropogenic activity caused that glacier to advance?
98 percent of Mongolia’s electricity is generated from coal-fired power plants and I doubt very much that those power plants will be shutdown.
1500 plus nuclear detonations the day after Trinity and the earth did not fall apart at the seams.
Humans are consumed by one corporation, Engulf and Devour, Inc.