The EIA has apparently stopped publishing its International Energy Statistics. Instead they are now publishing an abbreviated version on their Total Energy web page titled: Tabel 11.1b World Crude Oil Production. Here they publish crude + condensate production numbers for Persian Gulf Nations, Selected Non-OPEC Countries, Total Non-OPEC and World. The “Selected Non-OPEC Producers are Canada, China, Egypt, Mexico, Norway, Russia, United Kingdom and the United States. They have just released their latest data through February 2016.
All the data below is in thousand barrels per day and through February 2016 unless otherwise noted.
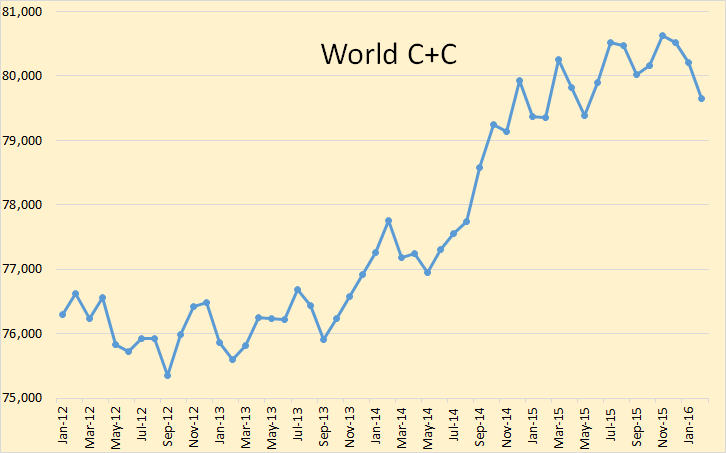
They have world C+C peaking, so far, in November 2015 at 80,630,000 bpd. February production was 79,653,000 bpd, or 977,000 bpd below the peak. World C+C production, they say, averaged 80,035,000 in 2015. Average for the first two months of 2016 was 79,933.000 or 102,000 bpd below the average for 2015.
So with world production continuing to decline, there is little doubt that 2016 production will be well below 2015 production.
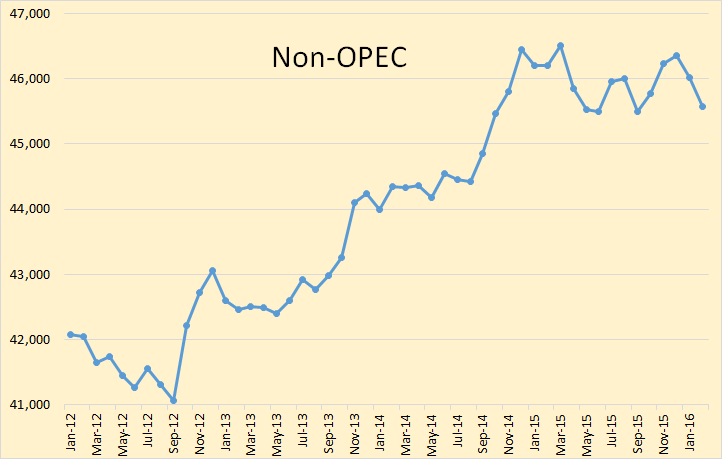
They have Non-OPEC peaking in March 2015 at 46,504,000 bpd and down by 925,000 bpd in February to 45,579,000 bpd.
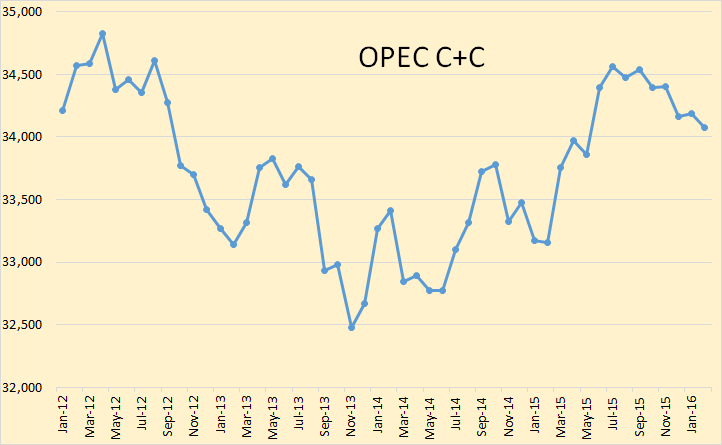
They also publish OPEC members data, Table 11.1a. OPEC C+C failed to breach its 2012 peak but did reach 34,562,000 bpd in July 2015 but by February 2016 it was down 488,000 bpd to 34,074,000 bpd.
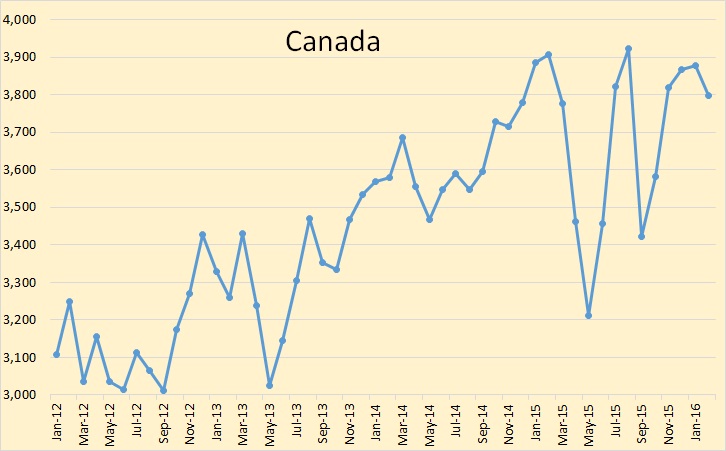
This is the EIA’s version of Canadian production. It looks exactly like Canada’s National Energy Board data except the EIA’s data is about 150,000 bpd less than Canada’s NEB shows. Obviously Canada is counting something that the EIA is not. Look for Canada’s production to decline substantially in 2016. And those May wildfires will not help at all.
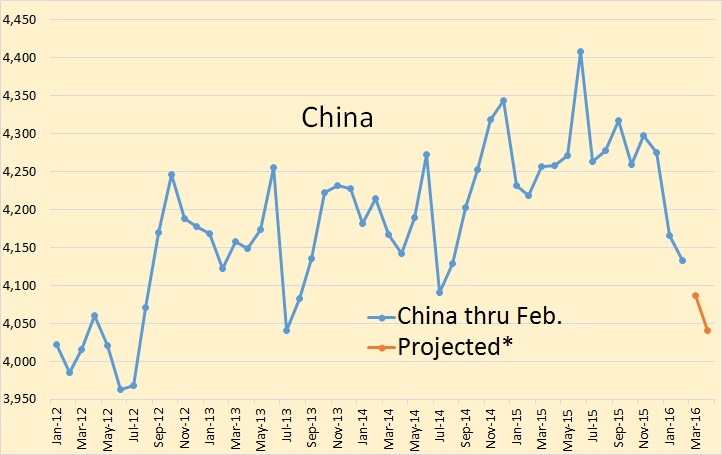
China has peaked. The only question left to be answered is how fast will she decline? There are several articles on the web about China’s decline, but they all say about the same thing.
*China April crude oil output lowest since July 2013
Data from the National Bureau of Statistics released on Saturday showed China produced 16.59 million tonnes of crude oil last month, or about 4.04 million barrels per day (bpd), the lowest rate since July 2013 on a daily basis.
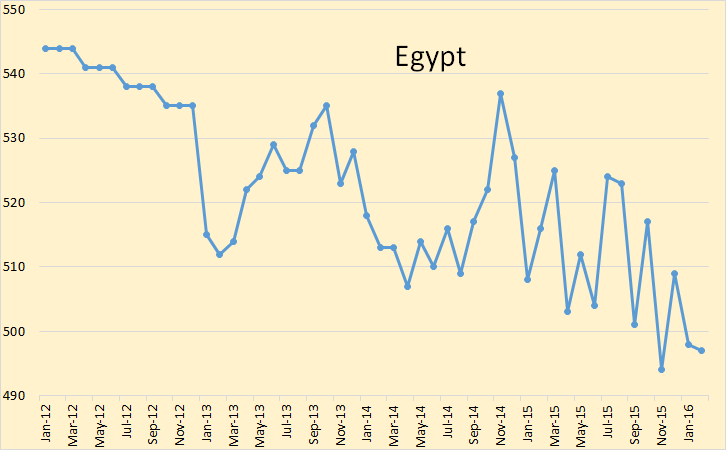
Egypt is in a slow decline. But we have been knowing that for years.
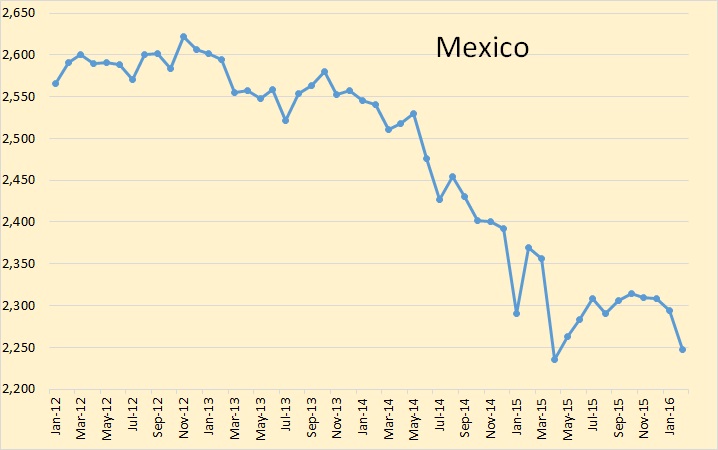
Mexico managed to stem their decline for a few months but their production has begun to decline again.
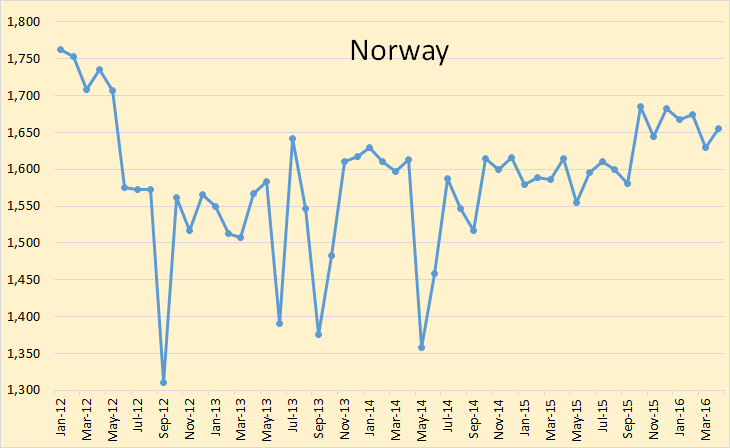
Norway, which produced around 3 million barrels per day from 1996 to 2004, has now dropped to almost half that amount. But they have managed halt the decline in 2012 and have since even increased their production slightly. It is likely they will continue to hold this production for at least another year. They are managing to buck the trend.
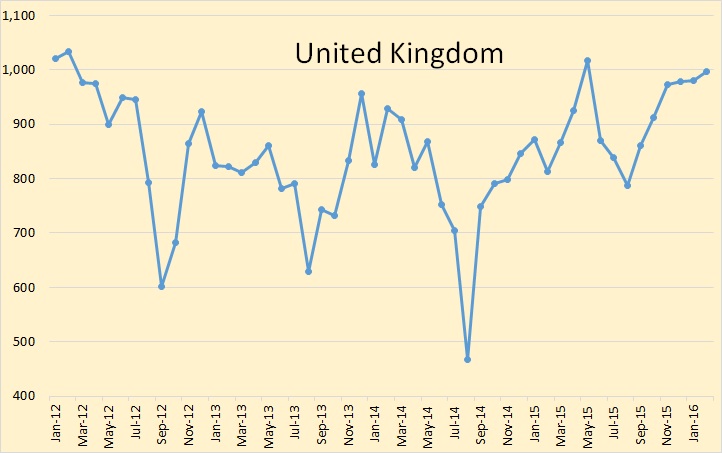
The UK peaked at just under 3 million barrels per day in 1998 and for the last three years or so has averaged about one third that amount. But the UK has also managed to stem their decline. For how long, I have no idea.
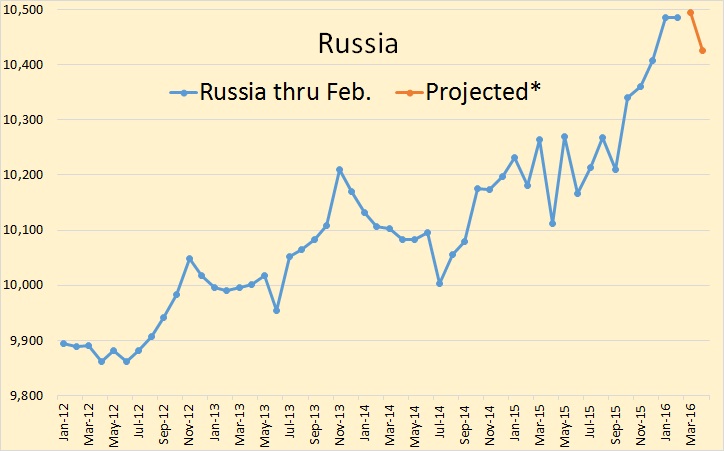
Russia has been a real shocker. No one, inside or outside Russia, expected them to increase production by over 200,000 bpd over the last few months. *Production declined by .7 percent in April according to the Russian Energy Ministry: *Russian daily oil production down in April. My above projection was made using average change in production of the Energy Ministry’s data.
Everyone has a different opinion on what to expect from Russia next year. Everyone now expects their production to increase slightly this year. I say now because everyone had a different opinion a few months ago. But…
Will Russia’s crude output levels surprise again?
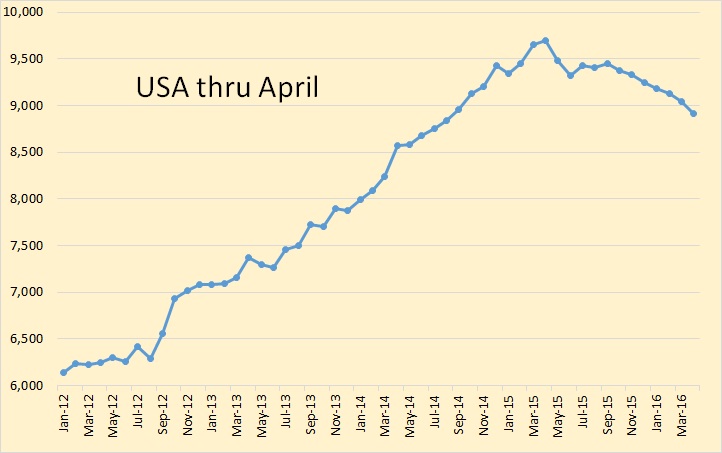
The USA is, of course a big part of what is happening to world oil production, and will continue to play a big part. I think US production will continue to decline for another year or so. After that? I think production will flatten out then increase slightly. But the boom times very expensive shale oil brought are over.

Iran is the main reason the the price induced decline has not become obvious.
In conclusion: In spite of the recent increase in Russian production as well as the slight increase from the North Sea, in spite of the dramatic production increase from Iran due to the lifting of sanctions, world crude oil production is in decline. And while it is true that most of this decline is due to the price crash it remains to be seen just how much production will recover when the price returns to… to… wherever it returns to before it stops.
But… the decline has only just begun. The price collapse caused the plateau in world oil production that begun about March 2015. However the decline did not actually begin until January 2016. The dramatic rise in production from Iran has kept the decline from becoming obvious to everyone. However when the May production numbers come in, I think it will then become obvious to everyone.
IEA has world demand at 95 and climbing this year. EIA has world production at 80, however, we have a world oil glut. Guess EIA is not counting oil production from Uranus. Can’t get this durn calculator to work right.
95 mb/d is total liquids consumption, including crude, condensate, NGLs, biofuels, synthetic fuel from coal and natural gas, refinery processing gains, etc.
80 mb/d is crude+condensate only.
Thanks
Ron: I see world production declining for more than just a year or two. All the major oil cos. have reduced capital spending on exploration and production by large percentages, with many decreasing by more than 50%. The small producers here in the US have also scaled back, some permanently as they went bankrupt. Even those that are still staying afloat cannot get financing for projects that are viable because of so much bad paper held by major banks that financed the boom of the last seven years and some of the borrowers have gone under and leases are worth far less at resale.
I know first hand these obstacle to getting our oil producers back to drilling because I lost big time. My one remaining investment, though very promising based on other wells in the field, may never be drilled because of unwillingness of banks to lend. The prospect had 60% of capital raised and still can’t get a loan for the balance. This is being repeated hundreds of times over.
Then look at offshore, where no drilling is likely to occur north of Alaska as the majors have spent billions and then gave up (Shell even drilled some test wells that found some oil), largely because they could not produce at a profit even ten years out. Gulf of Mexico is nearly the same story, as majors are backing away from PEMEX deals they signed onto just two or three years ago.
All this spells a downturn for the US/North America production from here on out. And the world will follow as Saudi Arabia is keeping production elevated mainly by its many recent projects involving EOR and no new fields coming on stream. Although EOR (enhanced oil recovery) boosts production from a benchmark level, decline comes even quicker for nearly every method.
Sure, the world has a lot of oil remaining, but those that can drill (or mine as in Canada) are finding that much is not now nor ever will be profitable. Thus we have past peak oil, IMO.
I can confirm the story about the unavailability of lending to the oil and gas sector here in Alberta. A close relative used to lend to the sector at one of our major banks. When things fell apart, he was lucky to be moved to the team that…evaluates the status of existing loans. For the last year-and-a-half, he has summed up the lending situation as follows: “Our bank no longer lends to the oil-and-gas sector. Talk to a venture capitalist.”
It is a weird situation to start to see the peak as being in the past. Partly, I feel some vindication, but it is dwarfed by a sense of foreboding.
Hi Mbnewtrain,
Oil prices will rise and profits will improve. You may be correct that the 2015 peak will not be surpassed, but I think we might see a slight increase in output to 81 or 82 Mb/d in 2018 to 2020 or a plateau at around 79-80 Mb/d until 2022 at minimum. The more we produce over the near to medium term, the steeper the decline on the other side once decline begins. High oil prices may lead to the expansion of EVs, plug-in hybrids, and hybrids along with more light rail and better urban and suburban design. So the end result may be a decline in demand matching the decline in supply with occasional shortages and price spikes.
No doubt oil price volatility will be an issue unless an oil cartel tries to control the volatility.
“All the major oil cos. have reduced capital spending on exploration and production by large percentages, with many decreasing by more than 50%. ”
Sportsfans should recall this happened Jan/Feb 2014 timeframe.
Before the price started down.
Possibly we may be heading towards some kind of price correction. 🙂
Why do you assume Iran raised their oil production post sanctions? How do you know they are not just shipping from storage, especially condensate few want?
Russia has shocked many Peak Oilers as well as her NATO-GCC enemies. The same applies to Iraq and Iran. Anyone who has glanced at my posts on this blog would know that one of the two main reasons for the current geopolitical conflict are the vast reserves of the three aforementioned countries. NATO-GCC has not gone crazy all of a sudden, they are just trying their best to prevent a different power block from challenging them. Russia, Iran and Iraq will be able to exert significant leverage in world affairs, unless NATO-GCC manage to either break them to pieces or at least circumvent them through new pipeline routes, or both.
What we read in the mainstream media about these countries is a combination of deliberate misinformation and wishful thinking. I have been reading mainstream sources claim that Russian oil production is about to enter terminal decline for well over a decade now. The sanctions on the financing of Russia’s oil firms, the banning of Western firms from investing there as well as the embargo on the sale of oil equipment to Russia were all designed to suppress Russia’s oil production. Until now at least, they have utterly failed.
Remember also all those articles from so called experts that claimed that Iran would require years, along with tens of billions in investment and Western technology in order to reach its pre-sanctions volume of oil production.
All of that was utter nonsense.
When it comes to energy issues, I think that we can safely say that the media and so called experts are either completely clueless or on a clear mission to mislead the public.
Regarding Iran, I read several posts on energy boards theorizing that their production never dropped, and they were smuggling the sanctioned oil through Azerbaijan (if I remember correctly). It could explain how they were able to “ramp up” so quickly.
“Regarding Iran, I read several posts on energy boards theorizing that their production never dropped, and they were smuggling the sanctioned oil through Azerbaijan”
Unlikely, as:
1) Azerbaijan does not have direct access to global markets. Its oil is supplied by pipelines via Russia (CPC to Novorossiisk) and Turkey (Baku-Ceyhan).
2) The volumes of Azeri oil production are well known (given the participation of BP and other oil majors) and it would be difficult to explain significant additional export volumes.
Maybe they had 20-30 mmbo in storage? Or maybe they had wells shut in for a while and they are getting a bit of flush production. Or both. It’s going to be interesting to see if they can reach 3.6 to 3.8 Mmbopd crude oil within the next 24 months.
They had some 35-45 mmbo in storage, more than half of it condensate.
They have sold most of crude from storage, but most of condensate remains there.
Oil production has already reached 3.6 mb/d.
the charts below are from the IEA OMR May 2016:
Yes Alex, but that supply can be in part from storage and flush wells. I’ve been in situations where we had to shut in groups of fields and wells for a long period of time, and we stored oil in every nook we could find. We also used that period to do maintenance, and kept on injecting water while monitoring pressure in the shut in wells. This gave us a pretty nice surge when we got the go ahead to open up.
What I also found was that wells producing very thick heterogeneous pay (say over 50 meters thick) could self inject and would produce 100 % water for a few weeks, until they cleaned up and went back to a more normal performance. I assume the Iranians could avoid this problem by producing high water cut wells with a low drawdown.
Time will tell if they can stabilize in the range 3.6 to 3.8 mmbopd, or we are seeing a mix of storage, flush production, and a few new wells?
Fernando,
In this context, supply means production, loadings mean exports.
So what do think is coming down the line from this part of the world (Rus-Iraq-Iran)?
As a unified bloc they would be dominant, but I doubt that will come about. Unless perhaps they get China to buy into a longterm arrangement of shorts.
Worries about this whole area is why Europe is making peace with the authoritarian government of Turkey. Europe and far eastern Asia are massively dependent on the imported energy from these three (and the other gulf states).
Energy Imports (as a % of total energy consumption-2013)-
S. Korea 83%, Singapore 98%, Japan 94%, Belgium 74%, Germany 62%, Spain 70%
(US 14%, China 14%)
Utter Nonsense or not…
The fossils are worthless because of cheap solar cells and batteries…true or false
Egypt got a loan from Russia for a nuclear reactor because they want to glow…true or false
China has a CDO clone (Wealth Management Products) ponzi scam going on…true or false
The whole world is down the crapper because EROI does matter at some point…true or false
Russia’s nuclear industry is thriving because natural gas is not abundant and cheap…true or false
America is a vassal of Israel…true or false
Thorium molten salt reactors are a money sink hole…true or false
Neoliberalism Globalisation is the biggest ponzi system in mankind history…true or false
“Cheap solar panels and batteries”
Hahaha hahaha…
If any of that “green energy” mumbo jumbo was remotely true, then nobody, absolutely nobody, would care about the Middle East or Russia…
Luís de Sousa has a good post about Peak Oil being reached in 2015 here – http://attheedgeoftime.blogspot.com/2016/05/this-is-peak-oil.html
“…. a long term decline is settling in. Understanding the present petroleum market as a feature of the supply destruction – demand destruction cycle makes this case clear. ”
“The present supply destruction cycle dates back to the beginning of 2014…” and “… this supply destruction cycle is coming to an end sooner rather than later.”
“The coming demand destruction cycle is therefore likely to be a long one too. And at some point it can invert the extraction trend upwards. In such a scenario, can extraction return to the 80 Mb/d rate of 2015? That is the big question, which I will abstain from answering definitively. Looking at it from the other side of the equation, for such a scenario to ever materialise, demand must withstand again a good number of years at high prices without undershooting.”
Sorry if this is a repost but I didn’t see it mentioned here earlier.
“The EIA has apparently stopped publishing its International Energy Statistics. ”
Weird. Ominous? What are they hiding? What was in the old stats which isn’t in the new abbreviated report?
The EIA international energy statistics were detailed, but of low quality.
I always preferred using alternative sources, if available.
Hi AlexS,
What source do you recommend for World C+C? OPEC and IEA report total liquids,so it is hard to determine C+C. JODI data is woefully incomplete for an estimate of World output, though it is more timely than EIA data, I like the idea of using EIA data for most of the World but substituting better data sets, where they exist (Russian Energy Ministry of Canada’s NEB, and Dean’s estimate for Texas.)
Dennis,
For OPEC countries you can use:
1) data from secondary sources published in OPEC MOMR;
2) data from the IEA OMR
Both include crude only and exclude condensate and NGLs
For Brazil, the key source is ANP.
Very good and detailed annual and monthly data can be found here:
http://www.anp.gov.br/?pg=73222&m=&t1=&t2=&t3=&t4=&ar=&ps=&1435195042069
http://www.anp.gov.br/?pg=76362&m=&t1=&t2=&t3=&t4=&ar=&ps=&1436539557465
For Mexico: http://www.pemex.com/ri/Publicaciones/Paginas/IndicadoresPetroleros.aspx
There are official sources for China
Hi Alex,
Are the EIA estimates for those sources much different from the sources you cite? For the NEB and Russia they are, but I would think the EIA uses those same secondary sources for OPEC estimates, they might also get the data from Mexico and Brazil from those sources.
We could try to reproduce what the EIA already does, by pulling together estimates from many different nations, but if it seems they are already doing that, there would not be much point, too much work and a waste of time.
Hi AlexS,
Trying to get a consistent estimate is very difficult, how much condensate does OPEC produce, how much “non-conventional” oil, how much NGL?
Using OPEC estimates for quarter 3, they match with the EIA C+C+NGL estimate within 0.7% (about a 264 kb/d difference). The IEA estimate for OPEC is higher, but is it more accurate? Hard to know, the only place we have an NGPL estimate is from the EIA (only through Oct 2015). The international data is just not very good, either we use C+C+NGL (from BP) all liquids (OPEC or IEA) or we have to rely on EIA estimates (which for OPEC are pretty close to OPEC estimates with secondary sources) for C+C. The data for Mexico is very close to the EIA data (30 kb/d too high for EIA relative to Mexican data, about 1.6%) and insignificant at the World level.
Dennis,
Brazil’s ANP C+C data is the same as until recently was released by the EIA.
I don’t understand why the EIA is using data from national sources for some countries and own estimates for others. As I have noticed in the past, these estimates may be quite unreliable.
I don’t understand why they stopped publishing International Energy Statistics with country data, but continue to release the numbers for world total.
The source of this data is the same: “EIA, International Energy Statistics Database”.
I don’t understand why they have data on Egypt (a secondary producer), but do not release data for Brazil, which is much bigger producer.
The IEA database is definitely better the that of the EIA, but unfortunately C+C statistics are not available in free access.
Hi Alex S,
I disagree, I find the EIA data much easier to use. Note that the full IEA report is released after two weeks. There is no IEA C+C data, so I find it less than useful. Also, not providing the data in a spreadsheet is kind of 20th century.
The EIA data is not perfect, but is better than most other data out there.
I agree they should use data from other nations where it is reliable. Some nations do not provide reliable statistics, but Mexico, Russia, Canada, and Brazil do not belong to that group.
Perhaps the EIA uses “secondary sources” in cases where they believe they are more reliable. My access to proprietary data is not good, no doubt the EIA has access to more information.
Dennis,
The EIA data is much easier to use, but when you need data for individual countries, 1) it is less accurate; 2) it is now non-available for most of the countries.
Therefore, when I need oil statistics for large non-OPEC producers, such as Canada, Mexico, Brazil, Russia, Norway, UK, China I prefer using national statistics. They are more detailed, more accurate and more up-to-date.
I m sure it is possible to find statistics for some other non-OPEC countries, such as India, Australia.
For OPEC countries, I am using the numbers from the IEA or OPEC. They have separate statistics for crude and NGLs.
After the EIA discontinued statistics for of all countries, the only remaining advantage of its international energy statistics is the aggregate data for the world. But given inaccuracy of the EIA data for individual countries its numbers for the world should be viewed with a caution.
BTW, the IEA has a good database in excel format. Unfortunately, it is not available for free users.
Hi AlexS,
I didn’t realize that. Thanks.
The EIA was definitely better for international statistics in the past, for World C+C, it is the best we have and BP is best for C+C+NGL (in tonnes).
There was something like that before:
1/5/2011
EIA terminates updates of International Energy Statistics
http://crudeoilpeak.info/eia-terminates-updates-to-international-energy-statistics
There were 28 Non-OPEC nations and 12 OPEC nations in the old International Energy Statistics. In the new abbreviated version there are 8 Non-OPEC nations plus one called “Persian Gulf Producers”.
I don’t think they are hiding anything, they just don’t have the budget to keep the old survey going. But it is interesting to note that, or it seems to me that, all the cuts came in the international survey sector, not in the domestic sector.
“they just don’t have the budget”
I watched an interesting interview with John Stewart today where he mentioned that one of our political parties had a great “tautology” going: Keep the government from doing things and then blame it for being incompetent. This may be an example of that.
“However when the May production numbers come in, I think it will then become obvious to everyone.”
Nah. It won’t be obvious to some people for *years*. It’s amazing how long people can ignore evidence.
You mean like Exxon ignore their own climate scientists for 40 years? Yup.
Exxon never ignored the evidence. They simply chose to act in a way that maximized the profits to their shareholders despite the fact that they knew what they were doing was detrimental to the entire planet.
well now if Exxon had “climate scientists” on their pay roll 40 years ago that would surprise me. However as I recall the consensus forty years ago in 1976 was that the world was entering into new ice age. So perhaps we all should thank the “exxon climate scientists”, for ignoring that evidence and saving humanity from that catastrophe. Har. you guys are great for a smile.
To keep this post on topic AlxeS did you see the map on the MRO presentation where the highest well density in the SCOOP Woodford is in a narrow ban identified as “condensate” and to the east and covering a much larger area is a area identified as “oil”. You are absolutely correct in presenting the facts of the recent past, I am just pointing out that the future may well be something different.
well now if Exxon had “climate scientists” on their pay roll 40 years ago that would surprise me.
Well, guess what, I hope you are sitting down, SURPRISE!! 🙂
They apparently did, at least according to this article in Sciam.
http://www.scientificamerican.com/article/exxon-knew-about-climate-change-almost-40-years-ago/
Exxon didn’t just understand the science, the company actively engaged with it. In the 1970s and 1980s it employed top scientists to look into the issue and launched its own ambitious research program that empirically sampled carbon dioxide and built rigorous climate models. Exxon even spent more than $1 million on a tanker project that would tackle how much CO2 is absorbed by the oceans. It was one of the biggest scientific questions of the time, meaning that Exxon was truly conducting unprecedented research.
FredM,
I wouldn’t be surprised at Exxon backing climate research back then, but it’s worth keeping in mind, I think, that it was after about 1970 that global temperature began an upward trend and then it was a while before it began to look for real, and not just part of the variation that always occurs. It takes a while in such research before confidence builds.
I’m not talking about what Exxon did with the research, only about how those doing it might have been viewing their results.
Actually, global temperature has risen for well over one hundred years. The slowdown in the 60’s was mostly caused by long term extreme atmospheric pollution. If you were around then, you could see the air. As the air cleared somewhat and CO2 concentration rose, there was no holding back global temperature rise.
They had climate scientists. The company I worked for had them too. At one point in the early 90s I worked with this group (I supervised their former team leader and eventually he moved past me to be my bosses boss).
Anyway, we used to exchange notes with other outfits, and we could see faint signals in the data that we had seen some warming in the previous 30 years. But nobody thought it was statistically significant enough to change our design basis requirements.
Based on what I see the claims that “Exxon knew” are bullshit. If they had known they would have made more Arctic plays, set up to hold the Mackenzie delta fields, etc.
Fernando, would you mind taking the time to explain who exactly the climate scientist were in terms of their science background and mission. I have a great deal of respect for what meteorologist of the time were able to do with the tools at their disposal, but I was under the impression it was only with the advancement in satellite imagery that we have come any where close to establishing a baseline from which any “change” can measured from.
As for what people “know” we have local experts here who can’t agree what peal oil is or if peak oil has occurred or when it might occur and this subject is clearly of less scope and easier to model with less variables than the earth’s climate. This does not take aways from the good work Ron, Dennis et al are doing.
Texas, we had a mixture of people. Some were geophysicists and engineers who had evolved into climate wonks. We had a couple of ex USA military who had worked in their cold regions programs. And Canadians who had worked in the Beaufort projects. It was a mixed bag.
Back in the early 90s we had acquired the USA Arctic ice coverage data. As it turns out the USA did have satellite acquisition over the Arctic to see where Russian subs could pop up to shoot their missiles. The data went back to the early 60’s.
We also had information such as temperature records in lots of stations north of 60 degrees North.
Our emphasis was to try to figure out the climate trends to define the design basis for ice capable tankers, platforms, etc.
We also could take sea floor cores, and those have lots of information. They had people checking bugs, pollen, sand grains, and of course sea floor permafrost.
Anyhow, I sat in quite a few discussions as to what exactly were we supposed to use as a design basis, in the end we decided the trend was too short, and we just couldn’t be sure it would turn around and get colder. We took the data and used it without extrapolating it into a theoretical warmer climate.
So, the way I see it, a company which really thought it was going to get warmer would start buying up rights for Arctic projects all over the place. As far as I know Exxon only had a share of Prudhoe, a share of Sakhalin I, and were dabbling a bit in the Pechora onshore. I think they would have gone for the Mackenzie delta and the Beaufort properties if they were convinced it was going to get warmer.
Fernando,
Thanks, that makes sense. In other words, you had some very talented oil and gas people (geophysicists and engineers) who were ask to research “weather patterns” to help the company make decisions about how to design facilities to extract oil and gas. That makes sense. What does not make sense is to call them “climate scientist”.
Question for you texas tea-
Assuming you are in texas and have a bunch of friends/colleagues, in general do the people you know feel that wind/solar are asset to the states economy, or do they see it more as a nuisance or threat to their particularly industry, or as an imposed (incentivized) burden?
Here in Calif (amongst people I have heard discussing it) I sense a mixed bag, but overall cautiously positive. I say cautiously because so far it hasn’t been cheap, and the benefits aren’t perceived to be widely shared among the populace.
Texas, some of these guys studied the subject for over 20 years. Most had gradúate degrees. Many climatologists and met-ocean experts began careers as physicists and atmospheric physicists in the 1970s. I studied quite a bit of oceanography, and my professors had a mixed background.
I don’t think we had a particularly exceptional team, but neither did I find other outfits with more muscle, even in the Russian institutes or in Canada, Finland, Denmark and other centers it was still a subject people were groping simply because the satellite and buoy data was pretty scarce.
Texas tea,
“You are absolutely correct in presenting the facts of the recent past, I am just pointing out that the future may well be something different.”
I am sure that the future will be different.
I have no doubt that:
– there are some very good wells in the Oklahoma resource plays;
– there are liquid-rich zones in some of these plays;
– some of shale companies operating in these plays can significantly grow output volumes;
– although LTO production in OK has remained relatively stable around 50 kb/d in the past 2 years, it can start to increase after a further recovery in oil prices.
But I doubt that:
– OK shale plays are a new Bakken or a new Eagle Ford;
– they can be a game-changer in terms of overall US oil production.
Ok, I think I now understand your view point, hard to argue with that.
Do you guys have any opinion about the HRZ on the north slope of Alaska. First few test wells look promising and flow tests (fraccing) being planned.
Too expensive. Maybe they can elect somebody who will cut taxes to the bone to keep the pipeline working.
By the way, are Todd and Sarah back in Wasilla?
Exxon: The Road Not Taken
Inside Climate News
The reality is most of us ignored climate change/energy for decades. Great fun to rant at Exxon I guess. Kind of like a bunch of kids yelling “I didn’t do it”. Course if you’re a person who believes anything an “expert” says, guess it all makes sense.
The point I was trying to make was simply that Exxon did indeed have climate scientists on board who told them that climate change was a problem.
Exxon took that into consideration and made a decision to ignore their advice and move forwards with their development of fossil fuels as did many other oil companies and the rest of industrial civilization for that matter.
I’m not suggesting I’m any holier than Exxon, given the circumstances and the huge profits to be made had I been in a position of power to do so I might just as easily have succumbed to the temptation and found any number of perfectly sensible rationalizations to proceed exactly as they did.
That was then, now we are here and we know a lot more. We have lost our collective innocence and it’s time to accept that we have a problem and find ways to get beyond it, assuming we still can.
I agree that blaming people for doing what they did back then is not very useful. Heck, back then I sometimes drove 4oo miles to get my helicopter flight out to an offshore oil rig…
Fred maybe we can make it very simple. The article you cited compares what exxon “climate scientist” knew and then compares the handling of that information with what tobacco scientist and tobacco companies did with that information. Now aside from the absurdity of that comparison which only serves to throw red meat to the unthinking alarmist, lets put some perspective around this. Lets assume that Fernando and the author are correct and that indeed, Exxon and other “oil”companies did have “climate scientist” on the payroll and they had some idea that Co2 or methane or some other product of fossil fuel use was a contributing factor climate change. Now what would you have them do. There were no alternatives at the time, nationally we were in the middle of regional hot wars, the cold war and as always in economic competition.
This is where I believe Peak Oil and “Clean Renewable Energy” meet. We are now closer to the time where Alternative Energy as a growing part of our energy mix may well be a distinct economic advantage providing US citizens a higher level of national security and economic security relative to our military and economic competitors. But for that to happen we need all forms of energy to continue to be developed, evolve and compete in the market place. We don’t need a few brilliant as they maybe know-it alls, stifling competition, declaring some forms “bad” and others “good”. The idea that the biggest economy on the planet should economically “disarm” in the name of “saving our planet” and by banning certain sources from our energy mix is beyond dangerous. Now lets get to making America great again;)
What did we want them to do??
Tell the truth.
Everyone is angry at Exxon because they lied for decades. Not because they produced oil.
They financed a campaign of disinformation that denied there was a problem…that’s the problem.
https://www.dmr.nd.gov/oilgas/stats/historicaloilprodstats.pdf
995 more wells added from Dec of 2014 to March of 2016, monthly production fell about ten percent from the highest production reached in Dec of 2014.
2014 12 38096604 1228923 11744 3244 105
2016 3 34386634 1109246 12739 2699 87
The decline in production is not due to the price crash, the oil isn’t there in copious quantities.
995 more wells must have an investment cost of some six billion dollars or so at six million dollars per well and still the production decreases.
If it is true across the board, in all oil producing regions, a steady decline will happen and the price of oil won’t be to blame.
“995 more wells added from Dec of 2014 to March of 2016”
“The decline in production is not due to the price crash”
Much more wells should have been added to offset output decline from older wells.
They were not added due to price crash.
The latest Monthly Oil Market report from the IEA
https://www.iea.org/media/omrreports/fullissues/2016-05-12.pdf
has a graph on drilled and uncompleted wells in the US (page 23). Peaked at around 4,700 end 2014 and is now down to 3,800
Russia’s economic issues basically necessitate that they double down on oil production. Their economy is heavily reliant on it and they haven’t got time to do a u-turn on that. Plus, it makes for a great PR blast.
WAY OFF TOPIC but too good a pun to pass up, this headline is from my Google News bookmark.
“Tesla Model S Mounts a Toyota Camry in Florida, Damages Two More Cars”
Can TESLA actually screw TOYOTA, and by implication the rest of the auto industry? Not likely, but still funny as hell from a farmers pov. We are used to seeing such things, you city slickers only know about dogs humping your leg. 😉
Probably see the day soon when Toyota has the better battery. Then the race is on and we will see who comes out on top.
Tesla and Panasonic have a huge head start but Toyota has the muscle. My guess is that within ten years or so, EVERY body will have a satisfactory battery, by either building it in house or buying it.
Of course, production is somewhat related to demand. Right now demand is high, but will it continue to be high in the future?
In 1960, passenger cars got about 14 miles to the gallon, traveled 587 billion miles all for 180 million people. They used 41.1 billion gallons of gasoline to do that.
In 2010, passenger cars got about 23 mpg, traveled 2025 billion miles to service 309 million people. They used 86.8 billion gallons of gasoline.
More than three times the number of cars registered and a little more than twice the use of fuel.
Looks like America went on a car buying spree, added a lot of people but forgot to raise the mpg far enough to cover the increase in travel.
For EV’s to go as far as the 2010 cars, it would cost 73 billion dollars in electricity.
US drivers spent $348 billion on gasoline in 2010 and $448 billion on gasoline in 2011. $337 billion was spent on gasoline in 2015.
Seems to me that the savings on gasoline would pay for a full replacement of cars with EV’s, especially since it will go up in price again. So it would pay for the American public to shift to EV’s over the next 12 years or so. Better than eventually paying $6 to $10 a gallon, while your neighbor pays next to nothing to go just as far. With falling production and increasing cost for oil production, best to be out of the demand end of that business.
Clearly we have a few years (15-20?) before gasoline prices reach $6/gal. In that time, hopefully we will see several generations and dramatic improvement in electric car cost and performance as well improvements in the power distribution such as grid level storage….Oh, and by the way, we would need our utilities to increase the number of power plans by what 40%? Additionally, most of them would run on natural gas? That means a lot more natural gas wells would need to be drilled, and the capital estimates should include these new power plants, distribution networks, etc.
It is not clear to me. Prices have hit over $4 a gallon in the near past, taxes will have to increase for road maintenance and expect a carbon tax this decade. I expect US gasoline to hit $6 within this decade.
The shale fields will play out within that 15 to 20 year span, reducing output as they go. We need to have alternatives in place and EV’s at least to the 50% level by or before 2040 to avoid extreme prices for gasoline as the world demand outstrips supply.
The diesel locomotive and automobile had large advantages over coal fired locomotives, so coal faded as a transport fuel without the huge price rise.
EV’s have advantages and large potential advantages over gasoline engines, especially since we are at the peak production time and gasoline will only become harder to get as time goes on.
With coal there was time for an easy transistion, with gasoline we are edging into the downhill slide so prices could wander quite a bit, until they just go up or gasoline becomes unnecessary for most transport.
As far as utilities go, a properly designed EV will not use much external energy at all. The current ones we have do use some but I could run one from just a few PV panels on my house, so in the long run, no need for added power plants. In the short run, there will be some extra demand, but nowhere near what people think.
Unlike ICE’s the power for EV’s can be easily locally generated.
Check back with me around 202o, that should be an inflection point.
Hi Brad B,
Costs for solar and wind have been falling so a lot of the new supply will come from those sources. Eventually natural gas will peak and decline (2030 or so), so using natural gas is a poor future bet for low electricity cost.
Wind and Solar widely distributed and interconnected with the grid and some natural gas backup takes care of intermittency and is probably the lowest cost option going forward.
See
http://web.stanford.edu/group/efmh/jacobson/Articles/I/WWS-50-USState-plans.html
excerpt from above
The transformation reduces 2050 power demand relative to a business-as-usual (BAU) scenario by ~31.4% due to the higher work to energy ratio of WWS electricity over combustion and the elimination of energy for mining, transporting, and processing fuels, and another ~6.9% due to end-use efficiency beyond that already occurring in the BAU case.
About a 38% reduction in energy use relative to BAU by converting to Wind, Water, and Solar.
And
http://www.sciencedirect.com/science/article/pii/S0378775312014759
Excerpt from above
At 2030 technology costs and with excess electricity displacing natural gas, we find that the electric system can be powered 90%–99.9% of hours entirely on renewable electricity, at costs comparable to today’s—but only if we optimize the mix of generation and storage technologies.
They look for lowest cost option which entails excess capacity, about 3 times that needed to meet average load. Note that the existing grid also needs excess capacity to meet peak loads.
Dennis, I doubt the wind/solar/natural gas will be the lowest cost option even by 2030. Certainly 90-99.9% of hours being powered by renewable electricity will be out of question, at least in the United States and China (unless it means for a few hours or a few days).
Practical, on the field experience (not from theoretical models/simulations) from China seems to indicate that it takes at least 1 GW of fossil fuel power plant to back up 1 GW of wind/solar. In the Chinese case, this has to be done for the most part by coal (unless hydro is available).
I’ll contribute another post here in a few weeks once the latest BP Statistical Review becomes available and will comment more on this.
Hi Political economist,
The excess wind and solar backs up itself, did you read the paper?
It is a simulation based on real weather data over a four year period and actual electric demand over that same period for about 25% of the US.
Also are you including externalities in your cost estimate?
At “2030 technology costs” they cover 90 to 99.9 % of load for 25 % of the country.
Denis, my analysis shows that, any time a study extrapolates to a supposed lower cost scenario, it fails to pass the smell test.
There must be hundreds of cuddly lets do renewables articles like this (I don’t think it merits being called a paper). This in turn drives amateurs and energy populists to back extremely stupid actions.
I have yet to see a serious engineering and economic project study on this theme, published and posted for download.
Read the work by Mark z Jacobson that I linked. Costs for wind and solar in optimal locationso are already competitive.
Do you believe fossil fuel prices will remain low after the Peak?
Nuclear is also expensive. Wind, water, solar and geothermal along with energy efficiency makes sense going forward.
If not we will need to use less energy.
In optimal locations. With incomplete records. Don’t forget my job was to run down errors in engineering studies, and I simply can’t find anything I would grade as fit for purpose. There’s a huge amount of bullshit running around.
Hi Fernando,
The better locations are where most of the power is being installed in the US for Wind and solar. Current costs in the better areas (Midwest and Texas for wind and southwest for solar) are currently very competitive with coal and natural gas. The cost of solar in particular has been coming down quite rapidly and utility scale PV solar with tracking has a capacity factor of 32% for 2014 projects in the US.
The studies may not meet the level of perfection you require. The transition will be gradual and widely dispersed interconnected wind and solar will over come most intermittency problems if overbuilt by a factor of 3 (capacity of 3 times average load). Very little backup or storage will be needed up to 90% of average load. Existing plant can easily supply backup for the remaining 10%.
Do you agree that fossil fuels will peak?
Nuclear is not cheap, and is probably not needed, an expansion of hydro and geothermal where it makes economic sense is a good option. Finding the lowest cost option accounting for externalities is the best way forward.
After the fossil fuel peak in 2030, fossil fuels will no longer be the cheapest option.
OECD nations should start the transition and drive down costs and in 20 years the developing World will find wind, water, and solar are the cheapest option.
The studies may not meet the level of perfection you require.
That’s very polite, but…there’s no evidence for it.
I would very much like to see Fernando make a specific objection to a study like this, rather than present a “hand waving” argument. We shouldn’t assume that he actually has evidence for his argument, in the absence of any kind of specific facts or arguments.
Fernando: please provide evidence.
Hi Dennis. Just to point out here that just because an academic paper assumes a scenario where “wind/solar will back up themselves” doesn’t mean that it works in the real world.
In Calif currently the wind/ solar electrical peak output has turned out to not match peak demand all that well, leaving a fairly big management problem. Either other sources of generation are needed vs huge storage capacity vs some sort of enforced alteration of the demand (punitive pricing structure- beyond what we already have).
Not saying I am against a big wind/solar buildout, but I’m just saying I wouldn’t so readily discount the need for other sources of supply for decades- be it coal, Ngas, nuc’s, or whatever regions can come up with as time goes by, to help with the load.
In Calif currently the wind/ solar electrical peak output has turned out to not match peak demand all that well…
Well, no, solar peak output matched peak demand quite well. The current challenge is that CA has shaved off the peak quite thoroughly, and so now we’re looking at a secondary peak in the evening. This is normal, and quite expected by everyone concerned.
some sort of enforced alteration of the demand (punitive pricing structure
There’s nothing punitive about time-of-day pricing. Home owners can adapt with inexpensive programmable thermostats: the obvious strategy is to turn on the the A/C during the daytime when solar power is at it’s peak, and then turn it down for a couple hours in the evening peak. This is, of course, a reversal of the traditional strategy of leaving the A/C off during the day when you were at work, but people are smart – they’ll figure it out.
Hi Hickory,
Did you read the paper?
It looked at load data and wind data over a four year period (actual data for about 25% of the US). The wind, and solar (mostly onshore wind) could provide 90% of load at competitive prices with conservative assumptions about 2030 costs (assumed costs continued to decline, but no big technological breakthroughs). In order to achieve this excess capacity (about 3 times average load) is needed and the wind turbines and solar panels need to be widely dispersed.
Note that the existing grid can provide backup as wind and solar ramp up and that existing power plant already have excess capacity, that is how the grid handles peak load. To get to 99% renewables, batteries, fuel cells, and vehicle to grid provide some of the backup and costs are higher, but this is more likely to be achieved in 2060 than in 2030. My guess is that California does not have enough wind and solar capacity to provide its own backup, but as more is installed in more places it can eventually be achieved. Not likely by 2030, but maybe 2040.
This is actually a very conservative study: due to limitations on computer processing power, they didn’t look at “wind-gas” as a backup for seasonal renewable production lulls.
Therefore their proposed system is sub-optimized and a bit more expensive than necessary. You wouldn’t need to over-build quite as much as they project: I’d estimate a need for 50-75% overbuilding, which is very similar to current levels.
Hi Dennis, so basically it depends on assumptions of about future storage technologies. I suppose it is fair to say that these assumptions are controversial.
Alternatively, we can find peer-reviewed articles that hold pessimistic views about renewable energy, especially solar. Have you seen those articles posted recently on Energy Matters about EROEI on solar. One of them claims solar has less than one EROEI. That I suspect is not reliable and involves some double counting in energy inputs. But there were also studies by Hall et al that found solar EROEI to be in low single digits. I think that’s more credible.
When we study the “costs”, I think it is useful to separate economic costs from externalities. Just to clarify the economic cost itself is not always easy. If we also count externalities, it requires many additional assumptions. For example, how to compare the carbon price (what carbon price we should use) and the poisonous materials used for solar cell manufacturing.
When we compare the current wind/solar cost with coal/gas cost, it is important to compare them on as equal a basis as possible. Because in the end we want to see large-scale application of renewables, not just as supplemental energy sources. For this reason, I do not find it particularly encouraging that, say, solar in certain “best sites” have become competitive.
Normally I do not take media reports on this at face value. For example, some days ago, there were reports saying in Dubai the solar price has fallen to 2 cents per kwh. I did some research and found that in fact the project was at a cost of about $2000 per kw, implying a unit cost of 15 cents per kwh (assuming annual fixed cost 10% (interest and depreciation) and capacity factor 15%).
One should also pay attention to the differences between countries. For example, China’s solar cost is cheap compared to the US. The current cost is about 8000 Yuan/kw (or $1300/kw). But coal power plant is even cheaper in China. The current construction cost is about 4000 Yuan/kw (or $700/kw, like the US gas turbine price; by comparison, the US coal plant construction cost is about $3000/kw).
Coal consumption has fallen in China over the last two years. Growth of wind/solar has been a factor. But the most important factors are decline of heavy industry and the surge of hydro (partly because of El Nino).
However, the Chinese electric power business has rushed to build coal-fired power plants. Over the first four months of this year, China built 22 GW of conventional thermal power (there is no data about how many of these are coal-fired or gas-fired, but normally coal accounts for more than 90%); 2 gigawatts of hydro, 2 gigawatts of nuclear, and 4 gigawatts of wind.
When I write my updated annual report on world energy, I will report my own calculations of electricity generating cost using EIA data. I will of course make the underlying assumptions transparent.
All of these are just dollar-to-dollar comparisons without taking into account intermittency, back up, storage et al. Perhaps, by 2030, we will see the materialization of cheap large-scale electricity storage but perhaps not.
At this point (without demonstration of viability of large-scale electricity storage on a, say, TWH basis), it is safe to assume that wind/solar will continue to be troubled by intermittency.
Hi Political economist,
The backup requirements are only needed when going from 90 to 99 %, very little backup is needed.
My comment on optimal sites is for today, in 2030 under reasonable assumptions wind and solar will be cheaper than fossil fuel power generation in all advanced economies due the coming peak in fossil fuels, even without accounting for externalities.
I understand very well that externalities are difficult to estimate, but it is very clear to me that the externalities of power generation by coal (especially without pollution control, as is the case in many developing nations) is far higher than the externalities from wind and solar power.
Have you read the work by Jacobson and Delucchi?
http://www.nasonline.org/news-and-multimedia/news/2015-cozzarelli-prize-recipients.html
http://www.pnas.org/content/112/49/15060
Other works at
http://web.stanford.edu/group/efmh/jacobson/Articles/I/WWS-50-USState-plans.html
Normally I do not take media reports on this at face value. For example, some days ago, there were reports saying in Dubai the solar price has fallen to 2 cents per kwh. I did some research and found that in fact the project was at a cost of about $2000 per kw, implying a unit cost of 15 cents per kwh (assuming annual fixed cost 10% (interest and depreciation) and capacity factor 15%).
With due respect PE, you have fallen for the oldest marketing trick in the book. The price was 2.99 cents so, that’s 3 cents not 2. The solar map for the UAE below shows that the average annual resource in Dubai is between 2100 and 2200 kWh/m2. That works out to a figure of 5.89 Peak Sun Hours per day which would indicate a capacity factor of 24.5 %.
Maybe the following article might point to a different perspective..
2 cent solar?
There may be a touch of the middle eastern tendency to brag and exaggerate in that price nonetheless.
Your claim about “field experience” is nonsense.
The evidence is that solar acts as its own backup during the daytime, once it’s in high enough volume; the sun is always shining somewhere. The same is true of sufficiently distributed wind; the wind is blowing somewhere.
Is this a reply to my post? Since you have not done research yourself and obviously you do not read Chinese, therefore, it is safe to say that you have no idea about Chinese “field experience”.
For this reason, your reply can only considered to be wishful thinking and nonsensical
Fernando and Political Economist,
A nice paper by Jacobson, DeLucchi, et al addresses intermittency.
http://web.stanford.edu/group/efmh/jacobson/Articles/I/CombiningRenew/CONUSGridIntegration.pdf
For the US 100% of energy needs can be provided by wind, water and solar (WWS) system by 2050 at an electric cost of 10.6 cents/kWhr (2013$).
Estimated future electricity cost under a business as usual scenario is 27.6 cents per kWhr in 2050 (including externalities) and 17 cents per kWhr if externalities are ignored.
Bottom line, transitioning to a WWS system will be cheaper in the long run. We should get started on the transition, 34 years to go!
Hi Dennis, thanks for sharing the articles. I am interested in your opinion on the following:
http://euanmearns.com/the-energy-return-of-solar-pv/#more-13773
http://www.resilience.org/stories/2016-05-27/the-real-eroi-of-photovoltaic-systems-professor-hall-weighs-in
The first one is not very credible but I think it has some interesting insights (but it’s peer reviewed and published on Energy Policy nonetheless). The second one (Hall) is probably serious research.
About falling costs of wind/solar, I think, just like any commodity, eventually they will run into space/resources/labor limits and at that point their cost curve will begin to turn up. We do not know how soon this turning point will arrive, but it may not be too far away. The following article has some assessment about the long-term limit of solar:
http://www.eis.uva.es/energiasostenible/wp-content/uploads/2011/11/solar-energy-draft.pdf
(a revised version of this was published in Energy Policy)
It should also be noted that as wind/solar expand, they will first substitute the more expensive fossil fuels. This will lower the cost of fossil fuels that stay on the market, creating barrier to further expansion of wind/solar.
In this sense, if we would really like to have a 100% renewable world, the renewables need to be competitive against not the most expensive fossil fuels, not the average fossil fuels, but the cheapest, best quality fossil fuels.
Hi Political Economist,
PV Solar power in particular is similar to computers in that it is a high tech industry with a potential for very large cost savings as scale increases.
If that is correct the cost of PV modules will fall below even the cheapest fossil fuels, there are also cost savings with distributed power as transmission and distribution costs are reduced.
I doubt that the transition to renewables will happen as fast as optimists like Tony Seba and others predict.
I think it likely that demand for fossil fuels will keep fossil fuel prices at least as high or higher than wind and solar but that falling costs of these technologies (especially solar) will eventually drive fossil fuel prices lower,but there is a limit to how much fossil fuel can be produces at these lower prices so if energy demand is to be met energy prices will need to rise. As technological development in solar and wind continue to push costs lower.
The price of performing one GFLOPS (one billion floating point operations per second) using a computer system in chart below. Note the log base 10 scale on the left axis, so the cost was reduced by a factor of 10^13 from 1960 to 2012 in constant 2013 US dollars. So it was 10 trillion times cheaper after 50 years for a billion FLOPS.
I don’t think PV will progress that fast, but think there is a lot of room to reduce the cost of PV modules.
Isn’t it true that much of those cheap fossil fuels are running on debt and not making profit?
We’ve actually already reached the point where the LCOE of solar and wind is cheaper than any other new construction for producing electricity — at least if you’re south of the Snowbelt.
In the US the main problem with solar panel prices isn’t even the panels any more. The rooftop installers are charging huge markups to cover, basically, marketing costs; these are something like a quarter of the total cost, with panels being less than half the cost. This is aberrant, since installation prices are much lower in Germany and in Australia. In Germany and Spain the governments are trying to tax solar panels to prevent them from being installed, which is unlikely to be an effective tactic; it’ll just make people mad.
Predatory business operators and schizophrenic governments. Sounds like the same old song. In fact someone should write a song about this.
Long time lurker first post.
As an Australian electrician and installer of solar panels and wind turbines I can tell you they don’t come close to being as cost efficient as the old cool fired power station’s. It would be great if they did but they are not in the same league some times reality is a bi$&ch.
Hi Political economist,
I have read the piece by Hall and Bardi, I agree more with Bardi than with Hall. The piece by Prieto and Hall extends the EROEI concept so far that it is not comparable to most other common EROEI measures.
A fundamental problem with the EROEI analysis is where to draw the boundries is never very clear. Possibly a detailed input output analysis would give a clear result.
An example of the problems with the Prieto analysis is that things such as roads, fences, and such were included and the output was considered at the distribution point near a customer’s home or business.
For marginal fossil fuels like LTO or oil sands, would an analysis that looks at EROEI find that at the gas pump the EROEI extended for these types of energy is more than Solar?
Also note that the cost of solar was considerably higher in 2008 than it is today so that study is quite out of date.
As far as your first link, I would say the study is not well done, see
http://cassandralegacy.blogspot.com/2016/05/but-whats-real-energy-return-of.html?utm_source=feedburner&utm_medium=feed&utm_campaign=Feed%3A+CassandrasLegacy+%28Cassandra%27s+legacy%29
Should have read link first. Some good comments by Prieto. Does not address that first paper.
My recollection is that the paper focuses on Germany, where sunshine is not all that abundant. As costs fall for solar EROI will improve.
Also the general piece by Murphy at the oil drum suggests a minimum of 10:1 would translate to about 3:1 for extended EROI.
If Solar is 11:1 using standard EROI measures that would suggest a little higher EROI than Prieto calculates, as Solar gets integrated into society on a wider scale the energy will be utilized more efficiently and EROI extended will improve.
Another point sometimes missed for energy use in transportation is that the greater efficiency of EVs vs ICEV will reduce energy needs (due to a reduction of thermal losses).
I have posted here before about developments that will drive down costs that are yet to hit the market. The first factory to use a “kerfless” process to produce wafers is currently under construction in New York state. It is expected that this will reduce wafer costs by up to %40. Premium module efficiences are now pushing past 21%, up significantly from just a few years ago. Going from 14% to 21% efficient modules means 30% less area (modules, mounting hardware, etc.) is needed to harvest the same amount of energy.
PV is already competitive with the most expensive FF and it is well on the way to competing with lower cost options. I make it a point of duty to try and keep up to date with the latest news on PV technology. Things are improving really quickly, making five year old studies useless if they didn’t include realistic projections of reduced costs.
Hi Political Economist,
The third paper, makes very conservative assumptions about solar potential and also makes unreasonable assumptions about energy needs.
Essentially it assumes the lowest possible area for solar PV and the highest possible growth in energy use, both assumptions are likely to be proven false.
For example most primary energy at present is used very inefficiently.
The use of Solar PV that existed in 2010 to estimate the future, is interesting, but is likely to underestimate future potential by a large measure.
The capacity factors for US projects are reaching about 32% in 2014 (for US southwest with tracking) and 28% for lower solar areas with tracking, without tracking it is 22% to 28% (measured in AC to be comparable with Wind and other power generation).
See
https://emp.lbl.gov/sites/all/files/lbnl-1000917.pdf
Let’s assume the World average is close to the US average and that tracking is used, this would increase the capacity factors to 30% from the 15% used in that older paper.
Also see
http://physics.ucsd.edu/do-the-math/2011/12/wind-fights-solar/
It’s bullshit.
Hi Fernando,
If you are referring to the work of Jacobson and Delucchi, the US National Academy of Sciences, disagrees.
From
http://www.nasonline.org/news-and-multimedia/news/2015-cozzarelli-prize-recipients.html
The Editorial Board of the Proceedings of the National Academy of Sciences (PNAS) has selected six papers published by PNAS in 2015 to receive the Cozzarelli Prize, an award that recognizes outstanding contributions to the scientific disciplines represented by the National Academy of Sciences (NAS). Papers were chosen from the more than 3,000 research articles that appeared in the journal last year and represent the six broadly defined classes under which the NAS is organized.
The annual Cozzarelli Prize acknowledges papers that reflect scientific excellence and originality. …
Class VI (Applied Biological, Agricultural, and Environmental Sciences):
“Low-cost solution to the grid reliability problem with 100% penetration of intermittent wind, water, and solar for all purposes,” by Mark Z. Jacobson, Mark A. Delucchi, Mary A. Cameron, and Bethany A. Frew
Link: http://www.pnas.org/content/112/49/15060
…
Hi Political economist,
As far as I know China does not have 3 times the capacity of average electrical load in wind and solar capacity. That is what it takes for 90% of average load hours to be covered by a widely dispersed interconnected wind and solar power network. The 99% number requires a fair amount of battery and/or fuel cell backup and is more expensive. The more capacity that is installed, the less that backup is needed. Also the backup becomes more expensive over time and costs are lowered by replacing as much backup as possible with excess capacity in wind and solar. For now China should aim for 90%, as costs come down in the future for batteries and fuel cells, excess power can be used during high wind times (or mid day for solar) to charge batteries or produce hydrogen to use in fuel cells for backup.
“Oh, and by the way, we would need our utilities to increase the number of power plans by what 40%”
I posted some back of the envelope calculations a while back Basically, I looked at the VMT for a recent year (2014?) and worked out how much electricity would be needed to supply a fleet of EVs with similar electricity consumption to Tesla Model S (not particularly frugal). Ignoring charging losses (10%?) it would have required 18% more electricity than was produced for the year. I also ignored the reduction in electricity use from not having to refine any petroleum into motor fuels to cover the VMT used in the calculation.
I think we can safely say that increased electricity consumption by EVs is unlikely to be a show-stopper.
Any comments from investors and hands on guys about stronger companies not previously invested in tight oil buying into distressed tight oil properties would throw some light on what the buyers think about future prices. There is plenty of news about bankruptcies, but not much about buyouts and mergers between tight oil and conventional oil companies.
So- are some conventional companies picking thru the carcasses of dead tight oil companies?
Very few of the Bankruptcies are liquidations – most are pre packaged restructurings. This is of course because the financial backers of the companies are confident the assets have value and that $40/bbl oil will not be the future price. The value of prime shale acreage has dropped very little and M&A activity for quality properties has been strong. The problem areas where economics were challenged to begin with such as the Tuscaloosa Marine Shale are having problems attracting buyers. (see GDP) Permian acreage is at a premium, note the recent Callon acquisition.
Rockman over at Peakoil.com has mentioned several times that the owner of his company (who has no debt and a boat load of cash to put into oil/gas opportunities) is still waiting on the sidelines…but is salivating for the tight oil bargain basement to arrive soon, as there isn’t anything around in the conventional arena that comes close to meeting his ROI standards. Like smart players, though, they holding their cards very close to their vests.
HVACman,
Has Rockman said that they are going to be looking at LTO possibilities? They’ve always avoided such, as I recall.
In May of 2014, Stone Energy’s stock price (SGY) was 48.54 usd, today it is at 65 cents, the 52 week low is 27 cents.
http://www.marketwatch.com/investing/stock/sgy
Looks like a fall of more than 99 percent, not quite 100 percent, but close. Not until the vultures start circling, then you can worry.
Probably can’t get any worse, but it might.
Unfortunately, the U.S. Energy Sector is in a lot more trouble than falling oil production. In 2015, the U.S. Energy Sector paid 48% of their operating profits just to pay the interest on their debt. However, it was even worse during the first quarter of 2016.
Here is a link to the chart. I can’t post it here for some reason: https://srsroccoreport.com/wp-content/uploads/2016/05/U.S.-Energy-Sector-Interest-Payments-On-Debt-.png
The U.S. Energy Sector paid a whopping 86% of their operating profits just to pay the interest on the debts in Q1 2016. Their total debts are $370 billion.
What’s even more alarming is that $5.1 billion of debt matures this year, but it balloons to $25 billion next year. It will be interesting to see how this plays out.
steve
Just wait till they start rolling that debt over to higher interest rates.
Hi Satan’s best friend,
Interest rates rise when the economy is doing well for a nation that has control over its own monetary policy (Greece does not apply). So the GDP rises, tax revenue rises, government spending falls (less welfare and unemployment payments) and debt can be paid down. If we want to pay down debt faster, raise taxes or cut government spending or both. Just need some compromise from better politicians to do it.
Dennis,
I have learned much from your posts and I am a fan of the work u do here.
I am pointing that out because, as we all know, thing can be misunderstood on Internet.
I think being in massive debt is risky. I just don’t agree with u here.
Ultimately, the markets determine interest rates. When people don’t think they will get paid back interest rates will go up.
I don’t think the fed can play money games forever. If they could we should have never seen financial problems in the past. But we consistently do.
There is no free lunch.
Hi Satan’s Best Friend,
I think we actually agree on the principle. The question is how much debt is too much? Do you really think and advanced economy with control over its own money supply is in trouble with central government debt of 100%?
If so, then yes we disagree. Do I think debt can be expanded without limit? Absolutely not. I think economies that approach Japanese levels of debt will be in trouble.
The low interest rates are indeed determined by the market to a degree, but the supply of money also has an influence on interest rates.
Also note that many are worried about private debt, this is a new problem that economists did not worry about in the past. The problem of government debt crowding out private debt seems to have been pushed aside and now the focus is on total debt, (public plus private).
Yes there is no free lunch, without proper monetary and fiscal policy there may be no lunch. 🙂
When inflation rises the Fed will tighten the money supply so that interest rates will rise. So far monetary policy has been appropriate and the reason for the slow recovery is too little debt, not too much.
Why did the Great Depression end? What happened to debt levels?
Hi All,
Russian C+C output from the Russian Energy Ministry, the data is reported in metric tonnes, I converted to barrels at 7.3 b/tonne. The last data point is March 2016.
http://minenergo.gov.ru/en/activity/statistic
An alternative estimate of World C+C that substitutes the Russian Energy Ministry estimate for Russia, the NEB estimate for Canada, and Dean’s Texas C+C estimate for Texas.
The decline from Nov 2015 to February 2016 is similar (about 930 kb/d). Also shown is the centered 11 month moving average (in red). I expect decline will flatten and output will stabilize around 79 to 80 Mb/d and as inventories are drawn, prices will rise, possibly dramatically, by the end of 2017.
It takes some time for supply to react to higher oil prices, so $135/b (2016$) in 2018 seems possible if decline continues and ramp up in oil supply is as slow as I expect.
I expect decline will flatten and output will stabilize around 79 to 80 Mb/d and as inventories are drawn, prices will rise,
Errr… the decline will flatten and stabilize around 79 to 80 million bpd? That’s exactly where they were in February, 79,653,000 bpd. You expect them to stabilize at exactly where they are right now.
Naw, I don’t think so.
And eventually you are going to have to start using the EIA numbers for C+C. They are the only numbers we’ve got. You can continue to make up your own numbers but they will not mean much. Eventually you will have to start using official numbers.
I know, I know, some of the EIA’s numbers I don’t like either. But they are the only numbers we have. JODI numbers are incomplete and totally crap. For OPEC they use the “direct communication” numbers from the MOMR, not the far more reliable “secondary sources” data.
Hi Ron,
I do use the EIA’s numbers for everywhere except Russia, Canada, and Texas where we have better estimates from Russia, Canada, and Dean (for Texas).
You have already shown what the EIA’s numbers are, not much point in repeating them. Those are the best C+C estimates, except for the estimate that I have shown above, which is better, imo.
Hi Ron,
The difference between the OPEC numbers and the EIA’s numbers are that OPEC’s numbers do not include extra heavy oil or condensate (these are in the NGL plus non-conventional estimate). To compare OPEC and EIA data for OPEC one has to use C+C+NGL data from the EIA and compare to OPEC secondary sources plus NGL and non-conventional. The last data point we have for OPEC NGPL from the EIA is Oct 2015, so if we look at third quarter 2015 the EIA and OPEC estimates fro OPEC C+C+NGL are very similar.
The EIA estimate is about 210 kb/d less than the OPEC estimate (or about 0.55% too low) for the third quarter of 2015.
Also note that my claim is that the EIA’s estimate is too low and Feb 2016 output is about 80,300 kb/d, if we add the OPEC underestimate it would be 80,500 kb/d (assuming the low estimate of the third quarter continued through Feb 2016, hard to know without an NGPL estimate for OPEC).
Dennis,
The Russian Energy Ministry has a final number for April, which is 88 kb/d , or 0,8% below January 2016 peak.
My very rough preliminary estimate for May, based on incomplete daily data from CDU TEK, indicates a slight increase vs. April levels.
Thanks AlexS,
Russia gets its data out very early. Are there usually revisions for the most recent month reported or are the estimates usually pretty close?
Dennis,
Preliminary monthly estimates are reported on the 2nd or 3rd day of next month.
Final numbers are reported about 3 weeks later.
Here are revisions for the last 6 months:
Hi AlexS,
Wow, that is excellent data. After 6 months I am assuming the revisions would be negligible, is that a good assumption?
Thanks.
Dennis,
As I said, revised numbers are released by the end of next month and they are final. The revised numbers for January-April in the table above will not be revised further.
Hi AlexS,
That actually makes me wonder if they are accurate if they are never revised. Russia has a big oil industry and there is a lot of data to process, maybe people don’t make errors in Russia? Isn’t there a yearly review of the data where perhaps there are revisions?
Dennis,
This is the legacy of the old central planning system, when all state oil producing enterprises had to report to the Oil ministry on the daily basis.
The numbers can be easily checked as all produced volumes are transported via state-owned pipeline system and/or export terminals. Therefore it is not a big problem to get the final number by the end of next month.
In fact many other countries release final oil production numbers with about a month delay. So it is not Russia, but the U.S. is an exception. And the biggest problem is Texas. There are thousands of small companies, which transport oil by pipelines, rail, river tankers and trucks, and are not required to report production numbers soon after the month-end. And each state regulator has its own rules of reporting.
BTW, statistics for Alaska and the GoM, where oil and gas fields are operated by big companies, are much more reliable and are rarily revised.
As you know, NDIC production statistics for North Dakota are also quite good.
Hi AlexS,
Yes the NDIC data is very good (though not as good as Russia’s), there are some small revisions but they are not significant.
A simple solution to Texas poor reporting would be to include the “pending well” file in the RRC data reported online, then revise each month if there are some wells incorrectly reported.
My guess is that stiff penalties for delinquent reports ($10,000 per well each month for every well not reported on time) would improve the data quite a bit.
In the South they like to take their time, so we will all just have to wait 12 or 18 months to see what’s happening.
My very rough preliminary estimate for May, based on incomplete daily data from CDU TEK, indicates a slight increase vs. April levels.
The Russian energy ministry has slightly different figures.
Russian oil output falls slightly in May to 10.83 million bpd
Russian oil output stood at 10.83 million barrels per day (bpd) in May, slightly down for a second straight month but still close to a record high reached earlier this year…
Preliminary data from the Russian energy ministry showed on Thursday that Russia produced 45.79 million tonnes of oil last month – or 10.83 million bpd as an average, down from 10.84 million bpd in April.
As I said, my estimate was based on incomplete daily data from CDU TEK.
The free data from CDU TEK was for only 24 days of May. For the 7 missing days I was using average numbers between the previous and the next day.
The resulting number was 45,855 thousand tons, or 10,798 kb/d (7.3 ratio) or 10,842 kb/d (7.33 ratio).
The preliminary number published today by the Energy Ministry is 45,790 thousand tons, or 10,783 kb/d (7.3 ratio) or 10,827 kb/d (7.33 ratio).
This is still slightly above the final number for April: 10,778 kb/d (7.3 ratio) or 10,822 kb/d (7.33 ratio).
Hi AlexS,
My understanding is that 7.3 b/t matches the average crude plus condensate density in Russia better than 7.33 b/t. Is that correct?
Dennis,
I was always using 7.3 ratio, although some western sources, including Energy Intelligence, use 7.33.
Rosneft is using 7.41 for its oil.
In any case, all official statistics are still in tons.
BTW, Russian oil mix is becoming lighter, as most of new oil from eastern Siberia, Far East (Sakhalin) and the north of western Siberia is light.
Hi AlexS,
Due to the lighter oil, 7.33 b/t would be a better estimate then? Are there any official Russian statistics on average C+C density in Russia?
Dennis,
I don’t have average numbers.
Here is a table comparing Urals export blend with the new Russian crudes:
Hi all. This is my usual end of the month update for Texas with the latest EIA data: as you can see this is the first major divergence between my data and EIA. Honestly, since the dynamics of the RRC data does not show any particular jump/change in their revision over time (see a comment of mine in the Texas post), I cannot anything about it, since my method is fully data-dependent.
Anyway, in (at least) 6 months we will an idea of the real data.
P.S. Some people told me jokingly (or not?) to wait after November 2016 for the real data 🙂
P.S.2 An ex worker of the RRC told me on Twitter not to trust the RRC data because they are very poor (he used another expression -which I do not report for politeness). However, I cannot find confirmation that this guy really worked at the RRC
here is the plot:
https://pbs.twimg.com/media/CjzKPe4VAAAZbcH.jpg:large
Of course, I will keep tracking both data sources because, as the story of the missing “barrels” showed, big revisions can come along the way very quickly:
– The 1999 Saga Of EIA’s “Missing Oil Barrels”: EIA’s Historical Bias For “Oil Supply Glut” Revisited
http://seekingalpha.com/instablog/910351-robert-p-balan/4802116-1999-saga-eias-missing-oil-barrels-eias-historical-bias-oil-supply-glut-revisited
– IEA Did It Again: Now, The Rush To Eliminate Those “Missing Barrels” Is On Full Blast
http://seekingalpha.com/instablog/910351-robert-p-balan/4881665-iea-now-rush-eliminate-missing-barrels-full-blast
– Returning To Market Balance: How High Must Prices Be To Save The Oil Industry?
http://www.artberman.com/returning-to-market-balance-how-high-must-prices-be-to-save-the-oil-industry/
Hi Dean,
I still do not quite understand how your estimation process works.
Could you post the link to your web page?
here it is :
https://sites.google.com/site/deanfantazzini/nowcasting-texas-rrc-oil-and-gas-data-ongoing-project
I also advise you to look at the Excel files I sent to you, so that you can see how the (simple) algorithm works
Hi Dean,
I did that, but there are correction factors for T to T-23 and its not clear where they come from.
One would expect with the move to digital processing the data would improve, but so far this does not seem to be the case.
Also it is unclear why there is such a difference in the percentage correction factors for condensate vs oil (the condensate has much larger errors on a percentage basis).
I found your web page and it is still not clear to me where the correction factors come from.
Hi Dean,
Sorry, I have got it now. I was only looking at the vintage spreadsheet, my mistake.
The spreadsheet for March 2016, makes the process very clear.
T is the sum of the previous 24 months corrections, T-1 the 24 month sum from Feb 2016 back to Jan 2014, etc.
This set of 24 correction factors is calculated for datasets from the RRC from March 2016 back to Jan 2014 and than the average correction factor is calculated for T to T-23 (24 in total) using all data sets from Jan 2014 to March 2016.
Average oil correction factors in chart below. These are averaged for March 2016 vintage correction factors.
that’s right. Sorry for the late answers, but I am at a conference with few time.
Regards, Dean
Hi Dean,
Not a problem, you were correct, all I needed to do was look closely at the information you provided.
Your method looks quite robust.
I am confident the EIA will be revising their numbers for Texas higher over time so that they become closer to your estimate.
Hi Dean,
I decided to add a lower bound to your estimate. I normalized the correction factors for month T to T-8 with the mean equal to 100 (half the mean would be 50, double 200) and looked at the probability distribution for oil and condensate. I chose two lower bounds, lower bound 1 has an 20% probability that the final value will be lower than the lower bound, lower bound 2 a 10 % probability that the final value will be lower.
Note to everyone that this is my “lower bound” estimate and is based only on the data for 9 of the 24 correction factors (the most recent 9 which have the largest values).
For the oil data there are 243 data points in the distribution, and for the condensate data there are 216 data points.
The mean of the correction factors is slightly below the median so the “corrected” line is not at 50% probability (the distribution is skewed). There is about a 47% probability that the final value will be lower than the corrected estimate.
Also shown on the chart below are the EIA and RRC estimates for Texas C+C output.
Hi all,
An alternative set of lower bounds for Texas C+C shown below based on the probability distribution of the set of correction factors used to calculate the average correction factors from July 2015 to March 2016 (most recent 9 months).
Dean’s best estimate has a 53 % probability that the final value will be higher than the estimate, we call this F53. This is because the probability distribution is slightly skewed with the median at 103% of the mean. Two alternative lower bounds at F65 (65% probability that the final value is higher) and F85 (85% probability that final value is higher) were calculated.
The F65 lower bound is relatively flat output from August 2015 to March 2016, the F85 lower bound is close to the EIA estimate in March 2016. This suggests that the most recent EIA estimate for Texas C+C is likely to be too low (slightly more than an 85% chance).
Dennis,
Am I correct that you assume here that the adjustment factors haven’t changed?
Based on a quick scan on month-on-month changes of production data for individual leases, I got the impression that an important part of the revisions have to do with late reporting of new leases/wells. Many leases were not revised. This could imply that a drop in completions would also lower revisions.
I therefore think it is dangerous to assume that the correction factors hold steady over time, and place. It would be very useful if more info is gathered on the underlying reasons behind these revisions (which part stems from new production, delinquencies, etc). Maybe you, Dean, or someone has already done so?
The increase in C+C production in the first few months of this year (compared with the last months of 2015), that you project, doesn’t fit my own expectation, based on the trend of fewer completions, coupled with well profiles that haven’t changed very dramatically, and the faster legacy decline (compared with the Bakken).
Hi Enno,
Dean’s algorithim works as follows.
Take this month’s RRC data and the previous month’s data.
Then subtract this month’s estimate from last month’s for all months where there is data for both months (most recent case would be Feb 2016). Correction factor for month T is the sum of these “corrections” for 24 months from Jan 2014 to Feb 2016.
month T-1 does the same for Dec 2015 to Jan 2016, and so on up to month T-23.
Dean has been doing this since April 2014 for Condensate and since Jan 2014 for oil so there is a set of 27 correction factors for each month (month T to month T-23). Dean calculates the average correction factor for month T to month T-23 for the entire data set.
The estimate is simply based on the data. It has worked very well through at least July 2015, Dean and I think it still seems to be a good method. Chart below show’s Dean’s estimates over time, if anything the correction factors have tended to be on the low side (except month T where occasionally they have been a little too high).
Based on this chart it is possible the March 2016 might be a little high, but through Feb 2016 the estimates are likely to be very good. We will know more next month.
Hi Enno
You are not correct about the correction factors.
They are different each month based on RRC data.
You seem to think they should be decreasing, but the data shows that they have been increasing.
Dean’s method has not changed, the data has.
Chart below shows the average correction factors from Jan 2015 to March 2016 for month T (zero on legend) to month T-11 (11 on legend). Jan 2015 uses the average of all correction factors from Jan 2014 to Jan 2015, March 2016 uses the average of all correction factors from Jan 2014 to March 2016. The correction factors from month T-12 to month T-24 were relatively flat and are smaller than month T-11.
Thanks Dennis,
Curious to see how this plays out.
The EIA’s Petroleum Supply Monthly is out with data for March 2016.
US February production was revised upward by 4,000 bpd to 9,133,000 bpd. They have March production down by only 6,000 bpd to 9,127,000 bpd.
Texas February production however was revised down by 7,000 bpd to 3,316,000 bpd. Texas March production fell by 40,000 bpd to 3,276,000 bpd.
Interesting how the 2015 peak of US crude oil production did not break the 1970 peak. Came close but did not break through. So US peak oil production still happened back in 70.
GOM big monthly increase is why March fell slightly overall.
Hi Ron,
Using Dean’s corrected estimate for Texas, US output has been relatively flat since May 2015.
Venezuela update: OAS Secretary Almagro released a 128 page report indicting the Maduro regime. A series of diplomatic maneuvers will follow. The report can be downloaded at the OAS site.
http://www.reuters.com/article/us-venezuela-politics-oas-idUSKCN0YM24Y
Today the national guard was firing rubber bullets at looters in Catia (that’s close to the airport road). Other sites saw sporadic looting.
Oh, and Maduro did a speech wearing a straw hat, in which he suggested Almagro take the report and stick up his rear end.
I keep hearing about slight drops in oil production. I’m also seeing social media with material hinting at forthcoming labor strikes and other actions. Caracas is basically paralyzed. Also hear lots of children and elderly dying in hospitals because there are no medicines.
More news here
http://uk.reuters.com/article/uk-oil-pdvsa-bp-idUKKCN0YM1VK
Looks like pdvsa doesn’t have money to pay BP for diluent it shipped and is sitting n tankers waiting for the payments to be made.
with respect to the “crap” on shore resource plays I offer;
http://www.oilvoice.com/n/This-Wipes-Out-Any-Spare-Capacity-OPEC-Has/33091bb719f9.aspx
Texas tea.
No arguments from me.
Never said shale inferior to what remains in US waters offshore.
I have beaten to death the issues I have with shale. No need to repeat.
Just wish after Thanksgiving, 2014 the shale guys would not have talked prices down so low.
I see WTI still bouncing around $49, LOL!
Junk, not crap.
“Shale oil offers a predictable, manufacturing-like business model around which companies can plan. And it can be stopped and started on a dime depending on oil prices.”
Well, all I can say is the ‘plan’ did not work out so well. The US LTO industry is 250 billion in debt and dead broke. It will have to hoc it’s fleet of G-4 600’s and all of it’s copying machines just to frac it’s DUC wells. The only way it can drill another shale well is paying for it with MasterCard, on installments. Its at a dead stop alright.
SS and Mike, I am really no different from you guys. I sat for years watching drilling and completion cost go up, lease bonus go up, royalty go up, making almost all our normal conventional prospects difficult to justify to your normal every day professional oil and gas company/investor. But Mike as you point out, from a big picture view, the US LTO industry is 250 billion in debt on one side of the ledger. But I would be interested in knowing what is on the other side of the ledger such as what was the total in lease bonuses paid, royalty paid, local taxes paid, state taxes paid, federal taxes paid. What was the total of salaries paid, what was the multiplier of that income within local and state communities. I do not disagree that drilling of wells should be out of income and not use debt, mainly because I think that will gives us higher oil prices and increase profits, but there are always two sides to every story and this story is still being written.
Yes, Mr. Tea; it was a great party the shale industry threw. It was really fun for less than 1/100th of 1% of American’s who got free royalty income, not so good for the hundreds of thousands of men and women that got hired, then fired. Shareholder equity had an OK time; most I’ll bet wish they’d never come. Lots of roads got tore up, then they got fixed, sort of, with all those “taxes” paid. Nobody got too drunk and save for a few earthquakes out in the parking lot, everybody had a grand time.
Now pay the bill ! The band, the hall, the beer distributor, everybody wants to get paid. Can’t throw a party and not pay the bills. Its un-Texas like not to.
When you owe the bank a little, the bank owns you. When you owe the bank a lot, you own the bank.
“not so good for the hundreds of thousands of men and women that got hired, then fired”
It’s better to have loved and lost. Then to have never loved at all. If your looking for job security. Marry an ugly woman(move to a communist country). Here in America, the strong survive. The weak are taken advantage of and kicked to the curb.
Welcome to the United Red States of Personal Responsibility and No Welfare
What can be done with someone like Stephen Hawking? All he can do is sit and think and at other times, he just sits.
I suggest that you find work in a field where you work with people who cannot produce, they are either physically handicapped or are mentally handicapped. They are not the strong and cannot survive on their own, they need help and supervision. Not just on Sundays, everyday, all of the time.
Look up the word compassion in the dictionary and read the definition. Heartless is one word not in the definition.
It will make you stronger to help the meek weak, they need it in the worst way.
It’s better to have loved and lost. Then to have never loved at all.
“It’s better to have loved and lost than to have never loved at all.”
Hey Walter, pardon my sarcasm. You of all people, half the time I can’t figure what’s the point of your comment.
I haven’t turned on the news yet today. But I’ll give you odds the headlines are something like this-
The Donald try’s to help Stephen Hawking from edge of cliff. Only saves wheelchair.
Huntington,
Where do u deposit ur money?
U own the banks! Lol!
If banks go away so does your money which is just a digit in their IT system.
Satan, I keep it in a number of Federal insured banks as to not go over the guaranteed limit in any individual one.
How’s that lumpy mattress working out for you ?
Banks don’t really like taking large write off’s and selling assets for 10 cents on the dollar. They are a lot more motivated to work with the borrower within cash flow.
I don’t have a bumpy mattress.
I have a survivalist bunker full of gold bullion.
When the shit hits the fan I’m moving to Canada to eat moose burgers and complain about how we get the the usa 900 billion dollar a year military for free.
It was really fun for less than 1/100th of 1% of American’s…
Hardly. U.S. households saved ~$150 billion cumulative on gasoline expenditures for the period October, 2014, through March 2016. And the savings march on.
https://research.stlouisfed.org/fred2/graph/?g=4Bn4
Hi Marmico,
For the average consumer who’s median income is about 30k (in 2014) and drives 12k miles per year in a car that averages 25 MPG (480 gallons/year), they would gave saved 480/year if average gasoline prices decreased by $1/gallon. So about 1.6% of their income, nice but not huge.
Oh and that 150B cumulative savings for the economy over that 18 month period, that’s over 27,700 B dollars or 0.54%, again not really a big deal.
In addition all the people who went out and bought F150s won’t be well served when oil prices spike in two years, the man on the street thinks peak oil will never arrive.
40% of Americans don’t have $400 saved up in the bank
Still decent help
Hi Wake,
Sure it helps some and it hurts the people in the oil and gas industry, on balance the effect has been relatively small. In the long run, as oil prices increase (and they will), the net effect may be negative as the man on the street thinks peak oil is nonsense, but they are mistaken, in the next 5 to 10 years this will become clear.
who got free royalty income, not so good for the hundreds of thousands of men and women that got hired, then fired.
Mike can correct me if I’m wrong but, I think he is referring to the people who made out like bandits with very little effort or investment on their part. That would be the folks in the part of the above quote in bold, I presume, folks who had a controlling interest (ownership or leases) in the land from which the oil is being extracted. Each such individual probably made orders of magnitude more than the 500 bucks each car owner saved per year for each $1 decrease in the price of gasoline (as calculated by Dennis above).
Even island folk like myself find the fact that JPS says customers rates at five-year low, now paying US 25 cents, welcome as it is, nothing in comparison to the windfall that royalty owners have been getting.
When you own mineral rights, somebody owns the land, the landowner must pay taxes and insurance on the property. It is not free royalty income when you have been paying taxes and insurance on land you have owned for 50 or 100 years. You have to have income from the property to be able to pay the taxes, if you don’t pay the taxes, the state will repossess the land. You have to have a source for the income, a crop, rent, it has to be worked in one way or another.
Mineral rights must be renewed, if you don’t, someone else might lay claim to them. You have to mind your p’s and q’s, be up to date, or you just might lose those mineral rights too.
It is not ‘free royalty Income’ when you have had to pony up taxes for the land you own for many years.
When some business entity comes along and wants to drill for oil, they just can’t set up shop and start drilling for free on somebody else’s land, that just won’t happen.
Texas tea. If you are equating shale to the US government borrowing money to give everyone $600 to stimulate the economy, I think you are making Mike’s point.
SS, I am trying to understand the why and hows. I try to leave emotion at the doorstep and see things from a bigger picture. Again the shale boom has made my normal business life a much difficult environment to conduct business. However, it seems to me, taking Texas as an example, where Rick Perry used to run around telling people that 99% of NEW jobs in the US were generated in Texas, was a direct result of the boom even though it made my life more difficult. From a government point of view, compared to the alternatives, was/is the shale boom more efficient at increasing the velocity of money compared to let us say “cash for clunkers” or all those “shovel ready jobs” where government at all levels, union bosses etc take their cut of the money before it is ever spent at digging the hole. The answer to that question give us great insight to the future in terms of where we may make investments decisions today. Lastly, irrespective of the economics, not compared to yesteryear, but the alternatives of today, based on the article cited and the actual decisions being in corporate boardrooms it appears LTO is here to stay.
I start with reading 10K and 10Q, and with actual production data. Facts.
The emotion comes from reading the facts, and then matching them to the claims. The claims appear to be at best, misleading, at worst, false.
Over a year ago, when 2014 10K came out, I noted here that almost every shale player would have PDP PV10 less than long term debt at $50 WTI.
As it turns out, in looking at the 2015 10K, many have PV10 ALL CATEGORIES less than long term debt. Further, most took great liberties with estimates of future production costs in even arriving at the 2015 PV10 numbers.
I have hammered and hammered on this, but apparently future net cash flows do not matter to shale. That is a big problem. Future net cash flow are the most important metric for any business. If those cannot retire the debt, over the long term, the business cannot survive.
PXD says they need $50 WTI and they will add rigs. Per their own 10K, if the price stays at $50 WTI, they have almost no PUD value. So which are we supposed to believe? Why would they add rigs when the net future cash flows from those rigs will not pay back their cost?
I’d be glad if you could explain how any of these companies are going to make it at the current WTI and HH strips.
Heck, I would be happy if you can explain how CLR was able to reduce estimated future production costs by 60% year over year, but yet only reduce reserves 9%. I continue to be astonished that no one has noticed stuff like this.
Then, we have the issue of CEO pay. Of course, CEO pay is akin to the oil lease promoter, who gets paid whether the well succeeds or fails.
Management is still getting paid high salaries, despite that the companies cannot afford to pay them.
Was looking at a shale gas company, Eclipse Resources, over on Seeking Alpha. They lost .58 per share in 2013, 1.27 in 2014 and 4.46 in 2015. PV10 all categories is $212 million, long term debt $527 million. The top three in management are still tapping the company for $500-$700K in salaries. And, this company is talking about making a profit on $30 million (yes, that is the cost) Utica wells with record length laterals. At $2.00 gas. The company is OPERATING at a loss, and always have.
Sorry if this kind of nonsense makes me a little emotional.
Shale is here to stay, and I hope it can someday pay for itself, because that will mean long term $100+ oil.
Most companies set up budgets and plans on a price forecast which may be higher or lower than current prices. They take that price forecast and use it to estimate project economics. Therefore, this company is using a higher price forecast.
My model keeps saying the oil price average will be $65 (more or less) over the next three years. I guess I need to update the input data, and it may be a little bit different.
Saw your reply in that article SS. Well said. Somebody needs to bring bondvigilante over here. H might be Mike’s long lost brother.
Agreed.
The shale companies have posted losses every quarter in the last five.
The upper management keeps making the big bucks.
Hi Shallow Sand,
Any opinion on EOG, they were GAAP profitable up to 2014, but lost money in 2015, seems like they are well run.
SS,
you say “Shale is here to stay, and I hope it can someday pay for itself, because that will mean long term $100+ oil.”
I think the odd favor that scenario. To your larger question question, I don’t think any body on shore US thinks they will make money on any drilling prospect, be they conventional or unconventional with the prices we have seen over the last 6 months. Here is the question, where do you feel the most comfortable buying production, when oil is at $110 or $28, and why. That is the same calculation that is being made industry wide.
The article I cited above make some very good points, drilling and marketing risk are greatly reduced, the mix of product (gor) is also known. The one, and it is a big unknown variable, is price, but price is and has always been the unknown. The energy is there, the amount is know (within certain parameters) and it is my professional life experience that the industry will find a way to produce it, to make it “economic” that assumes a higher price, better efficiencies and do not discount the possibility of certain tax incentives, we have seen them before.
Shallow, you need not explain the emotional component to your shale oil economic analysis to anyone, sir. Thank you for being gracious, but certainly not to me you do not need to explain. You, like thousands of other operators in America, stripper or otherwise, have been devastated by the price collapse recently, caused entirely by overleveraged LTO oversupply. You have your OWN money, and likely a good part of your life, invested in your production and in caring for your employees. Its hard not to be emotional when you are getting run over by a freight train. A freight train, I might add, that drilled 41,000 shale wells with finding costs way less than the even the KSA’s finding costs…because the shale oil industry has essentially not paid for it’s wells yet. It probably won’t ever be able to pay for them. Yet, you are correct, upper management in every public shale oil company in the country is still making tons of money, with little regard for shareholder equity and the probability of bankruptcy. If it doesn’t seem fair, it’s not fair. Anybody cheerleading for the shale oil industry needs to carefully re-examine their own values.
Hold your head up high, buddy. You were here before the shale oil industry fell on the floor, you’ll be here long after they are gone.
Mike
Oil Industry Drove US Wage Growth.
Now that Is Over report from Pew Research Center reveals that between the third quarter of 2000 and the same period of last year, wages across the U.S. rose by an impressive 7.4 percent in real terms, driven largely by the oil and gas industry.
Wages in energy-dependent communities rose by the most, in some cases more than twofold, such as in Texas. This shouldn’t be surprising as the period reviewed coincides with the peak of the shale boom in the country, even though it also covers two periods of recession.
http://oilprice.com/Energy/Energy-General/Oil-Industry-Drove-US-Wage-Growth-Now-that-Is-Over.html
Respectfully, Mr. Tea, the oil industry did not drive wage growth, a Federal monetary policy that allowed limitless, low interest loans to the oil industry, particularly the shale oil industry, is what drove wage growth. It was just another form of economic stimulus.
Before we tout all the amazing benefits that the shale oil revolution has given society, we should first see who actually pays for those benefits, right? I mean if it ends up being society that pays for it, soon, or down the road with the other 19 trillion dollars of debt we are leaving our kids, then it really isn’t the shale oil industry we should be thanking, is it?
Mike, food for thought, it is not that i do not agree with you. But I think you are missing my point. Our government has shown how they intend to play this out. Much like Japan over the last 20 years or the US in the 30’s, we are going to go from one form of stimulus to another, we are going to go further and further into debt, we are going to see scripted bull sh*t stories about how we are at full employment and how we need to tax more to maintain the illusion that the money we have still maintains some actual value. The point I am making is, if you were making a list of projects or ‘schemes’ if you prefer and rank those schemes in the ability to provide high wage jobs with in the US boarders, increase the velocity of money, raise property values and generate tax revenue for local, county and state coffers, where compared to the other ‘schemes’ would LTO be on that list. That is the world in which we live. That is the world in which will be living in for some time. That is the world our leaders will chose as to the alternative we have which is collapse and reset. You remember the old CCC, we have a number of parks around here where armies of unemployed young men worked at low wages for months and years on end, building. That is the world we live in. We don’t see the invisible soup and bread lines because of electronic food cards, but that is the world we live in. The choice we now have are severely limited by the decisions of the past that is the world we live in and that is not going to change. In that world, LTO may make a great deal of sense and may be the “virtuous” choice. When pitted against sending all our money to those “terrorist countries” geez seems like a no brainer for a politician.
following that line of thought texas tea, you can add other ‘projects’ to that LTO list. Things like electric grid infrastructure, solar and wind electrical generation, and water infrastructure of all sorts.
I agree that the government will do all it can to keep the ball rolling, even if it is a fools errand, just to get a good lead for the next election cycle.
Hi Texas tea,
Fiscal stimulus can be provided by reducing taxes or increasing government spending. Eventually taxes go to zero, at that point government spending might make more sense, but if one abhors government spending we could just send people money. If we give the money to the wealthy, they might just put it in the bank as they spend all that they need to already, so for the policy to work, its better to give the money to poor and middle income families.
Or if giving money away seems bad, you put people to work on roads, bridges, light rail, HVDC transmission, etc, but that is that “unnecessary” government spending, a very bad thing. 🙂
Hi Mike,
The income of the nation (GDP) is roughly equal to the 19T debt.
Generally speaking debt at this level is not a problem. Typically banks are willing to lend up to 2.5 times a person’s income (if they are debt free at the time) for a mortgage. About one third of the debt is owed to foreign investors, the rest is money owed to citizens of the US.
There can be too much debt, but we are not very close to that level at present. In fact the low interest rates make the debt less of a problem. If the economy starts doing well, the extra taxes should be used to pay down debt (which is what the US did from 1946 to 1973).
Dennis,
Would you be kind enough to explain what is meant by;
”The income of the nation (GDP) is roughly equal to the 19T debt.”
”Generally speaking debt at this level is not a problem. ”
At what level does it [debt] become a problem?
”If the economy starts doing well, the extra taxes should be used to pay down debt (which is what the US did from 1946 to 1973). ”
There is that if again.
So by when do you expect the economy will start doing well again? And what does “doing well” mean?
Hi Rune,
Doing well would be 3% annual growth in real GDP for an advanced economy. Debt at Japanese levels would be a problem. The Debt to GDP (Federal Government Debt of 19T) is about equal to US GDP, generally income is nearly equal to GDP. Fed govt Debt to GDP was about 106% in 2015.
The BIS has US govt debt at 100% of GDP and Euro area at 105%. For the entire non-financial sector (government and private debt) US is at 250% of GDP and Euro area at 270% of GDP.
Data from
https://www.bis.org/statistics/totcredit.htm
Dennis,
I enjoy your posts.
The idea that 19 trillion of public debt (60 trillion private sector) is fine defies common sense.
Much of that debt was spent on unproductive assets.
Perhaps macroeconomics 101 taught at university has some flaws in it. I recommend Steve keens work over in the land down under.
Let’s not forget the Medicare/Medicaid 1.3 trillion dollar expense that is compounding at 9% per annum is undeniably heading our way. Albeit that is not debt, it is a forward liability. And in 4 years that exponential curve will crush the governments ability to fund itself.
There is only one way to fix it. Destroy monopolistic pricing practices in medical industry. This will collapse entire industry. I got this from unpopular ( on this site and I agree with much of that) Karl denninger, but I must give credit to the mans ideas.
http://Www.market-ticker.org
Thanks for sharing ur ideas in a professional way.
Satan – “There is only one way to fix it. Destroy monopolistic pricing practices in medical industry. This will collapse entire industry.”
Your name is fitting
So what do you propose we do to fix the medical industry? Or are you suggesting everything is just hunky dory and no fixing is needed?
Hi Fred and SBF,
I was responding to the 19 T debt comment by Mike, that is an accurate number if we consider intra government debt (though debt owed to the public is the better metric in my view). BIS has debt to GDP for US at 100%, many nations in Europe (Belgium and Denmark) have higher levels around 150% debt to GDP (BIS data).
In fact the problem in Europe is that many governments have too little in debt and should provide some fiscal stimulus to boost growth and reduce unemployment.
The medical issue in the US will be solved by a combination of legal reform (to reduce frivolous lawsuits) and a national healthcare system similar to other OECD nations. The US is very backward in its health insurance system, eventually this will be fixed, a first step would be to offer Medicare to everyone and the government could compete with private insurers.
Hi Fred,
To suggest collapsing an industry that millions of lives depend on is just plan evil. If an airline pilot has a problem at 37000 feet, crashing the plane is not the answer.
Hunky dory is about the last word I would call the American medical system. Solving the problems ranges from more youthful education, changing American expectations of the system, more personal responsibility, better quality of available food & air to more doctors available for competition, lower costs to educate doctors, more focus on prevention, digital record keeping and a transparent pricing system.
Huntington,
I live in Australia but I am a red white and blue yankee.
I was amazed when I moved here and when I went to the hospital I was the only person that was having a financial panic attack.
The horror of going to the hospital for a $100,000 appendix removal with $250 aspirins for pain relief is a USA only problem. This isn’t normal.
Monopolistic pricing practices are ILLEGAL. There is no debate here.
Can you plot a graph with an exponential curve on it? 1.3 trillion at 9%.
It requires sixth grade math.
This is simply arithmetic.
Drop the political blinders and open an Algebra book.
Your welcome.
I know many think debt is bad.
I think too much debt is bad.
I agree Dennis. Debt, if used properly can make profitable projects available that other wise couldn’t happen.
Debt spent on productive assets is good as long as interest rates stay low.
Dennis and HuntingFool are correct here.
Debt spent on SPECULATING (guessing) might be bad; and is extremely risky!
When banks start targeting the lowest common denominator ( the riskiest assets ) ….Trouble is COMING! (Liar loans, etc)
Unfortunately, our debt is spent on shiny cars you don’t need, McMansions that are unnecessary, Nuclear weapons that will destroy the world 4x over, Shale oil which will never be paid back, etc etc etc.
I could go on for days.
We are in TERRIBLE financial shape.
Lying to yourself wont change anything.
Standing Ovation!!!
Hi Satan’s Best Friend,
I don’t think I know best how people should spend their money. I think personal freedom and responsibility are important.
We could make cars that aren’t shiny, if you think that improves things. 🙂
I own a couple of cars, I find them useful, when they were new they were shiny, when they are 10 years old, not so much.
For progress there needs to be some risk taken, not every new idea works out, but some are very useful. Again it is up to those with money to decide if the risk vs reward on any project makes sense.
Sure bets are only clear when looking backward in time.
The long twilight of the big oil companies
Fossil fuel producers face a future of slow and steady decline
FT View
Long term decline is simply a result of depleted oil and gas fields. It has almost nothing to do with global warming hysteria.
The fact that companies can’t explore and find sizable new resources will drive them to merge and buy up weaker outfits. Because peak oil is approaching, prices will rise, so we’ll see cash flow for the better outfits remain healthy, as the weak ones fall out.
But their inability to find investment opportunities to produce oil and gas doesn’t mean they will get into renewables. That option sure sounds stupid, simply because those companies lack the internal expertise and culture to start putting up wind mills or building hydropower plants. Maybe they’ll dabble in geothermal, which involves geólogy, drilling wells, etc?
Those who advocate that oil companies invest in renewables simply don’t know much about how to run a company, or how to devise a winning strategy. They are in lala land.
18 months of pain for the Saudis, knocking out production, exploration and development everywhere. They’re still the major beneficiary at the end.
Are you sure? They lack the ability to produce at a higher rate for a long time, therefore this wasn’t about increasing market share. They didn’t stop the Iranians and Russians in Syria, which may have been a reason for the price war. They lost a ton of cash flow, will lose more in the future. They caused unemployment in the USA.
As far as I can see KSA has a volatile, unreliable, nutty dictatorship with very little idea of how to pull itself out of the overpopulation and religious nuttism it has been encouraging. Their aims are being defeated, and they will be increasingly dangerous as a result.
“As far as I can see KSA has a volatile, unreliable, nutty dictatorship with very little idea of how to pull itself out of the overpopulation and religious nuttism it has been encouraging”
that is probably the best explanation for their policy I have heard because no other has made any sense. I read a article yesterday that for the first time they are entering the world bond market to raise at least $15 billion, I guess one might say they too are borrowing money to drill wells.
Venezuela PDVSA is not paying for their imports from the US.
“Four tankers carrying over 2 million barrels of U.S. crude are stuck at sea and cannot discharge at a Caribbean terminal because Venezuela’s PDVSA has not yet paid supplier BP Plc (BP.L), according to two sources and Thomson Reuters vessel tracking data.
The cargoes are part of a tender Petroleos de Venezuela [PDVSA.UL], known as PDVSA, awarded in March to BP and China Oil. The deal was to import some 8 million barrels of West Texas Intermediate (WTI) crude so Venezuela could dilute its extra heavy crudes and feed its Caribbean refineries.
While three cargoes for this tender were delivered in April, seven other vessels, including BP’s four hired ones, are waiting to discharge, leaving up to 3.85 million barrels of WTI in limbo. ”
http://uk.reuters.com/article/uk-oil-pdvsa-bp-idUKKCN0YM1VK
This is from Guardian:
https://www.theguardian.com/business/2016/may/31/gunvor-oil-chief-dividend-russia-us-sanctions-tornqvist-timchenko
Russian export of raw oil will be less by 3.5 million tons a year due to new refinery:
Medvedev to launch a new complex at Lukoil’s oil refinery in Volgograd Russia Oil and Gas, Metals and
Mining News
Hickory,
you ask “in general do the people you know feel that wind/solar are asset to the states economy, or do they see it more as a nuisance or threat to their particularly industry”?
I do live in Texas and my general impression is that Texas is a very business friendly state with a lot of new people coming here (citizens and non citizens alike) for the opportunities that they no longer have where they live. Part of keeping it that way has been a favorable tax code, (no state income tax) and planning for the future by encouraging/promoting a variety of energy sources/businesses. It is not uncommon to see a wind farm and a oil field on the same piece of land. Since we also have very strong private property rights, landowners who do not want windmills on their land do not have them and those that do not mind either lease or out right sell the land to the windfarmers. It is also my impression if it were not for the federal subsidies the wind farms would not be built or expanded. Of course they compete directly with those of us who sell nat gas, but that is not the real issues, it has been all the associated nat gas from LTO drilling that saturated the market and depressed prices. I know next to nothing about what roll solar plays in Texas energy.
texas- “I know next to nothing about what roll solar plays in Texas energy.”
Well, not much of a role yet, but I suspect that over the next 20 years it will have grown very big.
Texas has an awesome solar endowment, and I’m very confident that the economic forces will align to make it very worthwhile for the state to deploy it in a big way, without subsidies. If not within 5 years, certainly ten.
At least thats my take on it. Cheap, flat, dry land in western texas near a substation will get more valuable.
Yes, the economic forces will prevail.
Texas will be a giant slum in 10 years.
The whole country is a slum powered by revenueless Biotech and the Wind Ponzi and fracking which is probably EROEI negative.
Every state will try to outsource electricity generation.
The Department of (No) Energy can’t even save itself.
Its a hopeless Gong Show.
Dennis.
To reply briefly to your question about EOG.
Look at EOG’s 2015 10K and see how oil and natural gas prices being halved, compared to 2014, affected earnings, and more importantly, net future cash flows.
Undiscounted net future cash flows were estimated at $50.247 billion as of 12/31/14, using SEC 2014 pricing parameters.
Undiscounted net future cash flows were estimated at $15.555 billion as of 12/31/15, using SEC 2015 pricing parameters.
Note, 2015 benefitted from estimated future production costs declining from $51.113 billion as of 12/31/14 to $31.708 billion as of 12/31/15, and estimated future development costs declining from $20.270 billion as of 12/31/14 to $15.580 billion as of 12/31/15.
Further, note that PV10 all categories fell from $26.704 billion 12/31/14 to $8.965 billion 12/31/15.
Long term debt stood at $6.654 billion as of 12/31/15, so it would appear even EOG, under the SEC pricing parameters, would not qualify for reserve based financing from a US bank, under OCC guidelines.
EOG’s stock price has been very strong in the downturn, which signals it is believed it will survive.
I agree EOG is one of the strongest LTO companies, so hopefully my discussion of the numbers above shows why I am very skeptical about LTO at current prices, which are slightly lower than 12/31/15 SEC prices.
Dennis. One other item to note.
I do not think the estimates of future cash flows in 10K include either G & A or interest expense.
If you or anyone else thinks that is inaccurate, please let me know.
SS, I believe that you are right. On the other hand, remember that the cash flows are discounted at 10%, which would cover the majority of the interest.
Yes, PV10. I also set forth undiscounted future net cash flows above.
Hi Shallow sand,
I agree at current prices LTO does poorly, my point is that a properly run company can weather this storm. There might be stronger players waiting for opportunities as the poorly run companies go belly up, assets will be bought on the cheap and will be a profitable investment at the right price.
I imagine you could figure a price at which such assets might be worth the risk, though you may not be in the LTO areas. Mike has said he is near the Eagle Ford, perhaps he is sharpening his pencil to find some deals, even at $50/b, at the right price these wells may be worth buying and there will be deals as tents get folded.
Dennis. Shale is a big boys game. 15-20,000 ft wells.
We are very small. We will stick to the easy, boring stuff.
I’d guess Mike will also.
From what I read, there is still a lot of money floating around.
I just saw where Synergy paid half a billion for acreage and about 2,000 BOEPD.
If you are reading Enno, how about that Synergy deal?
Shallow,
It’s always an interesting exercise to look at the well performance of this company, and compare it with the EURs from the investor presentations.
The Niobrara makes it easier to estimate URs, as wells rapidly decline, and not many wells are above 20 bo/d by year 5.
I am pretty sure that Synergy Resources got more money from salesmanship (selling stock), than from operating activities since 2013, and I don’t think we’ve seen the last share issuance for the year yet (they already did 2 rounds in 2016).
No further comments 🙂
Enno,
It is always very interesting to compare well IPs from shale companies’ presentations with the average well IPs from your website and other sources.
As regards share issuances: after their shares prices have dropped by 70-90% these companies are issuing new shares diluting existing shareholders. And they still find new potential shareholders.
Shallow sand is right: there is still a lot of money floating around
Thanks Alex,
“As regards share issuances: after their shares prices have dropped by 70-90% these companies are issuing new shares diluting existing shareholders. And they still find new potential shareholders.”
It’s funny indeed how these new shareholders expect to be treated much better than existing ones.
“Shallow sand is right: there is still a lot of money floating around”
I agree. But I also think that there will be a rising concern, not about the return on these investments, but of the return of them. I also get the sense that there is a rise in skepticism, and scrutiny of the operations and claims of the shale industry. Mike is getting quite some support over at OilPro in his questioning.
And not only in the US (see point 7.).
Enno,
Banks are indeed becoming more cautious.
from Reuters:
Lenders to U.S. oil and gas companies seek liquidity floors
Thu Jun 2, 2016
http://www.reuters.com/article/us-usa-energy-liquidity-idUSKCN0YO2U4
Banks are increasingly requiring U.S. oil and gas companies to maintain minimum levels of liquidity, an unusual step that could help reduce the risk of being exposed to companies struggling to maintain operations and repay debt.
One of the energy companies hardest-hit by so-called minimum liquidity covenants is Chesapeake Energy Corp, according to a Reuters review of regulatory filings. Chesapeake must maintain $500 million in cash and other assets that can be easily converted to cash at all times, even as it posts losses and could be faced with nearly $1 billion in collateral calls.
The covenants enable banks, themselves facing increased regulatory scrutiny over exposure to highly leveraged energy companies, to limit risk without cutting credit lines, several oil and gas attorneys, executives and analysts said.
Lenders involved in such transactions include Wells Fargo & Co and MUFG Union Bank [UBCAL.UL], which declined to comment, as well as Bank of America Corp and Nordea Bank AB, which did not respond to requests for comment.
The wave of minimum liquidity covenants comes after some oil and gas companies maxed out their existing credit lines. They are sometimes imposed alongside “anti-hoarding” measures meant to prevent companies from building a war chest ahead of a Chapter 11 bankruptcy filing.
—————————————————-
But it seems that other classes of investors and lenders are still more complacent.
From memory, CLR produces about 220K BOEPD. 40% of this will be gas by year end.
They had around $11 million cash at last SEC filing and about $7.3 billion of long term debt.
They have 4 rigs running through the end of 2016 in North Dakota, with no plans to complete any well there. So spending over $2 million per well, no income from any of them.
They have around 15 rigs running in OK.
I just divide the well cost by 100 and the total production by 1,000, to get to numbers I am used to.
So, I think 220 BOEPD with 40% that I will be lucky to get $15 per BOE this year.
I have $11K in the bank and owe $7.3 million.
I have 4 rigs running, no plans to obtain any cash flow from those wells this year.
15 more rigs running, which will mainly produce $15 per BOE product.
Anyone reading this that has any type of small business.
Imagine being a small business owner owing $7.3 million, with just $11 thousand cash in the bank, and spending on capital projects that you are intentionally leaving half finished so you cannot generate any income from them.
This is a leading shale co in the US folks.
They have an enterprise value around $20 billion.
Yep, a lot of $$ floating around.
I guess the value is in the acreage?
Hi Shallow
Years ago I bought shares in a London listed company with producing assets in Russia. In 2012, Maxim Barskiy made a strategic investment in the Company. Shortly after doing so, he took over as CEO. They sold the field in Russia and bought leases in the Texas pan handle with active and non active stripper wells.
There have been various aquisitions and mergers, some wells are currently shut in but they are still drilling vertical wells ( but only 4 this year). The interesting point is that they are now fracturing these new wells in the old conventional fields.
I just wondered if you knew of any other operator that was re completing stripper well by fracturing them.
http://matrapetroleum.com/m/
hi shallow sand,
I suppose maintaining those wells would be too expensive and risky. I didn’t think you would drill new wells, just buy some older wells at a low price and maintain them, but clearly there are too many potential problems (which would be clear to you, but that I know nothing about) to make such an investment attractive at any price (even zero).
Thanks Ron. Love to see this bigger picture on production.
“But… the decline has only just begun. The price collapse caused the plateau in world oil production that begun about March 2015. However the decline did not actually begin until January 2016. The dramatic rise in production from Iran has kept the decline from becoming obvious to everyone. However when the May production numbers come in, I think it will then become obvious to everyone.”
Agreed. PO is in the rear view mirror.
And no doubt, when the price spike gets under way the so-called “press” will then report Exxon’s economists saw it coming but the company withheld substantial investments that could have helped offset the public’s pain. Most of their readers will believe what they want to hear.
“Agreed. PO is in the rear view mirror.”
Too soon in my opinion to call overall peakoil. I’d like to see if production can ramp up when prices rises first before making this statement.
Hi Dave P,
I agree.
Energy East pipeline benefits questioned in secret government memo
Getting Alberta’s oil to the East Coast might not result in the higher prices once expected
By Drew Anderson, CBC News Posted: May 31, 2016 7:20 PM MT
Canada’s energy superpower status threatened as world shifts off fossil fuel, federal think-tank warns
‘Significant disruptions’ forecast in 10 to 15 years as cost of renewables, energy storage plummet
By Robson Fletcher, CBC News Posted: May 30, 2016 3:00 AM MT
Regarding the first article:
“A pipeline carrying crude to Canada’s East Coast from Alberta was meant to capitalize on the price differential between North American (West Texas Intermediate) and world (Brent) oil prices. ”
The US ending it’s ban on exports killed that…may be a “secret” in Canada??
Regarding the second article:
“Given the time frames of a decade or more in the report’s forecasts, its language is couched heavily in “ifs” and “coulds.”
Again, PO is in the rear view mirror….wish it weren’t so, but time is up.
Middle aged men are among the most productive of all men, until the health cards turn against them, and sometimes they enjoy excellent health from forty to seventy.
I agree that the oil industry is probably at or very near it’s all time peak, maybe even past the peak, but it will probably hold up long enough for SOME of us to manage the transition to a low energy, high efficiency economy and life style-IF we make use of the opportunity without too much dawdling around.
aws,
When Soviets were doing their rounds of propaganda regular folks never believed a single thing. Soviets made mistake by not deflecting the official message through some fictitious think -tanks at that time – like this ridiculous name Policy Horizons Canada
I don’t have any trouble getting my head around the for hire car biz in terms of the business case. It’s a good business, no question.
But I do have a little bit of a problem understanding WHY ANY particular company should be expected to dominate the industry.
As some unpolished but very successful old general once said about winning fights, he won nearly every time because he got there “fustest with the mostest”.
So maybe UBER will be the big dog simply because UBER is firstest with the mostest?
Maybe so, but WHY should UBER, or any particular company, dominate or continue to dominate the industry?
Patents on technology? Entry barriers to the industry?Customer loyalty?
In other words, what is to stop some smaller, more nimble outfit, perhaps owned mostly by the drivers themselves,from out competing UBER, or any other big player, in a given city?
It’s hard for me to understand how it is that any particular company can enjoy enough economies of scale to dominate an industry when most of the actual people in it are driving their own cars, etc.
It’s hard for me to understand how it is that any particular company can enjoy enough economies of scale to dominate an industry when most of the actual people in it are driving their own cars, etc.
To answer that question you I think you need to understand the following two concepts:
http://platformed.info/uber-lyft-war-teaches-us-building-next-uber-x/
Success in the On-demand economy
There are two critical factors that will determine the success of a company in the on-demand economy: multihoming costs and interaction failure.
Anyone entering this game needs to have a really good handle on building an App takes both of those things into consideration. Insurmountable? Probably not but that is where they have to start.
I looked into building an App for an UBER like model for providing bilingual corporate communications services and came up with a figure of a couple million dollars. If you’d like to invest in the idea maybe I could crowd fund it. Owning the the cars is a minor investment compared to building the App for multiple OSes on multiple smart phone platforms.
HI Fred,
What you seem to be saying is that there IS a tough entry barrier, and it consists of the software necessary to make the business work. I am a real klutz when it comes to computers and IT, but I can see that this software once written can be protected by copyright, etc, for a long time.
But given the amount of business at stake, what’s to prevent any body with a few tens of millions handy from hiring a building full of programmers and coming up with a COMPETING app?
Is it too late for new competition?
But given the amount of business at stake, what’s to prevent any body with a few tens of millions handy from hiring a building full of programmers and coming up with a COMPETING app?
Is it too late for new competition?
Answer to your first point/question: Nothing other than money
And the second: Absolutely not! I’m sure there will be lots to come
A cracking read – offshore contraction:
http://www.oilvoice.com/n/This-Wipes-Out-Any-Spare-Capacity-OPEC-Has/33091bb719f9.aspx
”Offshore production has lower decline rates than shale does, but considerably higher decline rates than onshore vertical developments.
It is hard to pinpoint these decline rates exactly since each field is unique unto itself. What the industry generally believes is that offshore production declines at twice the rateof conventional onshore.
That would put the offshore decline rate somewhere between 15-20% per year. These higher decline rates mean that the sudden halt to offshore development will result in BIG offshore production declines.
Off a 22 million barrel per day production base—15-20%= 3.3-4.4 million barrels a day—gone. That is substantially more than the spare capacity of OPEC right now. That means that in just one year, the world oil supply could be put into deep undersupply (pardon the pun) as offshore exploration and development stagnate.
The article is a year old.
There is a long lag so this may hit soon. Perhaps end of 2016.
Oldfarmermac: “In other words, what is to stop some smaller, more nimble outfit, perhaps owned mostly by the drivers themselves,from out competing UBER, or any other big player, in a given city?”
Such a non-profit oriented business model, simply based on advanced car sharing seems interesting to me: Just share enough self driving cars with enough people and there will always be one car available for you – and that business model could be economically much more efficient for the user than UBER.
Taxi businesses in major markets- I’ll use Toronto because it’s the one I know- use a Medallion system, which limits the number of cabs on the road. This leads to those plates being valuable in and of themselves, much like farm quota in controlled agriculture.
While this does concentrate wealth in inequitable ways (plate owners make a lot of money, cabbies struggle by) it makes the system workable. Fares are predictable, staffing is predictable, profits are predictable. Cabbies are unhappy because there is a waiting list for plates, you have to be a working cabbie to get one, you may be retirement age before your name comes up IIRC, etc. But the system remains workable.
Much like air travel in the 1960’s (replace the grumpy cabbies with grumpy passengers.)
Enter Uber and a market where there are an endless supply of untrained, part-time drivers using their own cars. An uncontrolled system with low barriers to entry and externalized costs (in that vehicles are not being costed in a sustainable way.) The prospects to drive down wages, or to make it impossible to get enough rides to make a full-time living, are obvious.
There is a place for computerization and ride-hailing apps. Experience suggests that it has to go hand in hand with some kind of government instituted staffing control: a limit to the number of cabs on the road so that cabbies are encouraged to provide the public good of their being available, and so they can be compensated (hopefully somewhat fairly.)
-Lloyd
So you are saying Uber is a bad thing?
That government needs to step in and regulate this?
Lloyd’s Original comment:”Experience suggests that it has to go hand in hand with some kind of government instituted staffing control: a limit to the number of cabs on the road so that cabbies are encouraged to provide the public good of their being available, and so they can be compensated (hopefully somewhat fairly.)
Your comment:
So you are saying Uber is a bad thing?
That government needs to step in and regulate this?
Do you have a reading comprehension problem? I thought I was very clear.
I have run your next comment (Reno Hightower 06/02/2016 at 3:29 pm) through the Fox news to socialism translator, though, and it comes out looking like this:
Input:
if Lloyd thinks this needs the heavy hand of government intervention and regulation, I am afraid to see what he thinks about other businesses.
Translation:
Free market blah blah send the jobs overseas let the poor die without healthcare I got mine jack. Vote Trump cause he’s a billionaire!
If you are good with heavy goverment regulation just say so. No need to get all twisted off. Embrace it. Certainly no need to attack me.
If you are good with heavy goverment regulation just say so.
Give me a fucking break.
That I support government regulation of the Taxi industry is not in question. It is the underlying theme of my post. I don’t have to say it again, with your word (“heavy”) tossed in there. It’s obvious that you are against any regulation anywhere, so just say it, ok? The idea that you would change your mind and say everything’s cool if I said I was in favour of “light” regulation is ludicrous.
If you think the taxi industry should be completely unregulated (which is essentially Uber’s position) tell me why. If you have a reasoned position that considers why we have taxi regs in the first place, say, and that considers the rights of existing full time cabbies, or conversely, tells me why you don’t care about them or their families, make your case.
No need to get all twisted off. Embrace it. Certainly no need to attack me.
Your entire response is an attack on my underlying position that regulation can be a public good. It is an unsupported attack: you don’t actually say why your getting a receipt by email trumps cabbies being able to support their families. You set up straw men (“I am afraid to see what he thinks about other businesses.”) suggesting that anyone who supports any kind of regulation has some kind of problem. So yeah, I’m going to come back at your suggestive, passive-aggressive, aw-shucks, I didn’t mean anything bullshit. And yes, I’m gonna make fun of you when I do it, because humour helps point out the vacuity of your position.
So…if you’re a libertarian who doesn’t really understand the party line and cannot effectively argue it, just say so, and embrace it.
And don’t complain when somebody calls you on it.
Be a big boy, ok?
Ok. Thanks Lloyd. Just trying to get some clarity.
Happy to help.
I know the UBER exists, but I know very little about the technology. For example: a person flies into LA and gets a room near the airport. In the morning, he gets a UBER driver to pick him up at 7:30 am and take him to downtown LA. During the trip he notes that he will be there all week, and he is happy with the driver. The driver says, I will be at the hotel the next four days at 7:30 am sharp. He picks him up the next four days, cuts the price a few bucks each day and does it all off the UBER books.
In NYC, unlicensed “limo” drivers who own their own Cadillac or Lincoln, etc. park in short term parking and will troll “suits” for a cut rate limo rides to wherever. At least they did 15 years ago when I used to go there several times a year.
That is can the driver figure ways to cut UBER out of the picture? Like, suppose the passenger needs to get 30 miles away. UBER picks him up and after 5 miles “drops him off of UBER,” and takes him the rest of the way at a discount.
You pull up the APP. type in where you want to go, and a driver accepts you at the price you are quoted. Your credit card is on file. When I have used it, the car was no more than 5 minutes away and you could look on the APP and see where he was and how much longer till he got to you.
After he dropped you off, a receipt was emailed to you.
It is much better than a cab and if Lloyd thinks this needs the heavy hand of government intervention and regulation, I am afraid to see what he thinks about other businesses.
Sure, who needs the heavy hand of Govt., until the race for the bottom kills a few people? Or, some Uber driver is really a psycho killer…ooops, already happened. No one likes Govt regulation, until they have been hurt somehow, say for instance, an Uber driver’s insurance doesn’t cover an accident because it is really a risky commercial venture as opposed to an occasional driver going to and from work. In time, liability issues will kill Uber. Lawsuits will kill Uber.
Imagine if was as easy to sell food as it is to drive people around a city under the Uber system? Unregulated food stalls/carts selling expired food products, no hand washing, no safe storage, whatever…. people will one day get sick and die.
I’ve got a great idea. Let’s start an Uber-like medical clinic. I know some pretty savvy first aid attendents who might look good in a lab coat with the steth around their neck. Or, cheap leagal advice, no credentials necessary. Investment advice.
Govt ‘interference’ exists for a reason.
Actually, there is an answer: regulation is a good idea, in theory, but it hasn’t worked IN THIS CASE due to crony capitalism.
In my city (and, AFAIK, pretty much everywhere else) taxi companies exploit the taxi drivers ruthlessly. The drivers make far less than Uber drivers, and live in poverty Single Room Only housing.
Passengers suffer as well, because the number of medallions is kept far lower than what is needed, so it’s very hard to get a ride under anything other than ideal conditions. High demand due to rush hour, rain, etc, and it’s impossible to get a taxi. Don’t live in or near a very dense urban center? You won’t be able to rely on taxi service.
Most uber demand is new: people who never would have relied on tax service in the past. The loss in volume to traditional taxis is less than you’d think.
The taxi companies deal with threats of unionization by bringing in cheap illegal immigrants: Uber drivers are far nicer, easier to talk to, and safer.
There’s a reason Uber has been so successful. I don’t know if it says anything at all about regulation in other industries, or socialism, or any other Big Issue. But, as far as I can tell, Uber is a big improvement for both drivers and passengers. The only losers are the taxi company owners, who are pushing back as hard as they can, as well as a few unlucky independent drivers who invested in an expensive medallion and now have been hurt.
From way up top of thread. Worth remembering:
“All the major oil cos. have reduced capital spending on exploration and production by large percentages, with many decreasing by more than 50%.”
Sportsfans should recall this happened Jan/Feb 2014 timeframe.
Before the price started down.
http://thehill.com/policy/energy-environment/282005-utility-to-close-2-nuclear-plants-in-illinois
I suppose there is plenty of gas to supply base load power for as long or longer than the remaining planned life of these two nukes.
Maybe it will be possible to use the sites for gas fired plants, since so much infrastructure is already in place.
There’s usually plenty of room available on a nuke site, and the containment building and spent fuel storage areas are not that big at all.
OFM,
What amazes me about nuclear power plants, is that the expensive parts of the operation is building, and decommissioning the plant. The actual running of the plant is suppose to have very low marginal cost, and during this, time the operating company was suppose to collect enough money to pay for construction, and decommissioning.
As the 40 year original licences approached retirement, and the operating companies had not saved enough money to cover decommissioning, they applied for 20 year extensions to their licence, to allow more time to fill their piggy banks. This 20 year extension was suppose to be all gravy, and yet now we hear that numerous nukes are closing down because they can’t operate profitable during their cheapest time of operation.
This doesn’t make a lot of sense to me, unless, to continue operation, the planned retired nukes require some major capex to keep them going. If this is the case, I suspect the operators probably don’t want to go into too much detail, as the only things I see that they would be forced to spend large sums of money on will be for the safety of the plant, and I am sure from the operators point of view, the less talk of Nuke safety the better.
You have to understand that the nuclear power itself is just too cheap to meter. However, paying for keeping the meters running, is a whole nuther can of worms… /sarc 😉
“I suspect the operators probably don’t want to go into too much detail, as the only things I see that they would be forced to spend large sums of money on will be for the safety of the plant, ”
Yes, they don’t want to make the plants safe. Decades of radiation exposure, high heat exposure, hydrogen exposure, etc. has damaged pretty much every part of the older nuclear power plants and they don’t want to repair them. The GE Mark I designs were particularly unsafe to start with; the Westinghouse ice condenser designs are even *less* safe; and nobody wants to retrofit them, either.
But the fact is that even while disregarding safety, they aren’t profitable. Part of this is that the process of converting raw uranium ore into power plant fuel and transporting it to the power plants is really expensive. For a while they were coasting on decommissioned nuclear weapons, but that supply dried up when the US and Russia stopped cooperating on nuclear arms reduction. Part of this is the cost of cooling the nuclear waste which comes out of the plant; it has to be cooled for ten years before they can even put it in a cask.
But the main part is that nuclear power plants require lots and lots of employees to monitor the operation. Solar panels and wind turbines are foolproof and require zero employees, while gas turbines are pretty close to foolproof and can be operated by one man.
It is pretty startling news- from reuters
http://in.reuters.com/article/usa-nuclear-exelon-idINL1N18U1L6
“Nuclear operators have shut five reactors since 2013 and have threatened to close several more primarily because U.S. power prices have collapsed to decade lows due to low gas prices, making it uneconomic to keep running or make needed repairs to the nuclear units.
Exelon said Clinton will close on June 1, 2017, and Quad Cities will close on June 1, 2018. Quad Cities and Clinton have lost a combined $800 million in the past seven years, despite being two of Exelon’s best-performing plants, the company added.
Exelon was hoping the Illinois Legislature would adopt legislation, known as the Next Generation Energy Plan, that would compensate nuclear reactors for the reliability, environmental and economic benefits they provide like round-the-clock power with no carbon emissions, and jobs and taxes for the local communities.”
Exelon was actually hoping that the bankrupt state of Ill. would come up with operating subsidies.
Got to say it surprises me.
The last nuc plant to be decommissioned (San Onofre) is estimated to cost ratepayers $4.4 Billion Bucs!
Religion plays about a big a role in environmentalism as it does in a backwoods Baptist church, and I say that as a person who has had PLENTY of contact for over half a century with environmentalists and GREW UP in such a church.
I have worked in nukes , and talked to more than a couple of engineers on nuclear jobs, and the decommissioning process is driven by environmental religion rather than good sense.
Sometimes a society goes entirely overboard on certain issues, for political reasons, with one side or the other getting the political upper hand and proceeding to impose ridiculous requirements on their opponents.We aren’t lacking in long term spent fuel storage because it can’t be done, but because environmentalists don’t WANT it done.
I have heard cynical anti capital punishment advocates say we should abandon capital punishment types say many times that we should abandon capital punishment because it COSTS TOO MUCH. Well, it does, but that’s THEIR fault. They make sure that each and every case takes decades to wind its way thru the courts. ( Personally I am against capital punishment except in cases where there is unquestionable unmistakeable physical evidence for the prosecution .)
The religious nut cases who insist on a clean up orders of magnitudes greater than is actually worth doing are in control when it comes to decommissioning a nuke.
If any body fails to understand this, they should stop to consider the costs of burning coal continiously,and what THAT Is doing to the environment NOW, and the consequences it will continue to have on the environment for thousands of years to come, given that a runaway greenhouse is baked in.
Perfection is for fools and political types who can and do use it for political ends.
Not one environmentalist out of every hundred I have encountered has a good grasp of the realities of using fertilizers and pesticides in comparison to doing without out.
There are VERY real dangers associated with nukes, namely weapons proliferation, and meltdowns.If it weren’t for UNREASONED opposition to nuclear power, the odds are pretty damned good we would have nukes by now built in such a way that they do not contribute to weapons problems, and incapable of melting down.
Decommissioning ought to cost a minor fraction of what it does because perfection is not worth pursuit. We are not under ANY CIRCUMSTANCES going to ever quit doing things that are dangerous to the biosphere thousands of years down the road, and a hell of a lot of these things are going to cause far worse problems than a nuke with the fuel removed, and poured full of concrete would ever cause. Sure there would eventually be a trickle of leakage. Sure there would also be a steady drop off in the radiation levels inside the tomb.
THIS COMMENT is party cynicism, partly sarcasm, partly just being in a bad mood, and partly simple TRUTH. LOL.
Geez OFM, do you think you would still have that attitude if the nuke plant was in your county? Or, is it okay if the cleanup is so-so when it’s in another state?
There is no safe way to handle spent nuclear fuel. Probably the best approach was at La Hague, but it still emitted unacceptable levels of toxins into the environment.
The “salt cavern” approach has pretty much been proven to be a mistake. Scotland finally decided to put its residual waste in a building on the surface where they could keep track of it, and they’re almost certainly correct. They’ve also decided to stop generating more.
Decommissioning can be done properly; there is one example in Massachusetts, I believe. It’s relatively straightforward *if* the nuclear power plant hasn’t suffered leaks during operation. Unfortunately, most of them HAVE suffered nasty toxic leaks during operation, due to extremely low standards in the past, and that increases the cost of decommissioning massively — as you would expect.
Most of the nuclear power operators are trying to avoid decommissiong at all by abusing the “SAFSTOR” scheme, which is a “don’t do your job” option invented by the NRC to subsidize the nuclear power operators.
Interesting trends in transportation fuel demand:
OPEC’s Cheap Oil Strategy Lures Drivers Back Into Gas Guzzlers
http://www.bloomberg.com/news/articles/2016-05-30/opec-s-cheap-oil-strategy-lures-drivers-back-into-gas-guzzlers
• Decade-long improvement in fuel efficiency in U.S. seen ending
• Light trucks, vans, SUVs account for 60% of U.S. vehicle sales
Last year, SUVs outsold any other type of passenger vehicle in Europe for the first time, according to auto industry consultants JATO Dynamics. The trend has continued in 2016, with demand for SUVs … accounting for a quarter of sales in the biggest European countries.
Europe is a mirror of what’s happening across the world. From China to the U.S., drivers are buying bigger vehicles, while sales of fuel-efficient hybrids struggle.
[In the U.S.] the average car sold in April achieved a fuel economy of 25.2 miles per gallon, down from a peak of 25.8 set in August 2014, just before oil prices crashed, according to data from the Transportation Research Institute at the University of Michigan. At current trends, this year will mark the first drop in average U.S. fuel economy since at least 2007, the data show.
“Fuel-economy improvement is really flatlining,” said Sam Ori, executive director of theEnergy Policy Institute at the University of Chicago. “The gains completely stopped right at the same time that oil prices started to decline.”
Today in the U.S., light trucks, vans and SUVs account for 60 percent of total vehicle sales — a level only reached briefly in 2005, when Brent crude, the global oil benchmark, averaged $55 a barrel. It’s now around $50. The International Energy Agency said in May that less-efficient vehicles, including four-wheel drives, “remain very much in vogue, a consequence of persistently lower retail pump prices.”
In 2008, when oil prices averaged $100 a barrel, the share of gas guzzlers in U.S. total vehicles sales dropped at one point to just 43 percent.
With larger vehicles hitting the roads and Americans driving longer distances as the economy recovers, U.S. gasoline consumption is set to rise to a record in 2016, according to the Energy Information Administration. U.S. gasoline demand will average 9.3 million barrels a day this year, surpassing the peak set in 2007, the EIA said in its most recent monthly report.
The EIA forecast U.S. drivers will enjoy the cheapest gasoline this driving season in 12 years.
In China, the world’s second-biggest oil consumer, drivers are also opting for larger vehicles as never before. While cheaper gasoline and diesel helps, analysts said it’s higher incomes — and a desire to impress relatives and friends — that’s driving the purchases. According to official data, vehicles such as light trucks and SUVs accounted for almost 35 percent of total Chinese passenger sales in April, up from 10 percent in 2010 and less than 5 percent a decade ago.
U.S. average sales-weighted fuel-economy rating
chart 2
You are right AlexS, Americans need to be more frugal and forward thinking.
My town wants to allow a gas station to be put in near the highway, there is a gas station a short drive away. Not only will the gas station be mere feet from a Category 1 trout stream, it will be almost at the level of the stream. The three large tanks will be actually buried in the aquifer for the town and have to be held down from floating. Everything runs off wells here, so contamination will effect much of the town and wreck the aquifer.
To top it all off, the land is now a ride-sharing lot, something that reduces fuel use and pollution as well as reduces the wear and tear on cars (slowing down the need for vehicle replacement and all the energy/pollution that involves).
There are gas stations just a few miles in either direction along the highway.
Sound dumb to you?
yup
That sounds extremely dumb. What stupid town are you in? I don’t think anyone would tolerate this in upstate NY; we get very paranoid about our aquifers here.
I live in a rural community. Mostly woods and farmland. Town itself is only about 6 blocks long but the township is about 8 miles across.
Many of the people are somewhat ecologically aware, which is why a grassroots opposition has formed.
However, the boards are populated with local businessmen and contractors. The couple of contractors I know in the area are the most ethically bankrupt people I have met. So we have the minority running the majority.
I think the market share argument was always a smoke screen and this was always the Saudi’s real intent.
ALex.
Strangely enough fuel consumption for new had a little up tick last month. Not sure if it is due to the slightly rising price of fuel as mentioned in the article, or just more fuel efficient models becoming available.
http://www.greencarcongress.com/2016/06/20160603-sivak.html
UMTRI: average new vehicle fuel economy in US in May up 0.2 mpg from April
US Weekly Petroleum Status Report has US C+C production down 32,000 bpd for the last full week in May to 8,735,000 bpd. No surprises here, this is exactly what I had predicted. US lower 48 production was down 40,000 bpd for the week, Alaska was up 8,000 bpd.
This is important people, US crude oil production is now in full scale retreat.
If you doubt these doubt these falling production numbers then explain the climbing net import numbers. US weekly net petroleum products imports, 3 month average and 6 month average reached a two year high this week.
When production is falling, and consumption is not falling, then the only solution is import more, a lot more.
We are importing, on average, almost one million barrels per day more than we were just last November.
Thanks Ron, good point.
Adding to what you said, U.S. stocks of crude oil and petroleum products apparently stopped to increase.
Weekly U.S. Ending Stocks of Crude Oil and Petroleum Products:
change vs. same period of previous year (million barrels)
… although they are still well above 5-year average
In general the weekly numbers are related to each other. None are very good.
How come that only adds to 14.2 (production plus imports).
Hey, that’s about right. You were perhaps thinking about US total consumption which which is total refined products, which includes process gain, and NGLs.
That looks like 500,000 bbl/day decrease in 5 months. Wow.
We could be looking at 1M bbl/day decrease over 2016.
Yea, monster trucks everywhere, hate to tell you boys I am the kind of guy that says “told you so”.
AlexS on another note, I updated the production from my oldest well in the Woodford SCOOP, won’t say the operator but the well was put on production in August 2012, was a single unit lateral (4500′) in the down dip part of wet gas zone. The well has produced 5.05BCFG + 45283BO + 232,894BNGL. This well will be one of 10 in the unit, the wood ford is 350′ thick in this area. There has been no decline in production in the last 14 months averaging 2MMCFGD +10 BOPD and 87BNGLPD. My take away is this, the Woodford is much better economically then the Barnett or Haynesville. I can not say yet how the oil window production will hold up, but we will know more in a year or so. But the presentations of MRO and CLR in the area are backed up by real production and are not “all” smoke and mirrors.
Texas tea. There are 23 Woodford hz wells that have produced 4.5 million or more mcf.
Only one produced oil in the most recently reported month, and just produced 173 BO.
I think I found your well. TD 18,800′?
Some very prolific gas wells. Shouldn’t IP, etc be reported in mcfe? Why BOE for Woodford?
Newfield has seven of the 23. Marathon and CLR each have one. Kaiser Francis, BP and XTO have more than one each.
Ss, my experience is the IP are a “managed number” irrespective of how they are presented. I have seen some companies play down the IP and others “promote” them. Depending on what day or hour for that mater during the flowback period you can get a number with a great variance. I am guessing, not approving per say, it may be the Operators are trying to account for /promote the NGL part of the production by using BOE which does have a important economic component. Just a guess.
SS from investopedia
This term is used frequently when exploration and production companies are reporting the amount of reserves they may have. By giving a BOE figure, analysts, investors and management can assess the total amount of energy the firm has access to, without breaking it down into barrel’s of crude oil, or the cubic feet of natural gas.
A barrel of oil equivalent (BOE) is a term used to summarize the amount of energy that is equivalent to the amount of energy found in a barrel of crude oil. There are 42 gallons (approximately 159 liters) in one barrel of oil, which will contain approximately 5.8 million British Thermal Units (MBtus) or 1,700 kilowatt hours (kWh).
Texas tea.
Don’t you think they are using BOE and reporting the % of oil at IP is misleading when they know that Woodford wells stop producing oil after a year or two?
It wouldn’t be such a big deal if gas was $8 per mcf. $8 x 6 = $48. WTI currently $48.
Surely you understand my point.
And to call Woodford the South Central Oklahoma OIL Province? Why?
SS, I get your point. When I first saw BOE being reported I had to look it up. But again, if IPs of nat gas production was is reported in only MCFPD, how would you distinguish the difference in value between 1000BTU nat gas and 1350BTU nat gas. As a investor and has a promoter I would want to know the value of the product in comparison to other projects. I think you also understand it not just to make the well look better then they actually are, it actually conveys the difference in value. Also when reporting on oil you normally see the BOPD but also the API gravity of the oil, this also conveys the difference in the economic value compared to other oil.
http://www.cnbc.com/2016/06/02/jamie-dimon-just-sounded-the-alarm-on-auto-loans.html
Jamie Dimon just sounded the alarm on auto loans.
“Someone is going to get hurt”
Yeehaww…I just bought a new monster 4X4 for $2000 and I’m sending the rest of the bill to Saudi Arabia.
Go into debt too you mother XXXXers.
Natgas jumped 15% over the last few days. In my view, a new cycle starts due to record low drilling (red line in below chart) reaching all time lows and all time low decline rates for drilling of over -60%. See right lower corner in below chart.
Natgas price has room to soar over at least the next half year depending on how fast drilling will resume. As drilling productivity for natgas increased tenfold over the last decade, just a little bit more than 80 drilling rigs maintain a production of roughly 70 bcf/d. There has been a significant change in the natgas market as two thirds of the production consists of fast declining wells. We have not yet seen a shale gas decline – so far we have seen only a shale gas production rise. It will be very interesting how this will play out.
I’m expecting natgas prices to go up, but I am scratching my head about how *far* they’ll go up. I think they’re capped somewhere between $4.50 and $6.50 by electrical generation switching to renewables.
Nathanael,
Although wind and solar replace coal in electricity generation, they actually create demand for natgas. Natgas has to jump in when solar and wind generation is low.
This is exactly my point for the high leverage of natgas this summer. It will be a show case what happens in the energy market when wind and solar gain market share.
My view is supported by the actual numbers. Year to date natgas (+ 19.000 GWh year to date) has grown much faster than wind and solar (+ 16.000 GWh year to date). Coal has lost 40.000 GWh market share year to date.
Please check out the numbers at:
http://www.eia.gov/electricity/monthly/epm_table_grapher.cfm?t=epmt_1_1
When you are buying fuel for trucks to haul tulips all around the Netherlands, you know there is plenty of oil. It’s tulip mania in Holland.
http://www.reuters.com/article/canadianwestern-results-idUSL8N18T62V
Canadian Western Bank reported a 37 percent decline in second-quarter profit reflecting a ramp up in funds set aside to cover loans to oil & gas companies that have turned sour.
You sell the sizzle, not the steak. Always.
The panic is over, everybody lost their shirts.
I have another update on shale oil production in the US, here.
Heinrich,
Straight from your favourite source.
http://www.bentekenergy.com/
Southeast production dips on recent flooding
Thursday, June 02, 2016 – 5:55 AM
Heavy rains and flooding struck the Southeast and Texas again, driving down production significantly in the Anadarko and Haynesville basins, and providing some uplift for gas prices. Henry Hub jumped $0.32 on Tuesday and another $0.16 on Wednesday. Sample receipts in Haynesville were down 243 MMcf/d from Monday to Tuesday, and are down another 80 MMcf/d today. The biggest drops were seen at gathering systems on ETC Tiger, which saw receipts fall 44 MMcf/d on Tuesday and 20 MMcf/d today. Also, Gulf South has fallen by 30 MMcf/d since Tuesday. The biggest driver was a decrease in receipts from production points, accounting for 28 MMcf/d of the decline, while the rest came mostly from processing plants. SONAT also saw a large drop in production, down 58 MMcf/d since Tuesday. Production from the Anadarko dropped by 110 MMcf/d on Tuesday before rebounding and gaining 41 MMcf/d today. Severe weather is expected to continue across the region, which could lead to further declines and continued upward pressure on prices.
I think a rainfall chart maybe more relevant at the moment.
Toolpush,
Weather is always a factor, yet it is just a minor factor at max 1 bcf/d. From March to May the decline is at least 3bcf/d – and this was before the Texan rainfall.
Nevertheless, the main factor is now a big structural change how natgas is produced in the US. A decade ago, natgas decline rates were not higher than 5% per year, now they can be as high as 50%. So far there has never been the case for a drop of a total production drop of up to 20% in a year (except for a short period of production declines due to hurricanes in the golf region), but now this scenario is real.
The deep paradigm shift of natgas production is the nature of producing wells: according to my data one shale gas rig can generate in one year production of roughly 1000 bcf (1 bcf/d over three years). A conventional rig can also generate 1000 bcf in one year, yet at a rate of 0.1bcf/d over a time span of 30 years. So, drilling productivity stayed the same, yet with shale it is possible to generate production 10 faster, yet decline is also ten times faster.
In other words, market participants think, it is possible to generate ten times higher production with the same rig count, yet have not realized that this production will last just 3 years, instead of so far 30 years. The consequence is much higher volatility in natgas production. So far we have experienced this volatility just on the upside and not yet on the downside, which will in my opinion materialize quite soon.
The total market (2/3 shale and 1/3 conventional) has a legacy decline of close to 20 bcf/d, which means that the industry has to drill 20 bcf/d every year just to keep production even. Just to show the perspective: Norwegian production stands at 20bcf/d and it took Norway decades to build up this production level. So, the Red Qeen has to run extremely fast to stay at the same place. This is a hard task when prices are as low as it is the case now.
In any case the train has left the station and natgas prices will shoot higher over the next six months. If the model I have described above really works, prices will go up to an extreme level.
this maybe the chart you boys watching nat gas should pay attention to
http://www.eia.gov/naturalgas/weekly/img/20160602_itn1.png
texas tea,
Besides other factors this is an important contributor for a natgas hike. In my view, we could have for the first time a stock withdrawal during the summer. So far, gas injections are 50 bcf/week lower than last year .
It is not only due to the retirement of coal plants, but also due to the increase of wind and solar capacity which requires increased back up capacity from gas. Renewables cannot exist without fossil fuels – at least in the mid term.
Heinrich, I’m quite sure we’ll see a spike in natgas prices, but I’m not sure why you specifically predict six months. Given the “extend and pretend” actions by the shale gas drillers, where drilling didn’t really get cut back until a few months ago, I was figuring we’d have another year before we see the spike.
Nathanael,
– It takes at least six months until production can rise when prices recover and drilling resumes.
– Natgas prices have a tendency to go up seasonally during the summer until end of March.
– The system of year over year % changes has in my view a huge predictive power. As prices rose during the latest weeks year over year, prices will will very likely not go down again – for whatever reason.
There is still a risk of how many uncompleted wells are really ready to enter production. In my opinion no forecast is for 100% sure.
Mr. Leopold
Addressing your comment re uncompleted wells entering production …
I have been closely monitoring the expanding productive footprint of the Utica in Pennsylvania and West Virginia.
In looking at the latest (March, 2016) figures, Shell’s Utica well on the Synnestvedt pad in Tioga county has now produced 3 1/2 Bcf in 473 days online.
Of more significance, however, are the two other wells on this pad, one targeting the Marcellus, the other the shallower Burket.
Both of these two wells were drilled and fractured in March, 2012 … four years ago.
Both were turned in line this past January and, with intermittent production, have produced near half billion (400 MMcf) in 112 total production days.
So …
There are a few thousand (supposedly) wells in Pennsylvania alone (a more reliable 500 in Ohio) that are in some state of readiness to produce gas.
Seems like that may impact projections for output, no?
Not with only 35 rigs in the Utica/Marcellus.
And not at current prices they are getting.
The excuse for the DUC’s used to be that there was a backlog of wells. Not enough crews/HHP around to complete them. Now it is because what? Price? It certainly was not due to lack of HHP. These wells should have been completed as the rig count moved down and the bottleneck went away. Just my opinion, but if I was a shareholder I would have serious questions for any company that drilled a well and did not complete it. A ridiculous waste of money.
The rig count is now so far below what is needed, that I do not think these DUC’s will matter when the price does rebound. And costs are going to skyrocket when price gets high enough because there is no longer a surplus of HHP, manpower and rigs. The HHP and rigs are being cannibalized and the manpower is walking away, some of which will never return.
They are not going to be able to just flip a switch and bring on 5 BCF/day. Add in the conventional production in terminal decline, the rapid depletion of HZ shale wells, the decline in associated gas with the fall in oil prices and the increase gas demand for power generation and you will see a volatile commodity.
Mr. High tower
As of last week, there were 7,495 unconventional producing wells in Pennsylvania.
There were an additional 2,327 categorized as drilled or under development.
The ‘under development’ description is both crucial and somewhat exasperating as this ties in directly with HBP clauses in leasing contracts.
The Commonwealth of Pennsylvania makes it VERY clear that leasing contracts are PRIVATE arrangements subject both to state law and regulatory influence.
Bottom line, many of the leased parcels are protected by the operators simply by undertaking some stage of well development short of actual production.
Definition from PA DEP site of a developed well …
“Drilling operations are considered to begin when any equipment and/or chemicals are brought onto the well site that will be used for any phase of drilling, casing or cementing of the well”.
Many of these Appalachian Basin operators currently have 50%/65% of their leased acreage HBP despite 60 month time frames for primary leasing.
Coffeguyz
I’ve bought leases in 4 different states. They all have the common clause that production is the only thing that can maintain production beyond the primary term with the exception of operations but this is usually limited to a set time. I’ve seen anywhere between 60 and 180 days. This is called continuous operations. Holding acreage through a DUC beyond the primary term is not gonna happen. At least in Texas, MS, ARK, LA and Oklahoma. My guess is Ohio and Pennsylvania are the same.
They are not banking on DUC’s to hold acreage
Mr. High tower
As it turns out, there are several options operators have to extend lease holding past the primary term in the absence of production.
I had delved into this eye glazing world of leasing awhile back when so much of the Appalachian Basin activity seemed to make little sense.
Through delayed rentals, commencing operations, mere ‘discovery’ of hydrocarbons, lack of ‘marketability’ (ska takeaway lines for gas), operators can legally honor terms of leasing contracts beyond the initial, primary term (normally 5 years in PA/OH), by invoking one of these aspects in the contract.
From the little I’ve seen, in PA, operators can ‘develop’ well sites, or ‘commence operations’ to hold the acreage.
However, rental payments seem to be paid out to continue to maintain the contract in lieu of production if, in fact, no actual production has occurred.
It is a labyrinthine, legal arena when things don’t go as they ‘oughtta’.
Heinrich,
FYI
http://www.eia.gov/naturalgas/archive/withdrawalsng.pdf
Withdrawals from Working Natural Gas Stocks During Summer 2006
Weekly working natural gas stocks posted net declines of 7 and 12 billion cubic feet
(Bcf) during the weeks ending July 21, 2006, and August 4, 2006. Working natural gas
stocks tend to increase during the non-heating, or refill, season months (April-October),
with weekly net injections averaging between 60 and roughly 100 Bcf from late April to
mid-October (Figure 1). These withdrawals marked the first two times that working
natural gas stocks experienced a weekly net decline during the months of May through
September. Historically, the absence of net withdrawals in the Lower-48 States has also
persisted through October. In fact, only once in the 12-year history covered in the Energy
Information Administration (EIA) Weekly Natural Gas Storage Estimates Database has a
weekly withdrawal been recorded in October, which was a 3-Bcf withdrawal on October
31, 1997.
So there has been a summer time withdraw before ie, 2006. Also current gas storage is around 2.9 tcf, max storage is about 4 tcf, divided by 22 weeks of remaining fill season. That means 45 bcf /week will mean the storage will be totally full. No where else to put gas except on a saturated Nat Gas market. There is a reason this year injection is 50 bcf per week than last year. That is because storage was nearly full before the injection season started.
Now, what happens after the effects of the 2016-17 winter sets in with production having wound down. That is an open question! What price will Nat Gas have to get to encourage new development, especially in the light of the tighter money situation?
The 2017 fill season will be something interesting to watch.
Toolpush,
On the surface it looks like the natgas price cannot rise as there is simply too much inventory.
However, the price action reveals something as prices rose over 50% over the last three months – and this in the shoulder season and at record high inventories. In theory this should not happen.
So, something is going on. And in my view it is big. It could be that the future market is slowly going into backwardation and future prices are at record low and companies cannot lock in high prices. It is actually very dangerous for companies to sell forward as the risk for higher prices is real and companies could be stuck with low hedging prices.
It could be also the switch to more renewables which will jump start natgas demand over the next years. The switch to renewables (‘Energiewende’) has been quite disruptive in Germany and it was just luck that Germany is surrounded by the Alps (plenty of pumping storage) and plenty of nuclear capacity in France.
This is not the case in the US and the switch to renewables will be quite disruptive in the US.
It could be also the change of natgas production structure as I have outlined in my previous post – or a mix of all above. We will find out in a few months.
Oil Price Poised For A Boost From A Big Fall In U.S. Production
U.S. oil production has entered the end game with output forecast to plummet as drilling dries up and banks foreclose on oil companies teetering on the brink of insolvency.
Long predicted as a natural development after the 2014 start of the collapse in the oil price the inevitable has been delayed by drillers squeezing every drop out of their wells but that game is all but over.
From a peak of more than 9.5 million barrels a day early last year current output has slipped to 9.1mb/d but if a fresh forecast is correct the number could be 8.5mb/d by July and possibly below 8mb/d in the September quarter…
Saudi Smiles
The Saudi view has consistently been that the oil market will fix itself with low prices forcing high cost producers out of business, leading to a sustainable price recovery.
What the ANZ has done with its report released earlier today is reinforce the Saudi position with the headline telling the story: “Declines in U.S. oil output set to accelerate”.
And here is that story: Declines in US oil set to accelerate
London, 2 June 2016
A lack of drilling is about to catch up to US oil output. To maintain current production levels in the US requires 439 rigs, compared to the 280 in operation, according to ANZ Research. “If that trend persists, we could see production fall below 8.5mb/d by July,” comments Daniel Hynes, commodity researach analyst.
“Financial stress could exacerbate this. Oil producers with sub investment grade debt maturing this year produced approximately 1.3mb/d of oil. We have also seen more downgrades of credit ratings in 2016 than over the past three years.
“This should see oil prices remain well supported over the next six months.”
It has always seemed perfectly obvious to me that the price would HAVE to go back up, and it has , quite a bit already.
The thing that surprised me is that it has taken as long as it has for the high cost producers to start falling by the wayside. In other industries, the blood would have been in the water MUCH quicker.
Does anybody have a figure for the “typical or average ” cost of storing crude per barrel per year? How has the price of storage varied for the last couple of years?
Ron et al.,
Maybe this fits here:
US exports of crude oil hit 591 000 barrels/day in April, according to foreign-trade data from the US Census bureau (that’s where the EIA gets its monthly data.) Highest on record since at least 1920.
The article is at Rigzone.
What counts are Weekly U.S. Net Imports of Crude Oil and Petroleum Products. You have exports and imports. The net is total imports minus total exports.
Ron,
Me, I was just thinking about a nation with declining oil production setting an oil-exporting record.
Quelle naive!
U.S. is exporting light crude and condensate, importing heavy and medium crudes
Alex,
I would have said the same thing as you did, before I read this.
http://www.downstreamtoday.com/news/article.aspx?a_id=52411
Sinopec Says Began Processing First U.S. Crude Oil at End-May
Sinopec’s Maoming refinery in southern China received a shipment of 42,000 tonnes U.S. high sulphur crude blend in early May and is expected to receive a second shipment of 130,000 tonnes on June 20, the statement said.
Of course I am assuming that “high sulphur crude blend” is a Canadian bitumen/US condensate blend, but I could be wrong.
LNG shipper under financial pressure
Golar LNG, the company which secured a two-year contract to ship liquefied natural gas (LNG) to Jamaica, posted huge net losses, has a working capital deficit and its chief executive officer resigned last month.
The shipping company continues to suffer from a slowdown of the LNG industry during a global oil price drop, symptomised by almost US$700 million of negative working capital.
The Jamaica contract is a bright spot for the company amid declining revenue..[snip]
New Fortress, an American company, is contracted by Jamaica Public Service Company to supply LNG to its Bogue plant. The pipeline and terminal have been developed but delivery of the gas, which should have started in April, has been pushed back to August.
On Wednesday, New Fortress promised responses on the implications of Golar’s finances for its contract, but had not followed through up to press time.
This raise a question which I may have asked before but if so, bears being asked again. In a situation where a utility or country has a fuel supply contract with a supplier at a particular price, what happens to that contract if the supplier goes bankrupt and ceases to exist. I think I have opined here before that such contracts are only as good as the health of the parties to the contract. What will happen to the contract with Jamaica if NG prices recover but New Fortress has committed to long term supply contracts at prices significantly below the higher prevailing NG prices?
I don’t know the answer to this question to be sure, but it is common for businesses large and small to have to post bonds to guarantee their performing as contracted.
So – if bonds are used, the next question becomes, what if a lot of companies go broke, and the folks who supply the bonds go broke too?
Island Boy,
I was of the understanding that Jamaca was going to be getting its LNG in 40″ ISO containers, rather than dedicated LNG bulk ships? But I see they move away from that idea, Aand gone for ship to ship transfers.
http://jamaica-gleaner.com/article/business/20160304/new-fortress-secures-lng-ship-jamaica-project
As contract prices. I believe most if not all the LNG export contracts are based on Henry Hub +15% +$3 for liquidizing + transport. So for price increases, just keep an eye on HH.
Golar are just transporting the LNG, and would be relatively easy to replace, though the specialized ship to ship transfer equipment would need to be installed on any new ships to the charter.
Originally there was talk of using 40″ ISO containers. There would not have been an issue with shipping companies in that case. Any container ship could have carried them.
“In a situation where a utility or country has a fuel supply contract with a supplier at a particular price, what happens to that contract if the supplier goes bankrupt and ceases to exist.”
Bankruptcy court decides what happens.
Discussion of this link should go over to the last open thread, I am posting it there too, but I doubt if many readers are still checking that thread.
https://www.washingtonpost.com/news/capital-weather-gang/wp/2016/06/02/save-the-climate-and-protect-america-build-an-underground-energy-interstate-now/
The Baker Hughes Rig Counr is out. Oil rig count up 9, gas rig count down 5.
Well, the oil price jumps and drops, at mere shadows, or just journalist are just searching for a headline.
I seem to remember the same thing happening last year, at this time.
http://www.downstreamtoday.com/news/article.aspx?a_id=52408
Oil Slides on US Rig Count Rise, Economy Concerns
Petro-Canada gas pumps run dry at stations across the West
Parent company Suncor says outage at Edmonton refinery partly to blame
CBC News Posted: Jun 03, 2016 7:44 AM MT
Can Canada Expand Oil and Gas Production, Build Pipelines and Keep Its Climate Change Commitments?
Report Authour: David Hughes
Report for Corporate Mapping Project led by University of Victoria, Canadian Centre for Policy Alternatives and the Parkland Institute, June 2, 2016
Some coverage of the report.
New Report Knocks Down Pro-Pipelines ‘Fantasies’
The economic case is a bust and emissions will shatter limits: expert.
By Andrew Nikiforuk, Yesterday, TheTyee.ca
Oilsands growth makes it nearly impossible for Canada to meet Paris Agreement targets: report
Petroleum industry disputes assumptions in report, which also says no new pipeline capacity is needed
By Robson Fletcher, CBC News Posted: Jun 02, 2016 3:25 PM MT
Good Evening aws.,
I believe I can say with certainty that those climate change commitments, targets, agreements, and whatever other terms they are going under ultimately won’t be followed anyway, but definitely NOT for any of the reasons described in those articles pushed by the propagandists in the mainstream media.
No, instead once the abrupt global cooling the respected astrometeorologists have predicted for the post-2017 time frame gets underway in earnest due to the potent current El Nino cycle breaking down in the middle of a long-term trend of repressed sunspot activity, all of the apparently diplomatic work undertaken by those benevolent bureaucrats over at the UN to get humanity to save itself from itself WILL BE flushed straight down the drain, as the majority of the public will rightly view the actions as completely farcical.
Furthermore I would like to point out a most insightful exercise anyone with internet access can perform is to play a game of “connect the dots” as to the actual motives behind most of these commitments/agreements in the first place. Particularly, one must read up on the UN’s plan for sustainability (which itself is a loaded word) known as Agenda 21 as well as the work of fellow Canadian Maurice Strong during his tenure as a high-ranking official within the UN. I GUARANTEE the outcome of this endeavor WILL open your eyes in ways you never could have imagined.
Be well,
Walt
*** wingnut alert ***
Or it was sarcasm?
But, one thing is for sure, everytime there is a cold weather event, or a Rossby wave pushes a new cold regime into northern Texas and CNN trots out the ‘Polar Vortex’ disaster coverage, all the deniers will say, “See? Global Warming, what a bunch of …….”
My good friend and neighbour makes several comments like this all winter. Fortunately, in my 60s I have wised up to the fact that my friendship is more important than arguing with him. I just plow his driveway for him.
Hi Paulo,
If Walt plowed my drive and the private road it is on, like my neighbour does, I wouldn’t have responded. 🙂
I do wonder how we are going to plow the road in the coming decades. A battery powered skid steer in place of the old Ford truck? It’s a long walk to the house if the road isn’t plowed.
Walt,
I suspect you understand a large portion of the population needs to be told what to think as they lack any degree of critical thinking skills and cannot connect the dots (particularly in the media). They only “know” what they are told by experts, they do not have the skills to question the motives of the experts, they do not have the skills to know that there are many things we do fully understand or to understand that are many things that we do not know that we do not yet know about. They live in a goal seeking echo chamber when it comes to science. It does not bother them in the least when data is falsified, discarded or ignored. They desire being told what to think and find comfort in being associated with like minded fools. Witness a fellow poster Fernando, who i do not know but it is clear he has a trained scientific mind, he is a problem solver, he ask questions but who is routinely hounded on this subject. A scientist who does not ask questions is as useless as tits on a bore hog, a “scientist” and his work that needs government to limit questions, limit research and stifles debate is not a scientist at all and his work is a shame. I believe the global cooling that some predict for the reasons you describe would be a fitting end to this sad period of scientific debate in our country and also dramatically increase the price of nat gas, a two-fer from where I sit:)
just to add from zero hedge
The Equal Sign Can Be A Real Bitch
http://www.zerohedge.com/news/2016-06-04/equal-sign-can-be-real-bitch
Many people shun mathematics, science, and logic, seeking refuge in their antitheses. A good part of human intellectual history has been attempts to either ignore equalities or turn inequalities into equalities. Forgiving, sloppy, delusional illogic is usually collective. Every age has its particular refuges. Our age has rejected the mathematics of debt. What can logically not occur, a perpetual inequality—consumption greater than production— has become the foundation of the global economy. As the tagline for Zero Hedge notes: “On a long enough timeline the survival rate for everyone drops to zero.” In the same vein, on a long enough timeline, consumption equals production. Understand that equality, and the future comes into stark relief.”
Hi Texas tea
No the debt is paid back over time with interest. Let’s say the interest rate is very low. About 2% for long term government debt.
The economy might grow at 4% in nominal terms, in that case the debt plus interest is easily paid.
Did you pay cash for your first home?
Most people need to borrow to buy a home.
There would be very few homes built without debt.
Dennis,
I think we going to have to agree to disagree. Like you I do agree that some debt can be a good thing, and to much debt is a bad thing. I think, as a country, we crossed the “to much debt level” some time back and we are now in the exponential portion of our debt cycle, where we are in that cycle exactly, can be debated to some degree. That we are doubling our total debt in ever shorter periods of time with no end in site, can not be debated. I would agree it does not matter….until all of sudden it does! I sincerely hope that this time is different but I am NOT betting my economic life on it.
Debt denominated in a currency *which you issue* isn’t actually debt. It’s money. It behaves totally differently from debt denominated in a currency which someone else issues.
It’s basically impossible for the federal government to have “too much debt”, because it isn’t really debt. The question is whether there is “too much money”.
There isn’t. If there were too much money, we would have inflation.
proof that folks have a great capacity to ignore history. Much like global climate change a case study on how people have the ability to draw linear lines to goal seek results but ignore how individuals, business both large and small, trading partners, and even our enemies adjust their behavior to our ever increasing use of debt. The amount of debt/money the US/EU/Japan will need to issue in the next 4 decades as baby boomers retire, as the interest on the debt consumes the entire ability to tax, as peak oil and other peak resources are in the review mirror will be staggering. To assume our collective faith in our monetary systems in the future will be the same as in the past is fairly dust thinking. If what you say was true, why is it people must work and why is it our government must tax, they could just issue money to their benevolent citizens. I do not when or which domino will fall first, but after the first one falls they will all come tumbling down.
It really gets old listening to conservatives whine about debt. Until they get real about their endless desire for tax cuts and military spending they just look like fools. The wealthy 10 percent of the Republican party have been lying to their base and creating this problem since at least Reagan with his tax cuts and increased military spending. Followed by “W” tax cuts with more military spending. Now the Donald wants more tax cuts for the rich and who knows what else. He changes day to day.
First of all, if you want a robust economy. Money has to be spent on things that improve peoples lives. That can be done by government or individuals. Cutting spending is only going to make the economy smaller. Second, consumer sediment must be positive. People like Tverberg or Caelan have a negative affect on sediment and the economy. Third, to grow the economy there has to be investment in the future.
LOL
Well, speaking of a negative ‘affect on sediment’…
Just a note that Gail Tverberg recently informed me that she banned ChiefEngineer from her blog. Gail also suggested that the person might be female!
(Which might tie-in with and explain a ban that Ron Patterson previously had to make with regard to a bizarre, if strangely-affectionate, troll against me.)
With regard to the one with the relatively-new-and-sparkly ‘HuntingtonBeach‘ handle…
Who posts periodically in this way about Gail? (And me here, likely for making the claim previously.)
ChiefEngineer? (so to speak)…
“I was over at Gail Tverberg’s the last couple of days under a hand full of different screen names pointing out the ignorance.” ~ ChiefEngineer
“Data mining expert Bing Liu (University of Illinois) estimated that one-third of all consumer reviews on the Internet are fake. According to the New York Times, this has made it hard to tell the difference between ‘popular sentiment’ and ‘manufactured public opinion.’ According to an article in the Journal of Business Ethics, astroturfing threatens the legitimacy of genuine grassroots movements. The authors argued that astroturfing that is ‘purposefully designed to fulfill corporate agendas, manipulate public opinion and harm scientific research represents a serious lapse in ethical conduct.’ A 2011 report found that often paid posters from competing companies are attacking each other in forums and overwhelming regular participants in the process. George Monbiot said persona management software that supports astroturfing, ‘could destroy the Internet as a forum for constructive debate.’… astroturfing… undermines the public’s ability to inform potential customers of sub-standard products or inappropriate business practices…” ~ Wikipedia
…So DentalFloss, HuntingtonBeach and ChiefEngineer– same one? Two words capped and crammed into one?
Let’s see if there’s a change since my comment here.
I am looking forward to your new nickname, BabyCakes. ^u^
Sandy waves and blown kisses,
~ CozyCae
Consumer sentiment is a statistical measurement and economic indicator of the overall health of the economy as determined by consumer opinion. Consumer sentiment takes into account an individual’s feelings toward his or her own current financial health, the health of the economy in the short term and the prospects for longer term economic growth.
The pattern in consumer attitudes has the foremost influence on both the stock and bond markets. Consumer sentiment figure impacts the stock market positively when sentiment is up, and negatively when sentiment is down. The industry that is most affected by consumer sentiment is the retail industry, as their profits are directly affected by consumer spending.
Debt at federal level is not expanding exponentially see
https://en.m.wikipedia.org/wiki/National_debt_of_the_United_States
fairly dust:)
http://www.forbes.com/sites/realspin/2014/01/17/you-think-the-deficit-is-bad-federal-unfunded-liabilities-exceed-127-trillion/#5041c4910d35
Dennis I really enjoy and appreciate your work and I am not going to get in an argument on this subject. You have a unique nack for ignoring certain things. I have read your dialog with Ron as they relate to your trend lies. Ron is of course right, if you want to plot the decline in something, you start at the highest point. Take a river for instance, we are having a bit of flooding down here, when the river crests, you plot the decline from the peak flow, not the day before peak flow. If you plot the decline in production of a field, you start the month or week the production peaked.
If you wish ignore the future obligations in your calculations that is fine, but it is wrong to do so. The current debt and current liabilities of the US federal government have never been higher and are growing at a rate never before seen. Lastly, there is little doubt that the current rate of growth of the reported UD debt (19 trillion) during the recent expansion has slowed, but we are now 8 years into this cycle, perhaps we can agree the next recession will shed a bit more light on the rate of growth.
Dennis, apologies the word trend lies was meant to be trend lines, I did not mean to infer anything, it was a mistake
us debt 3rd 1/4 1992 4 trillion
us debt 3rd 1/4 2005 8 trillion (13 years to double)
us debt 3rd 1/4 2012 16 trillion (7 years to double)
https://research.stlouisfed.org/fred2/graph/?id=GFDEBTN,
Hi Texas Tea,
Are you familiar with a least squares linear regression? The trend line is not done the way I did in elementary school by drawing the best line by eye through a set of data points.
There is a statistical method for doing this, which is what I do, it can be done very easily using a spreadsheet, but I will not try to convince you. See
https://en.wikipedia.org/wiki/Least_squares
Yes debt expanded rapidly during the Global Financial Crisis. It is Debt to GDP that matters. See
https://research.stlouisfed.org/fred2/series/GFDEGDQ188S
and chart below.
” once the abrupt global cooling the respected astrometeorologists have predicted for the post-2017 time frame gets underway in earnest due to the potent current El Nino cycle breaking down”
We’ll see that the next La Nina low temperature will be higher than the last one.
http://www.skepticalscience.com/graphics.php?g=67
As for sunspots, a minimum won’t do much. Instead of temps going up maybe 4 degrees C by the end of the century, they’ll only go up 3.7.
On the effect of a new grand minimum of solar activity on the future climate on Earth
The current exceptionally long minimum of solar activity has led to the suggestion that the Sun might experience a new grand minimum in the next decades, a prolonged period of low activity similar to the Maunder minimum in the late 17th century. The Maunder minimum is connected to the Little Ice Age, a time of markedly lower temperatures, in particular in the Northern hemisphere. Here we use a coupled climate model to explore the effect of a 21st-century grand minimum on future global temperatures, finding a moderate temperature offset of no more than −0.3°C in the year 2100 relative to a scenario with solar activity similar to recent decades. This temperature decrease is much smaller than the warming expected from anthropogenic greenhouse gas emissions by the end of the century.
http://onlinelibrary.wiley.com/doi/10.1029/2010GL042710/abstract
Bear in mind that we’ve already passed the low end of the sensitivity range, and we still have almost 160 ppm of CO2 to go before the pre-industrial level is doubled. CO2 is just over 408 today. Temperatures in Feb were 1.65 degrees above pre-industrial levels.
Good Evening Wharf Rat,
Like I mentioned in my previous message, noted astrometeorologists are much more attuned to earth’s climatological actions than the scientists who have found an easy funding mechanism in the form of public grants and an easy messaging mechanism in the form of unscrupulous media institutions eager to advance certain agendas.
Anyway, as far as delving into the important work presently being done to gain additional understanding into of the astrometeorological underpinnings of climate change, a good place to start is the solarcycle24com message board at http://solarcycle24com.proboards.com/.
Take heed, specifically, of the meticulous work done by member “AstroMet” for the better part of the last decade. I encourage anyone who has an interest in climatology, but no formal education into the matter from a perspective inherently free of the multitude of biases seen in contemporary mainstream science, to read one of his most recent articles: a treatise in the basics of astrometeorology and how they combine to foreshadow a significantly colder planet in the near future.
Here is an excerpt–
Since early in the last decade of the 2000s, we have been in a transition state between climates – that is, from solar-forced global warming to solar-forced global cooling. The Sun and the planets of our solar system are involved as well. So is the barycenter.
The geomagnetic weakening accounts for cooler climates on all the planets of our solar system, and with the Sun nearing its Grand Minimum in solar cycle #25, I have long forecasted a pause in our current Interglacial period which will usher in global cooling beginning in late 2017 and lasting approximately 36 years.
It will have very significant effects for the entire planet and for all inhabitants.
Be well,
Walt
Another wing-nut alert!!!
Probably a “Wing Pawn” alert would be more appropriate?
Wharf Rat,
You are seriously deficient in your respect for gobbledegook.
Shame on you. Why, from my study of Walt Seh’s quote I deduce that my Brunton compass predicts global cooling beginning next year. I shall take precautions immediately. Well, maybe tomorrow. Or Tuesday, Tuesday would be good.
https://www.eia.gov/dnav/pet/hist/LeafHandler.ashx?n=PET&s=MTTIMUSCA1&f=M
Exported oil from Canada totals 120,000,000 barrels per month, 4,000,000 bpd.
Imported oil from Canada included in the net import numbers?
11 cars of crude from the Bakken derailed in Oregon today and caught fire.
There is another nuance here that was discussed before: It looks like EIA does not subtract imported from the USA dilutant in the total volume of oil exports from Canada overstating the total heavy oil production by this amount (double counting).
Raw bitumen must be blended with around 30% of diluent. At the moment Canada uses for diluent about 200,000 to 250,000 bpd of condensate, most of that imported from the United States. Much of it travels from the U.S. Gulf Coast, where supply is abundant so there are significant transportation costs involved.
http://www.reuters.com/article/us-canada-oil-condensate-idUSKBN0EH18420140606
Hi likbez
This might effect net exports, but if done properly it does not.
First and barrel of condensate is exported then it is imported, the net is zero.
It overstates the world total production by the amount of condensate used for dilution, is not it?
In this case EIA adds production numbers from all countries, but it do not take into account that part of Canadian oil and Venezuelan oil was “already produced” and accounted in the USA production stats.
So Dennis your world production figures are fudged 🙂
Hi Likbez,
The production statistics include the oil produced, not the oil shipped.
So no the production statistics may not be overstated.
Canadians are pretty smart, I believe they know how much oil they produce and are not counting the condensate imported to ship the bitumen as “produced oil”.
My guess is that the secondary sources that estimate Venezuelan output also know they should not count imported condensate as oil production.
The calculation is really quite simple, if one counts production by what flows through the pipeline, just deduct the imported condensate used to create the dilbit.
The World numbers are not that accurate so any number reported is no more than a rough guess (+/- 1 Mb/d).
The recent UK production benefited mostly from Golden Eagle ramp up through 2015. Buzzard is by far the largest single producer at about 180,000 bpd. It is due for an extended turn around this year. It also more than doubled it’s water cut over the last six months, so could be coming off plateau quickly (ramp up was through 2007). It will be a contest between it’s decline against new production from Clair Ridge and Glen Lyon and 3 or 4 smaller projects over the next 2 years (about 300,000 bpd combined plateaus). The government prediction is for a gentle decline of about 15% overall to 2021, but if a lot of the smaller producers get shut down in the near term it might be a bit steeper.
Here is an interesting post by Jean Laherrere on GoM and overall US production, apologies if it has been posted before.
http://aspofrance.org/files/JL_2016USoilultimate.pdf
Dennis – you asked at some previous post about discovered, undeveloped reserves. Overall I’d go with Jean Laherrere, he knows more about these things than most and definitely understands the politics behind some government forecasts, looks at things globally and probably still has access to some of the more confidential figures. My less informed view is as follows.
So far about 1350 billion barrels C&C have been produced. Current production is about 28 billion per year excluding extra heavy oil. Recently Rystad indicated mature filed decline rates at 5% per year, if that held through the complete depletion (unlikely but all I have to go on) that would mean another 540 billion, at 3% average decline it would be 900 billion. For 2200 billion total that could mean (say) another 100 billion to find, 50 billion which is developed but offline (in Libya, neutral zone, Abqaiq maybe, Syria etc.) and 150 billion discovered but undeveloped. If there is that amount (or more for higher URR or higher overall decline rates, maybe up to 900 billion by your figures) it must be in OPEC Middle East countries or Russia. A lot of the older undeveloped, mostly heavy oil, reserves elsewhere have been developed recently (e.g. in the North Sea) in response to high oil prices. Similarly deep sea in GoM and offshore Africa and Brazil (see the paper above – there isn’t much left in the GoM and discoveries have dropped to near zero per year). The larger reserves that I know about are complicated and expensive to develop (e.g. Brazil pre salt, Kazakhstan high sulphur) or have some political issues (offshore Nigeria). I don’t think these would total more than 50 billion though.
If the Middle East OPEC countries have significant known undeveloped reserves they don’t act like it – i.e. why develop tight gas fields, or explore deep sea pre-salt, or double or more the number of exploration and in fill wells, or get IOCs to come in and redeveloped existing fields.
Somewhere I read that Saudi assume 75% recovery and develop their fields to deplete 2% of the field per year during plateau phase. That sounds about right for a URR of 250 billion (i.e. assuming they report total recoverable resources, not what is left) but would mean pretty much everything they have is on production with nothing much known but undeveloped. 75% may be high but I think probably achievable for huge onshore fields (not so much for heavy oil offshore like Safinayah; Abqaiq, which may be exhausted by now; or the neutral zone, which sounds like it needs steam flood to recover much more). To me Saudi’s recent posturing is about setting up excuses for post peak declines, without having to admit they don’t have as much oil as they’ve stated. Also Kuwait’s initiative as described in terms of new exploration and debottlenecking existing facilities, not developing known fields.
IHS, Rystad and Wood Mackenzie probably know more, but their past performance at predicting anything makes you wonder (Rystad seems better than the others though).
For extra heavy oil I think the recovery factors are probably overstated and based on the early, and easiest to exploit developments. However this probably doesn’t make much difference as the limiting factor is the surface production facilities, and will be for the next few decades. CAPP predict Canadian oil sands rising to about 3 to 4 mmbpd by 2030, but even this presupposes another two pipelines approved and built and a sustained, high oil price (i.e. above $100, and probably more if natural gas prices start to rise at the same time).
In Venezuela exploiting the extra heavy oil would be difficult even for a stable society. It needs a large amount of oil wells in areas without that great infrastructure (I think around 5 to 10,000 per mmbpd), additional pipelines (I guess piggybacked so the Naphtha diluent can be recycled), and a bunch of new upgraders – one for every new 200 to 300,000 bpd. The existing upgraders aren’t in great shape, a lot of the skilled workforce from these actually left for USA when the industry was nationalised. There is a significant shrinkage (I think 15 to 30%) in the upgraders as they take out carbon to make the oil lighter (compared to hydrocrackers used in places in Canada which add hydrogen from natural gas). They produce highly toxic waste streams of coke, sulphur and heavy metals, which need to be safely stored for ever after (I wonder how that’s going there at the moment). The three phases of the Carabobo development, which was supposed to get to 1.2 mmbpd by 2018 don’t seem to be going anywhere – oil is still being trucked I think, the new upgraders are on permanent hold, the well services companies are pulling out, and the government can’t afford to buy the diluent naphtha. That is a recipe for prolonged decline, not growth to 8 mmbpd, which was once proposed.
Ecuador has ultra heavy oil, discovered and undeveloped, of about 6 billion – but no-one has figured out how to develop it commercially. The upgrader required has really been proved technically. They were working with Ivanhoe on something that looked to me a bit like a CTL system, but Ivanhoe went bust so I don’t think this is going anywhere. Overall anything more than about 5 or 6 mmbpd from extra heavy sources would be stretch over the next 20 to 30 years.
Good round-up George, I think you’ve pretty well nailed it (as usual). Alaska’s dying North Slope fits into your scenario pretty well too
Have you not heard they have discoveted a new shale play on the north slope to save the Alaskan oil industry.:-)
discoveted
Does that mean no one really wants it anymore? 🙂
That’s funny Fred. Maybe you should forget EROIs and apply for work as a comedian.
No it just means smart phones have a c##p keyboard 🙂
Hi Doug and George
Agree that Jean laherrere’s work is great.
In a 2013 work he shows a HL estimate for C+C+XH of 2600 Gb, then decides 2200 Gb is better.
This is in part because he denies that there is any reserve growth.
I think he is incorrect based on US growth of 2P reserves from 1980 to 2005 of 63%.
I agree with his estimate of XH resources of 500 Gb.
Also I tend to go with CAPP estimates for Canada, we will see what there updated estimate is later this month.
There should be their.
http://peakoilbarrel.com/collapse-inevitable/
Daily CO2
June 3, 2016: 408.25 ppm
June 3, 2015: 402.90 ppm
From:
http://data.giss.nasa.gov/modelforce/ghgases/Fig1A.ext.txt
1916 302.0 ppm
Duncan, can you post the link you got those ppm numbers. I’m not contesting them, but want to be aware of that source so I can access it in the future.
At this link: https://www.co2.earth/
Not for June 3, but for April I have 403.45 in 2015 & 407.57 for 2016 which is a 4.12 ppm difference. Comparing April’s numbers for 2014 & 2015 the difference was just 2.12. The average ppm added each year when comparing 2014-2015 & 2015-2016 is 3.12 ppm.
Variations occur month to month, y on y peaking in May each year, but the difference of 4.12 was so high I’d never seen it before and was understandably alarmed. Now you’ve posted a 5.35 ppm difference. That’s a huge difference and we just better hope it’s a random, temporary blip on the ppm radar so to speak. I it could indicate either El Nino is contributing a big increase or GW is beginning to runaway. We better hope it isn’t the latter.
Duncan, follow up; I went back to my source and found a daily ppm amount but it didn’t have any data for 2016. I’ll ck. tomorrow.
This link has a a daily CO2 count from Scrips:
https://www.co2.earth/
Daily CO2
June 5, 2016: 407.51 ppm
June 5, 2015: 402.63 ppm
HI ROn, you forget to add the 100 barrels I have in my backyard, Your graph is not accurate
OK, I’ve got another forecasting attempt here.
For the next few years, as the shale and offshore disappear, the decline rates should be high; much higher than the drop in demand. As a result we should see prices rise. I’m not sure quite how much they’ll rise, because it really depends on how sharp the dropoff in production is thanks to the accelerated decline of these stupid-technology fields.
But then they’ll fall again, and I’m trying to figure out when the fall will happen.
From the last chart I found on this, 66.7% of a typical barrel of oil is converted to gasoline, diesel, and heating oil. By *value* this is more than 66.7% of the barrel. 12.3% is used for jet fuel. Most of the rest is used as byproducts which would probably not be produced independently. Heating oil is a dead technology, so we can assume that the “diesel and heating oil” category is mostly diesel for trucks.
If demand for gasoline & diesel for cars & trucks drops by X%, this should reduce demand for crude oil by slightly less than X%. If I assume that jet fuel also affects demand but that the other byproducts don’t, I would get 84% * X%.
If I assume that gasoline is the sole driver of pricing for oil I can just assume that a drop of X% in gasoline demand means a drop of X% in crude oil demand. I suspect this is fairly close to true, until the demand for gasoline and diesel drops to the point where it isn’t the ‘major product’ of refineries. I would love to know how low it would have to drop for jet fuel kerosene to become the ‘primary product’, which I think will happen within the next couple of decades.
Now, suppose we hold automobile sales constant (which is a fair assumption given current trends). Every electric car sold displaces a gasoline car, and displaces the gasoline sales which that gasoline car would have been associated with. So very roughly, if X cars sold in the world in a given year are electric, and there are Y cars on the road total, X/Y is a percentage which the total gasoline sales are reduced by in the coming year (permanently). It’s a demand-side decline curve!
After the current accelerated decline in oil fields caused by the use of stupid technologies, we should revert to the old decline curves, which were averaging 5%.
To reach this rate of demand decline, we need about 60 million electric cars to be sold worldwide per year (though this isn’t really accurate because of trucks and buses; they’re changing on a different schedule but I figure it’ll end up being roughly the same). The world market is about 74 million electric cars per year, so this is a bit less than “all yearly production”.
How long will that take? Interesting question. China’s moving *very* fast with 42 domestic-made all-electric models on the market *already*. Given other factors — in most major cities you have to go through a licence plate lottery and have driving restrictions for a gasoline car, but not for an electric car — I might guess that all new Chinese cars will be electric or “mostly electric” plugin hybrids by 2020 (I just don’t think they can shift all their car production in less than 4 years). China is 28% of the world market. The US is moving more slowly, but I would expect the US market to be electric or “mostly electric” by 2022. The US is 10% of the world market. Europe will go faster than the US. I find it hard to predict the behavior of the “southern” countries like India and Brazil, but I would expect them to mostly follow China’s lead.
So I’m guessing we hit the point where demand destruction exceeds supply decline somewhere around 2022. Maybe as early as 2020, maybe as late as 2024. That’s when the oil price starts dropping through the floor again.
Any additional oil supply brought online before then is going to *accelerate* the point when demand destruction exceeds supply decline and cause the price to drop faster, so if the oil industry actually engages in substantially more production, the price may crash as early as 2018.
This leads to a major round of bankruptcies throughout the industry. This will take a while to shake out and oil prices will staty low until the companies desparately pumping at a loss have all declared Chapter 7 or the foreign equivalent. The survivors retool their refineries to produce jet fuel as the primary product (very old-fashioned). Once enough wells have been shut in, the oil price can start to rise again on jet fuel demand, but it’s a *much* smaller industry at that point; about 1/6 the size of the current industry, I’d guess.
Let’s suppose demand increases. Then what would your calculation look like? Demand increases and all the “stupid” technologies have to be scaled back up to meet it. Suppose the demand is met and the price of fuels doesn’t get too high and more SUVs keep getting sold. Then what?
“Now, suppose we hold automobile sales constant (which is a fair assumption given current trends).”
Which is a very long assumption
Global new vehicle sales (in million)
Source: International Organization of Motor Vehicle Manufacturers
http://www.oica.net/category/sales-statistics/
Despite sharp growth in electric vehicles sales they still account for less than 1% of total global passenger car sales.
The numbers for EV sales are from this source:
http://insideevs.com/monthly-plug-in-sales-scorecard/
Bloomberg New Energy Finance (BNEF) has a different number of global EV sales in 2015, “when EV sales are estimated to have been 462,000, some 60% up on 2014.”
The BNEF study, published in February, “forecasts that sales of electric vehicles will hit 41 million by 2040, representing 35% of new light duty vehicle sales.”
“The research estimates that the growth of EVs will mean they represent a quarter of the cars on the road by that date, displacing 13 million barrels per day of crude oil but using 2,700TWh of electricity. This would be equivalent to 11% of global electricity demand in 2015.”
http://www.bloomberg.com/features/2016-ev-oil-crisis/
http://about.bnef.com/press-releases/electric-vehicles-to-be-35-of-global-new-car-sales-by-2040/
According to BNEF’s model, electric vehicles could displace oil demand of 2 million barrels a day by 2028.
BUT how much oil will be permanently lost to the market due to depletion of legacy oil fields and falling energy returned on energy invested ?
It takes some oil to get more oil out of the ground. In another decade, the industry itself may consume more than one barrel out of every ten barrels produced, PLUS the gas, coal, hydro, nuclear, wind, and solar energy consumed by the oil industry.
I have said previously that EROEI doesn’t matter for NOW, but I intended that to mean in relation to the energy invested into building out the wind and solar industries, in context. So long as the EROEI of wind and solar power are over one, we are ahead in that respect.
And in practical terms, we will be way ahead. A few bucks saved when times are flush are not missed, but when times get tight, even a very modest savings account can be a life saver. The electricity produced by wind and solar farms built now will be VERY valuable later on as coal and gas deplete.
Even more interesting forecast for the U.S. from the EIA Annual Energy Outlook 2016
Light-Duty Vehicle Sales by Technology Type (thousands)
Global light-duty vehicle fleet by type
source: Exxon (2016)
• Hybrid vehicles become more commonplace by 2040
• By 2040, one of every four cars on the world’s roads will be a hybrid
• Conventional cars (primarily gasoline-powered) will remain most popular to 2040
• Plug-in electric cars see modest gains; cost and functionality remain barriers
• Natural gas remains challenged as a fuel for most personal vehicles
The study predicts 50 dollar oil slowly rising to 70 by 2040, very conservative. Considering that a lot of new crude oil doesn’t make a profit at $70 and old oil will have faded away by 2040, I find this study flawed.
I suppose they did not take into account that there will probably be less than 60 percent of current crude oil production by 2040.
Of course Bloomberg also produced this article saying that $30 oil was profitable.
http://www.bloomberg.com/news/articles/2016-02-03/texas-toughness-in-oil-patch-shows-why-u-s-still-strong-at-30
Inside EVs counts plug in vehicle sales some are plug in hybrids rather than evs.
After reading this, I took the opportunity to download the slideshow that accomanied Tony Seba’s presentation at the Nordic Energy Summit, hosted by Swedbank on 17 March 2016 in Oslo, Norway. From slide number 8:
“In the mid-1980s AT&T hired McKinsey & Co to forecast cell phone adoption by the year 2000. THEIR (15-YEAR) PREDICTION 900,000, THE ACTUAL NUMBER WAS 109 million. They were off by a factor of :120 x
Is the BNEF study featured in AlexS’ post above likely to be any more accurate than the cell phone adoption forecast produced by McKinsey & Co. back in the mid 80s? I urge anybody who is skeptical to look through Seba’s slides 8 through 17, where he looks at some of the factors involved in market disruptions.
IMHO many the forecasts being bandied about on this site are based on a BAU and don’t account for new disruptive technologies. Maybe that is why Ron was wrong on his original call for the date of Peak Oil. IIRC he, himself has admitted underestimating the impact that fracking would have on US oil production.
I find the hubris of organizations producing forecasts out to 2040 a little annoying. At least Seba points to the fact that his forecast could be wrong, pointing out that, his near term forecasts have turned out to be too conservative and that, if anything, the trends are accelerating.
It goes to the heart of his statement on slide number 10, “It’s usually the ‘experts’ and ‘insiders’ who dismiss Disruptive Opportunities”
Hi Nathaniel,
I can see the Chinese electric car industry growing by leaps and bounds, even faster than in other countries. China still has top down government, and can continue to mandate the sale of electric cars as opposed to conventional cars, thus reducing the need for imported oil , and in my humble opinion at least, they for sure expect to oil, coal, and gas be scarce and expensive before too much longer. This would enable them to spend their foreign exchange money on other stuff.
It would encourage the growth of their wind and solar electricity industries in terms of domestic consumption, and growth in those industries will enable them to be even tougher competitors in the export markets for wind and solar equipment.
And China does not have a huge existing auto fleet in relation to the country’s population, so the country can go all electric or mostly electric on cars sooner than the USA.
But I doubt that battery tech will advance fast enough for trucks, construction machinery, and farm machinery to run on electricity any time soon.
It would take batteries four or five times as good as the best ones available to run a small farm tractor all day, and ten or twenty times as good to run a class eight truck all day. Cars typically run only a few hours, mostly only an hour or so a day, allowing plenty of time for charging. And once they are rolling at highway speeds, cars actually don’t need a lot of power to maintain speed.
Heavy trucks typically run forty to fifty to over a hundred hours per week, year around. This goes a LONG way toward justifying the cost.
A farm tractor often sits for days, weeks, or even months, but when the busy season rolls around, it runs all day, and well into the night, however many hours the operator can stand it. It’s going to be VERY hard to justify the cost of super batteries and the associated charging equipment, etc on the farm given most of the work is done in only four months or less out of the whole year.
The situation with construction machinery is intermediate in terms of utilization, but trucks, farm machinery, and construction machinery typically need a LOT of power on a continuous basis.
So I expect demand for diesel fuel to remain strong for a very long time.
“I can see the Chinese electric car industry growing by leaps and bounds, even faster than in other countries. ”
What will be the primary energy sources that could cover this additional demand for electricity?
Coal? Natural gas?
Wind and solar are obviously the choice of the Chinese government. You may not agree about wind and solar power being primary energy, there seems to be some disagreement about that, depending on the pov.
Predicting is hard, sez Yogi, but a couple of things can be predicted with great confidence. One is that coal and natural gas will continue to deplete, and continue to grow more expensive, in terms of both real and fiat money.
Depletion and inflation never really sleep, but they do nap occasionally. 😉
The other is that wind and sun do not deplete. A billlion tons of coal plus a hell of a lot of labor invested in wind and solar power by the Chinese will eventually result in their harvesting a lot more electricity from their energy farms than they could get by simply burning the coal.
Coal and gas are cheap now, but they won’t always be cheap.Chinese engineering talent and labor are among the world’s cheapest. There will be times when coal and gas are ” unobtainium” due to terrorism, economic nationalism, and outright war.
For trucks it can work – but on another way.
There is a test e-highway in california
http://www.siemens.com/press/en/feature/2015/mobility/2015-06-eHighway.php?content%5B%5D=MO
It’s a combination of 2 old techs, trolleytrucks but with techic from trains. There are additional tests in europe, too.
For farming – you could go on bio gas on the longer run.
My work on pyrolizer convinces me that no farmer need worry at all about fuel. The pyro takes ANY biomass whatsoever, cooks it at high temp and puts out a clean gas +carbon. The gas can be stored, and a diesel tractor can fill up as often as needed as it works the field with that gas going in to a totally unmodified engine set on idle oil as a trigger to burn incoming air + gas, as they do now with propane.
So, farmer simply does not need any ff at all. The pilot oil can be grown easily, and gas generated on the spot from any trash.
The carbon can go back to the field, or used as house heating or cooking
I am not able to do anything in shop anymore, but very good local mechanic is highly competent and is putting all this together under my instruction as a convincing demo, using our ordinary diesel tractor.
I can easily visualize a package the farmer buys to allow him endless supply from whatever he wishes to toss into it.
Any trash + pyrolyzer = tractor gas for fuel + carbon to ground.
Pyro gas + pilot seed oil = tractor fuel forever.
No farmer need suffer from lack of fuel; it’s all there right in front of him.
No ff req’d.
Where is the energy required for solar electric (and wind) power build-out coming from?
Where is it being cannibalized?
And who profits? Who profits first?
Are there current wars going on for energy cannibalization? If so, where are they?
What happens to the climate in this case, this case of energy cannibalization for build-out?
I have also previously-posted something about solar electric power cost u-curves. If so, when do costs go back up? Who gets left out?
What happens to an ‘alternative’ energy-based society in the face of other societies that are still using fossil fuels?
Is there some kind of alternative-energy/fossil-fuel EROEI-threshold crisscross race? Diminishing-EROEI fossil fuel (use) versus alternative-energy buildout (at what EROEI)? Is this what’s going on? Where are we along the line?
Who has the greatest fossil fuel EROEI? Depletion/diminishing-EROEI curves? Who has the greatest alternative energy build-out? EROEI?
So, is it a bit like a last man standing WRT transition?
Insights, guesses, forecasts, opinions, questions, etc.?
Coal to remain major power source:
In the first nine months of this year, state-owned companies received preliminary or full approval to build 155 coal power plants[2] that have a total capacity of 123 gigawatts. That capacity is equal to 15 percent of China’s coal-fired power capacity at the end of 2014 and almost 40 percent of the operational coal power plants in the United States. If the 155 plants operated at typical levels for new projects, they would emit 560 million metric tons of carbon dioxide annually–equal to Brazil’s total energy emissions. According to the chart above, China will have 23 times those plants (over 3,500 coal-fired power plants) when construction on the planned and under construction coal plants is completed.
http://instituteforenergyresearch.org/analysis/coal-will-remain-a-major-global-generating-fuel-particularly-in-china/
If the 155 plants operated at typical levels for new projects, they would emit 560 million metric tons of carbon dioxide annually–equal to Brazil’s total energy emissions. According to the chart above, China will have 23 times those plants (over 3,500 coal-fired power plants) when construction on the planned and under construction coal plants is completed.
Well, then we might as well kiss the remaining coral reefs goodbye! I think a good way to get a jump on things is to run oil tankers and coal ships right into the reefs that way they die sooner and then no one will have to worry about them any more. Who knows maybe we can even get all the countries that have nuclear weapons to detonate a few in some of the major coral reefs… Win win!
http://goo.gl/kKceCa
Climate change alters ocean chemistry leading to ocean acidification
Much of the carbon dioxide that enters the atmosphere dissolves into the ocean. In fact, the oceans have absorbed about 1/3 of the carbon dioxide produced from human activities since 1800 and about 1/2 of the carbon dioxide produced by burning fossil fuels (Sabine et al. 2004). As carbon dioxide in the ocean increases, ocean pH decreases or becomes more acidic. This is called ocean acidification.
With ocean acidification, corals cannot absorb the calcium carbonate they need to maintain their skeletons and the stony skeletons that support corals and reefs will dissolve. Already, ocean acidification has lowered the pH of the ocean by about 0.11 units (SCOR 2009). Moving the ocean’s pH from 8.179 to a current pH of 8.069, which means the ocean is about 30% more acidic now than it was in 1751 (SCOR 2009). If nothing is done to reduce carbon dioxide emissions into the atmosphere, ocean acidification will increase and more and more corals will be damaged or destroyed.
Looks like we are not only not going to reduce emissions but we are going to significantly increase them if we allow more coal burning power generation. And some people seriously believe this planet can support another couple of billion people more than we have now. Burn that coal baby, burn that coal!
Broken Hearts Are For Assholes
Image of new renewables sheik.
I thought that was late great Frank Zappa!
Don t Eat The Yellow Snow
https://goo.gl/WeX7co
Fred,
I don’t think that most people have a real grasp of what it means to lose a species or an eco-environment. Just saying the coral is dying has little effect. Depth needs to given as to the ramifications and general effects that these losses have upon us and the world.
Never assume they actually know what you mean. They have no baseline.
It’s not just you, it’s most communication by environmentalists. They skip the important part of giving background and meaning to what they say.
Most people do not even know that they are themselves an ecosystem working mostly symbiotically with the world. Nor do they conceive their actual relationship with the world.
Yeah, I do know, GF… Since I do understand ecosystems and spent decades diving on coral reefs and have seen the devastation first hand my emotions sometimes get the better of me! I forget how ignorant and clueless most people are.
Climate accord ‘irrelevant,’ and CO2 cuts could impoverish the world: Scientist
http://www.cnbc.com/2016/06/04/climate-accord-irrelevant-and-co2-cuts-could-impoverish-the-world-scientist.html
Sorry, my bullshit meter is pinging very loudly! I could cite plenty of reputable scientists and even economists who strongly disagree with that statement. So let’s all read the actual peer review paper by this lone engineer first and then discuss that on its merits shall we? In general I’m also not a huge believer in the IEAs numbers or most of their prognostications!
Though I guess it would all depend on whose ox is getting gored. I guess it might impoverish a few currently very rich oil barons but if we don’t significantly cut CO2 and transition to a renewables based economy there is no doubt we will destroy many ecosystems and that will ultimately bankrupt the entire planet!
But regardless, from the CNBC article:
Cutting carbon, he added, could result in a dramatic reduction in the world’s quality of life that would usher in mass starvation, poverty and civil strife.
Peak oil is on track to do that already with or without climate change so I guess we’ll all just have to deal with that, won’t we.
What happened to the editing capability for posting comments? Did someone deactivate it?
Anyways here is a link to the actual paper let’s all read it and then discuss that…
http://goo.gl/yvvolN
ABSTRACT
There are lessons from recent history of technology introductions which should not be forgotten when considering alternative energy
technologies for carbon dioxide emission reductions.
The growth of the ecological footprint of a human population about to increase from 7B now to 9B in 2050 raises serious concerns about how
to live both more effi ciently and with less permanent impacts on the fi nite world. One present focus is the future of our climate, where the level
of concern has prompted actions across the world in mitigation of the emissions of CO 2 . An examination of successful and failed introductions
of technology over the last 200 years generates several lessons that should be kept in mind as we proceed to 80% decarbonize the world
economy by 2050. I will argue that all the actions taken together until now to reduce our emissions of carbon dioxide will not achieve a serious
reduction, and in some cases, they will actually make matters worse. In practice, the scale and the different specifi c engineering challenges of
the decarbonization project are without precedent in human history. This means that any new technology introductions need to be able to meet
the huge implied capabilities. An altogether more sophisticated public debate is urgently needed on appropriate actions that (i) considers the
full range of threats to humanity, and (ii) weighs more carefully both the upsides and downsides of taking any action, and of not taking that
action.
OK, right off the bat his three discussion points are wrong, false and a strawman argument!
DISCUSSION POINTS
• Only fossil fuels and nuclear fuels have the ability to power megacities in 2050, when over half of the then 9B people will
live in them.
The assumption that 9B will be living in cities in 2050 is just plain unfounded! And claiming that only fossil fuels and nuclear can power them assumes, if nothing else, that peak oil is myth and fossil fuels remain abundant, cheap and have no deleterious effects on ecosystems. As for nuclear we all know that it is not economically viable.
• As the more severe predictions of climate change over the last 25 years are simply not happening, it makes no sense to deploy
the more costly options for renewable energy.
Seriously?! That is absolutely false!
• Abandoned infrastructure projects (such as derelict wind and solar farms in the Mojave desert) remain to have their progenitors
mocked for decades.
Huh? Whiskey,Tango,Foxtrot?!
This paper is pure unmitigated finely refined Yak Dung of the highest quality, to call it mere bullshit would truly be an injustice of the highest order!
Hi Fred,
I just realized the comment editor broke, not sure why.
Now it is fixed.
Fred, have you ever given any thought to the fact that “for the most ” part renewable energy sources including wind and solar but excluding hydro electric is being done in countries with the ability to create money out of thin air so has to provide incentives for that development. That the cost are generally prohibitive to many if not most countries, and perhaps even the majority of the population of the earth.
Perhaps you could spend some time pondering just how the planet as a whole can simultaneously afford the cost of the current system, build out a completely new system, while maintaining the quality of life without stifling economic growth to the extent that the various governments will not immediately be facing uprising and political turmoil from their citizens. The political risk, the quality of life risk including providing food and medicine are obvious to almost everyone. To deny those risk borders on insanity. To the extent that you believe that people must sacrifice in order to make these changes it will not be limited to “oil barons” it will be the middle class and under classes of each and every society. To the extent you think those burden will last more than one election cycle in this country, absence of a change in our governmental system, is a fantasy.
I offer what I think is a real world example that people will choose current economic development/quality of life over known future risk. Even in the socialist bastion of america, our great state of California, people chose economic development in the face the great and known and provable and even endured risk, building large cities on known active fault lines. How do believe you are going to persuade the entirety of the human race that they should suffer now so others may live better in the future, when even those areas where those types of arguments would seen to have a greater audience ignore them. Perhaps it is just hypocrisy. Don’t do as I do, do as I say….socialist utopia defined.
http://earthquake.usgs.gov/regional/nca/wg02/losses.phpww.
latimes.com/local/lanow/la-me-ln-chance-of-80-earthquake-in-california-rises-usgs-says-20150310-story.html
Hi Texas Tea,
Do you believe that fossil fuels will never peak and decline?
I will assume you do not.
What do you propose would be the solution to declining available energy?
More efficient use of energy will help and will be a big part of the solution. Do you think that will be enough by itself?
I do not.
Perhaps you favor nuclear energy, I am not convinced that when all social costs are considered, that nuclear is much cheaper than wind, solar, hydro, and geothermal energy.
Hey Dennis, I have little doubt fossil fuels will peak and decline under any scenario or definition of peak oil. We live on a planet with finite resources that’s a given. I suppose I do not propose anything except to let the free market dictate our transition, to what I do not know. I have great faith (not blind complete faith) that man given the proper motivation (self improvement/preservation) will seek ways to address this problem. I have no faith a command economy that freezes free thought, freezes innovation, that limits debate, that picks “winner and losers” based on incomplete and ofter times misleading conclusions, and that now wants to punish those who ask the appropriate questions, has such a chance at all of solving the problem. I have dyslexia but I have background in geology, paleontology and a few courses in oceanography. I have made a living from and enjoy understanding earth’s geologic history and have watched in amazement over my life time the great strides we have made in our understandings of it. Our political understanding has not develop at all, the same failed political systems of the past(socialism, communism, fascism) keep reintroducing themselves despite the demonstrative proof they will not serve the supporters well at all. There are no easy pat answers Dennis, only questions.
Hi Texas Tea,
I agree with letting the market decide between the various alternatives to fossil fuels. Society needs to move towards alternatives because the market is not magical and we invite severe problems if we don’t start developing alternatives to fossil fuels.
The easiest way to accomplish this is a carbon tax.
lets start by taxing al gores carbon foot print and then move on from there:)
Hi Dennis,
What does a carbon tax currently mean?
Apparently, carbon (and pollution) is outsourced overseas through industrialization there, with uncounted-carbon-&-pollution-embedded products shipped back.
In any case, why would we expect ‘BAU elites’ to axe their own myopic interests?
Hi Caelan,
A carbon tax would ideally tax fossil fuels at the well or minemouth or at the port or pipeline for imported fossil fuels.
For imported goods in general we would need to consider the importing country. Most EU nations for example already tax carbon so there would be no need for tariffs for imports from those nations.
For nations that do not tax carbon at a level similar to taxes imposed in the US we would estimate the average carbon emitted in the production and transport of those goods to the US and impose a tariff that is equivalent the tax that would have been imposed on those carbon emissions in the US.
For those that don’t like taxes, the carbon “fees” collected could be returned to every citizen of the US as a carbon “dividend” so that the net collection of “fees” by the government would be returned to the people.
See
http://www.nytimes.com/2014/07/30/opinion/a-plan-to-auction-pollution-permits.html?_r=0
or
http://www.carbontax.org/blog/2014/07/30/one-cheer-for-a-new-cap-and-dividend-bill/
or
http://www.peri.umass.edu/fileadmin/pdf/other_publication_types/green_economics/CAP_DIVIDEND_states.pdf
Hi Texas tea,
I am all for taxing the wealthy, as long as we tax the carbon of all citizens with an income equal to or higher than Al Gore’s, I am fine with that. I think it would be better if we impose a fee on carbon emissions and then return those fees to all citizens in equal measure. This gives an incentive for people to move to whatever alternatives make sense to them or to choose to continue using fossil fuels.
It let’s the market work to come up with solutions to a pressing problem.
I have less faith than you that the problem of future energy scarcity will be magically solved by the free market in a timely manner.
I am an optimist, but not that much of an optimist.
China’s coal-powered industry builds, among other things, some, perhaps many, of the world’s solar electric panels (PV’s). When the manufacturing source is factored into the EROEI of solar panels, and it’s China for example, the EROEI looks worse than what it already appears.
The solar electric panel or pseudorenewable advocation, such as hereon, seems to want to eat its cake and have it too; mass and/or large-scale build-out, and at this late stage, using, to boot, a lot (more) of diminishing-exergy fossil fuels, of so-called ‘renewable’ energy in the face of anthropogenic global warming/climate change.
Perhaps Empire wants this build-out first, and to lock in control of as much remaining highest ERORI fossil-fuel reserves as possible, in part to prevent build-out of pseudorenewables in other places.
Profound warming predicted with high cumulative emissions
And the greatest nightmares of all…
It is in part about having an ethical compass behind, and real democratic control over, what we do (rather than necessarily being for or against something), so that we can make better and more informed decisions.
If there can be a war on coal, then there can be a war on coral, all that is necessary is to add an ‘r’!
har
harr
I actually find it highly implausible that China is really going that route and if you don’t get sarcasm that is your problem not mine.
What my comment about gene drives has to do with coal in China isn’t quite clear to me…
However if we are going to burn all that coal then we can indeed kiss coral reefs goodbye. Having said that I think it is beyond ridiculous to say that producing solar panels can only be done with coal or that once they are manufactured and deployed they do not contribute to reduction in CO2 emissions. So therefore we shouldn’t produce any solar panels or wind turbines because to manufacture them it might still be necessary to use power derived from fossil fuels.
In case you haven’t noticed 99% of civilization still depends on fossil fuels and we aren’t going to stop using them for some time to come. So the idea is to put them to good use by building out renewables while we still have the fossil fuels.
Anyways, here’s what the Chinese say about their own coal generating power plants and the future of renewables, while they might be bullshitting some, I get the feeling they know the truth and are taking action. I plan on giving them the benefit of the doubt. So straight from the horse’s mouth:
http://cleantechnica.com/2016/03/02/base-load-power-is-a-myth-used-for-defending-the-fossil-fuel-industry/
Base Load Power Is A Myth Used For Defending The Fossil Fuel Industry
March 2nd, 2016 by Giles Parkinson
Originally published on RenewEconomy.
Last week, leading lights of the global fossil power industry gathered at a conference in Houston, Texas, for CERA, known in the sector as the “Davos of Energy”. They reportedly got the shock of their professional careers.
They had invited the most senior executives from the biggest network owner (Chine State Grid Corp) in the biggest energy market in the world (China). The organisers fully expected their Chinese guest to endorse the “all of the above” marketing pitch, which is underpinning the “keep coal” campaign.
No such luck. Despite prodding by leading oil industry commentator Daniel Yergin, the chairman of State Grid Liu Zhenya reportedly said the “fundamental solution was to accelerate clean energy, with the aim of replacing coal and oil.”
Gasp number one. And then to more stunned silence, he and State Grid’s R&D chief Huang Han dismissed coal’s claim to be an indispensable source of “base load” generation.
As the network operator builds out its clean power sources, they noted, coal-fired generators could only serve as “reserve power” to supplement renewables.
“The only hurdle to overcome is ‘mindset’,” Liu said. “There’s no technical challenge at all.”
Now none of what I have said in this comment negates the fact that we need to all use much less energy because we can’t support 9 billion people on this planet even if we use the best available technology to reduce consumption and we need to start thinking about what we might do about that.
Fred, you recently wrote about the damaging effects of sunscreen to coral reefs a couple of weeks ago or so.
Here is some eye opening information concerning sunscreen:
NOAA National Centers for Coastal Ocean Science researchers and their partners have discovered that a sunscreen chemical commonly used in many soaps, cosmetics, and body fragrances is highly toxic to corals. The team’s data show that even very low concentrations of benzophenone-2, or BP-2, can quickly kill juvenile corals. BP-2 is an additive used in personal-care products since the 1960s to protect against the damaging effects of ultraviolet light.
The team also found that BP-2 causes colorful corals to bleach, and can potentially induce or increase the frequency of mutation in corals by causing damage to their DNA. BP-2 is not removed from most municipal wastewater treatment facilities. This discharge is often directly released in coastal waters of the Caribbean and the Indo-Pacific, threatening near-shore coral reefs.≤/I>
http://oceanservice.noaa.gov/news/feb14/sunscreen.html
Time to ban sunscreen, I’ll pick on sunscreen first, coal second.
Hi Fred,
There is something to be said for top down government when the culture of such a government involves promoting scientists and engineers to the top positions, and when the prevailing culture takes the long term view of things.
There is no doubt in my mind that when Chinese political and business managers sit down for a TOP level discussion, privately, they don’t waste any time arguing that fossil fuels are going to last forever.
Any body with a reasonably comprehensive technical education, such as ahem, any graduate of a “cow college” as some refer to my own alma mater, understands that fossil fuels deplete, and that sun and wind DON’T.
If we yankees were to spend half what we spend on protecting our access to foreign oil on supercharging the renewables revolution, we could break our imported oil addiction before it breaks us.
The Chinese are obviously going to play resource hardball to the extent they can, but they have the cultural/ historical perspective to see that the fossil fuel age won’t last much longer.
Caelan MI,
Why the [sic]? “its” is correct.
Yes, I read initially from ‘they’ and POB’s editing function was not working.
Perhaps Dennis Coyne is flexing his muscles with his new blog. ‘u^
Hi Caelan,
The broken comment editor has been fixed. Not clear how I broke it, but its working again.
Thanks, Dennis.
R Walter,
I don’t know but I’m guessing that those numbers don’t include the 92 coal-fired power plants Chinese companies are building or scheduled to build outside China.
Wish I’d kept the reference.
International Chinese Coal Projects:
TPP Nikola Tesla Power Plant
On October 20, 2011, EPS said it had signed a preliminary deal with a Chinese consortium to jointly build a 744 megawatt coal-fired unit at an estimated cost of more than 2 billion euros ($2.7 billion). Under the deal, a consortium that includes China Environmental Energy Holdings and Shenzhen Energy, and EPS, will form a joint venture for the future project in the southwestern town of Obrenovac, part of its TPP Nikola Tesla Power Plant power complex. An upgrade of the Radeljevo coal mine will feed the plant.[117]
http://www.sourcewatch.org/index.php/International_Chinese_coal_projects
It is being or now is built in Serbia, Tesla was a Serb. The Serbs and the Chinese know where the real power must be for generating electricity, coal is the place to be, seems as such, anyhow.
There is a plethora of coal-fired power plants being built and/or completed by Chinese power plant construction firms, the Chinese go big when building coal-fired power plants around the world.
While the US remains clueless and dinks around with windmills and solar, throwing money away, frittering it our the window, the rest of the world must be determined to act responsibly, provide a constant, reliable source of electricity. JMHO, har
Might not be, but that’s the way it looks.
The US likes Energy Systems that don’t require employees.
Thats why they want useless shit like windmills and solar. 0 employees.
Gas turbine needs 1 employee…holy moly thats 1 too many.
The pseudos love windmills and solar because they are pseudos.
The US Department of No Energy is full of bean counters and techno-utopians. These dummies will bet the farm on pseudo-science: cold fusion. Wait and see.
And so they will all pursue outsourcing electricity generation. Every state playing hot potato, importing , exporting…looking for the greater fool because…
BANKRUPT
Oil BS Index is totally off-scale. Agree?
http://www.zerohedge.com/news/2016-06-04/how-spot-bullshit-princeton-professor-explains-why-ignorance-truth-matters
or the Video:
https://vimeo.com/167796382
Warren Resources files for Chapter 11
HOUSTON, June 3
http://www.ogj.com/articles/2016/06/warren-resources-files-for-chapter-11.html
Warren Resources Inc., Denver, filed for bankruptcy protection in a Houston federal court on June 2 after negotiating a debt-for-equity swap with a group of senior lenders led by Blackstone Group’s GSO Capital Partners.
Senior lenders agreed to swap $248 million they are owed for an 82.5% stake in the reorganized company, court papers showed.
Warren Resources primarily focuses on oil in the Wilmington field in the Los Angeles basin of California, natural gas in the Marcellus shale in Pennsylvania, and the Washakie basin of Wyoming.
=========================================
Linc Energy Subsidiaries File Chapter 11
June 1, 2016
http://www.ogfj.com/articles/2016/06/linc-energy-subsidiaries-file-chapter-11.html
On May 29, 2016, US subsidiaries of Linc Energy Ltd. filed voluntary petitions for relief under Chapter 11 of the United States Bankruptcy Code.
Linc Energy is a global business with oil and gas operations primarily onshore in the USA (Alaska, Texas, Louisiana & Wyoming); exploration for shale oil and gas in the Arckaringa Basin in South Australia; developing a proprietary technology for the extraction of heavy oil; and a number of opportunities to apply its proprietary Underground Coal Gasification (UCG) technology in target markets including Asia and Africa.
Back to climate for a minute since so many comments in this thread are already about climate.
When a person pops into this forum from out of nowhere, so to speak , starts commenting on climate, it is very easy to presume he or she is a troll, maybe even a paid Koch brothers type.
BUT such a new member is NOT NECESSARILY a troll. Some people, tens of millions of people actually, including religious types that supposedly believe the world is only six thousand years old, are well enough informed to know about ice ages and green house ages, etc, and understand that the climate does vary enormously over time for natural reasons. (I can’t say that I have heard a preacher deny the existence of dinosaurs or deep time within my living memory, but it’s best not to bring up dinosaurs with preachers, it tends to get them rather hot under the collar, lol.)
So- IF such a person happens to be an opponent of the leftish liberalish wing of our political system, then that person just naturally tends to believe that climate change is all natural, and the activities of men have nothing to do with climate change.The one absolutely KEY thing to remember in understanding people is that they believe what they WANT to believe, and that tribal loyalties trump actual evidence, except in the case of the handful of people who are technically well educated. Even then, expertise in one branch of science and technology is no guarantee of high school level competence in other fields.
(I believe most of us have heard about the distinguished astronomer who made an utter fool of himself talking about a hurricane assembling a jet from a scrap yard of parts being more likely than evolution creating an eye, lol. He simply didn’t know shit from apple butter about evolution. )
The point of this ramble is that some people who understand the fact of natural climate variation can be brought around to understand man made climate change, even if they are utterly ignorant of the physics of green house gases.
But so far I have not been able to get the explanation down to a few words that are quickly intelligible to a person who knows some climate HISTORY, but no climate SCIENCE. All suggestions appreciated.
WORKED LIKE A DAMN FOR MY GRANDSON (see PAGES 9, 10 & 11)
“In the student activity ‘Global Warming in a Jar’, the three models of Earth’s atmosphere are highly simplified representations of very complex systems. They are useful for demonstrating a few of the most basic concepts pertaining to climate mechanics and global warming.”
http://www.starhop.com/library/pdf/studyguide/elementary/glojar-7.pdf
“except in the case of the handful of people who are technically well educated”
That is an “F— Y–” statement to those who are educated and do not believe that human caused CO2 [such as breathing] is the major determinant of global warming. EXCUSE ME!! I mean “climate change.” Sometimes it is hard to keep up with you guys.
Well you see the real problem is that humans like beer…
The alcoholic fermentation of glucose by Saccharomyces cerevisiae is described by the following net equation:
C6H12O6 (aq) 2 CH3CH2OH (aq) + 2 CO2 (g) + energy (2 ATP + heat)
We have been brewing beer for thousands of years sooner or later something had to give… Notice that equation gives off both CO2 and heat and that right there is what is really what is causing global warming!
Not to be confused with ‘Climate Change’ which is really mostly caused by something completely different… it has to do with aerobic respiration and the Krebs cycle involved in the metaboliosm of neronal cells of certain great apes of the genus Homo. But most of them aren’t sapient enough to understand the difference.
Beer and wine became beverages to drink because you couldn’t drink the water, you would become ill.
1600 BC Egyptian texts contain 100 medical prescriptions calling for beer.
Noah’s provisions included beer on the Ark.
4300 BC, Babylonian clay tablets detail recipes for beer.
http://www.beerhistory.com/library/holdings/raley_timetable.shtml
Beer has high bi0-availablity of silicon, important as we don’t eat all the crap stuff like ligaments in meat any more, and may explain why males (with higher beer consumption) have lower osteoporosis problems than females:
http://www.livescience.com/6072-beer-good-bones.html
Also good for digestion, promotion HDL (better than any known drug), and as Homer said (not the Greek, though who knows) the cause of and solution to all natures problems.
https://www.youtube.com/watch?v=hUVwR0rw5fk
If a person does not want to believe something, it takes an ENORMOUS to impossible amount of evidence to convince him it is so.
So- If a person is possessed of a basic, sound technical education, then that person must understand the greenhouse effect, step one. More greenhouse gases, every thing else equal, means a hotter world. Who among technically educated people does not agree with this assumption- REMEMBERING everything else is held equal, of course.
I use the word “assumption”, because it IS possible there MIGHT BE some unknown processes that allow the planet to shed heat faster than usual, preventing the average temperature of the planet from rising.
However, to the best of my knowledge, nobody has discovered any such processes that increase the rate of heat energy loss on a planet wide basis. There is speculation that cloud cover could increase reflectivity or albedo so as to lower the amount of energy reaching the lower levels of the atmosphere, otherwise……… not much. More clouds also mean more heat RETENTION.Even city slickers know there’s frost on the windshield on CLEAR nights.
The question comes down to accepting the significance of the actual temperature RECORDS now being kept by just about every country in the world.
The trend is up, up at a pace that does not mean much of any thing at all, in terms of human scaled time. We are hard wired to deal with short to medium term time, as individuals, and as a species. Centuries mean nothing to us, except as abstractions. Even decades barely register, especially in terms of slow slight change, and a degree of temperature in a few decades just does not register. In terms of human perceptions, climate change simply DOES NOT register.
We have to switch over to the intellectual realm of physics and mathematics to grasp the reality.
The nature of the evidence is statistical. The temperature is creeping up, year after year. If you are open to the idea that we are forcing climate change, then the evidence is crystal clear.
If you are not open to the idea, well, when you start seeing a few years when the average temperature has gone DOWN, instead of UP, you have the beginnings of a case, SOMETHING to work with. If you see a DECADE when the average temperature is falling, you can say your case is at least fairly solid.
That famous astronomer was up on probability , but totally ignorant of high school level biology.
Belief in forced climate change, or disbelief, correlates better with a person’s political culture than any other factor, so far as I can see. If you are personally a liberal, here in the USA, you are apt to believe in forced climate change , if you are conservative, you are apt to believe otherwise.
It’s like Clinton’s email scheme. I have yet to meet a hard core Clintonista who believes she did it for any thing OTHER than convenience, and I have yet to meet a hard core conservative who doesn’t believe she did it to hide something, lots of somethings.
The thing is, if Clinton were a REPUBLICAN , in THAT CASE, her hard core supporters would be dead sure she is crooked. This applies both ways of course , with other politicians.
I am just about the sole self identified conservative who comments here, but I am also one of the rare individuals capable of setting aside my tribal preferences, beliefs, and prejudices when it is time to do a little CRITICAL THINKING.
My technical training, which includes basic probability theory, plus a smattering of statistics, leads me to the inescapable conclusion that the planet is heating up, VERY quickly in terms of physics, unless there is a vast LEFT wing conspiracy faking the temperature data, lol.
I don’t believe such a leftie temperature data manipulation conspiracy exists, so I believe the evidence clearly indicates the planet is heating up due to forced climate change.
Given that I understand the scope of our environmental problems, I find myself as a human being unable to vote for a TRUMP type prez under any circumstances.But given that I understand probability theory, and Cattle Gate, what choice do I have but to support Sanders?
It is amazing how most people can be so unbiased in a self-assessment!!
OFM says: “I am just about the sole self identified conservative who comments here, but I am also one of the rare individuals capable of setting aside my tribal preferences, beliefs, and prejudices when it is time to do a little CRITICAL THINKING.”
Did you ever read an obit that said “he/she is probably rotting in hell?” NO! – It is always “he/she is now in heaven and we look forward to seeing him/her there in the [distant] future.”
If they do believe in God, it is as if God is not the final judge.
By the way, I hope that I do not have to self-identify myself as a conservative. You guys can think what you may.
Even the dumbest preacher knows that funerals are held to comfort the living, rather than for the benefit of the dead, lol, but you have a GREAT point.
The thing is , unless you believe there is a leftie conspiracy to fake the data, the planet is heating up pretty damned fast.
And if you really do understand the nature of the peer review process, you understand it CAN be and is manipulated sometimes. This could be one of those times.
(The biggest manipulation of peer review I am aware of involves my own industry,tangentially. Special interests,namely food MARKETERS have managed to sell the establishment on third class evidence when it comes to sugar, fats, preservatives, synthetic ingredients, excessive processing, etc, of the food we eat. )
But it’s not. There are literally thousands of people OUTSIDE THE CLIMATE SCIENCE ESTABLISHMENT who agree with the forced warming argument- people who do have the technical chops to understand the science and the data at the professional level. There are very few few who disagree.
Just about every body who actually knows enough hard science to MAKE a personal professional judgement seems to believe in forced warming.
There are always a few people in every profession who think outside the box of course, and sometimes they are right. In this case,though, more and more evidence is piling up for the status quo, year after year.
Now personally I do NOT have the professional grade knowledge to make my own judgement, but I know the basics. I also know the basics of the law, but I trust the opinions of the law profession when it comes to the law rather than my own. I know a hell of a lot more than the basics of biology, but I also trust the judgement of medical establishment rather than my own when it comes to questions about health.
When it comes to climate, honesty requires me to say in no uncertain terms the R party is wrong, the D party is right. Of course there are a few R politicians who get it right, and a quite a lot of R party foot soldiers get it right.
When it comes to renewable energy, and the eventual depletion of fossil fuels, the D party is way ahead. Out of sight ahead.
But recognizing these facts does not make me a D. They are wrong about some other things, for instance maintaining the strangle hold of the teachers unions on secondary education.
They are ahead on environmental issues in general, but they are wrong about allowing so many immigrants into the country.
Just about any environmental advocate with a brain bigger than a peanut knows and generally admits one on one we need stop population growth, and getting it right starts at home. Hardly any environmentalist will say so in public for fear of political retribution.
Hi Mac,
I mention population growth as a serious problem all the time, if current trends in total fertility ratios continue, population will peak by 2070 and begin to decline, and by 2o50 optimistically.
We will need to implement better education policy and better access to women’s health and birth control services Worldwide to accomplish this as quickly as possible.
I consider myself an advocate for the environment.
==Real Research==
You see below even real research scientists still dont know all they can about the climate change, or have all the answers some people not in the science think they do. scientists still must figure out how all these global things work…and they are very complicated so lets try not to put people down, mock, tease and ridicule them just because they dont have the same beliefs you do. Its not nice at all plus makes a lot of people i know really hate the democrats and the way they behave like they know it all . We should get all opinions discuss on things like climate change since they might make us spend money and tax to fix it.
Do Increasing Contents of Methane and Carbon Dioxide in the Atmosphere Cause Global Warming?
G. V. Chilingar, O. G. Sorokhtin, L. F. Khilyuk, M. Liu*
Russian Academy of Natural Sciences, US Section, Los Angeles, USA
Email: *
Received 26 September 2014; revised 27 October 2014; accepted 10 November 2014
Academic Editor: Mohammad Valipour, University of Tehran, Iran
Copyright © 2014 by authors and Scientific Research Publishing Inc.
This work is licensed under the Creative Commons Attribution International License (CC BY).
Abstract
In the Earth atmosphere, methane gradually converts into carbon dioxide which, according to the
conventional anthropogenic theory of global warming, is the main driver of global climate change. The authors investigated the greenhouse effect of methane and carbon dioxide in the atmosphere using their tested adiabatic model, which relates the global temperature of troposphere to the atmospheric pressure and solar activity. This model allows one to analyze the global temperature changes due to variations in mass and chemical composition of the atmosphere. Even significant releases of anthropogenic carbon dioxide and methane into the atmosphere do not change average parameters of the Earth’s heat regime and have no essential effect on the Earth’s climate. Thus, petroleum production and other anthropogenic activities resulting in accumulation of additional amounts of methane and carbon dioxide in the atmosphere have practically no effect on the Earth’s climate.
Keywords
Global Warming, Carbonate Dioxide, Methane
Amanda,
Thank you very much for your post.
A wise man knows he cannot find truth, only a fool believes so.
A wise man knows he cannot find truth, only a fool believes so.
And only a truly ignorant and scientifically illiterate person blinded by ideology makes statements like that! May as well toss out all of mathematics, physics, chemistry and biology because there is no way we can find the truth! That has to be one of the most misguided things I’ve heard in a long while…
Fred,
Thank you very much for falling into my trap.
My statement above is actually not my statement, yet is from Socrates, a worldwide well known and respected Greek philosopher (scio me nihil scire).
It actually wants to tell us that we should be more cautious about our own views as we will get otherwise humiliated before all eyes – just like you now.
It may have held sway in days of the Greek philosophers, it doesn’t work in the 21st century!
Hi Heinrich,
Interesting. Could you explain glacial interglacial cycles? Note that you must also assume that atmospheric CO2 remains at 180 ppm, as carbon dioxide has “practically no effect” on climate.
“Even significant releases of anthropogenic carbon dioxide and methane into the atmosphere do not change average parameters of the Earth’s heat regime and have no essential effect on the Earth’s climate.”
What a laugh!
Case 1
Activity – fossil fuel extraction
Cash flows – enormous (1.2 trillion U.S. dollars in 2011 O&G , $453bn Coal)
Profitability – very high under normal circumstances
Sample Company – Koch Industries
Known beneficiary “think tanks” of company or it’s owners-
Heartland institute, Institute for Energy Research
Case 2
Activity – climate research
Cash flows – you tell me
Profitability – you tell me
Sample Company – ?
Known beneficiary “think tanks” – ?
It was fairly easy to find instances where FF industry funded non profit institutes were caught attempting to disparage climate research or renewable energy. Bearing in mind the massive revenues and profit of the FF industry, it is not hard to figure out the motives for these shenanigans. I am yet to hear an explanation from any body like our newbie poster, Amanda Di Gironimo that can explain the motives of climate scientist, as opposed to the motives of the FF industries who’s activities are being blamed for facilitating global warming.
I can easily understand regular participants on this site who have done and continue to do very well for themselves and their families by working in the industries. Of course such individuals can be expected to be skeptical about anything that poses a threat to their livelihood. Amanda on the other hand pops in out of nowhere, to respond to a mere mention of climate change, making sure to leave “magnets” for other trolls in the form of “Keywords”. I have no choice but to conclude that she is a despicable little FF industry paid troll.
It would be interesting to know what Amanda thinks about the financials of shale oil wells/companies or the recent trend of car buyers buying SUVs rather than fuel sippers or whether it is possible for EVs and renewable energy to fill the gap left by declining oil production when it begins in earnest. Does Amanda believe that oil production will ever Peak? If so, it would be interesting to know if she agrees with Ron that 2015 was it or does she think that Dennis is more on target with his model, pointing to a higher peak between 2018 and 2030?
They are using the wrong model.
Explain why the earth is well above black body radiation temperature if greenhouse gases have no effect. Deep freeze if no effect.
The atmosphere is fairly opaque to incoming UV (oxygen and ozone) and a significant portion of incoming infrared,70 -75% percent gets in. The lower energy back radiation has window through the greenhouse gases allowing about 30 percent (clear air) out to space. CO2, water vapor and methane have absorption bands at the edges of this back radiation window, as well as within the opaque region. CO2 band broadens into this region and methane is not saturated giving it a large effect. Thus any increase in greenhouse gases such as CO2, methane, and water vapor will reduce the transmission of back radiation, making it more opaque and thus warmer.
The atmosphere is actually fairly opaque, it’s just that we see in the region that has a transparent window, so it looks clear to us. It’s what you can’t see that counts as far as global warming.
let me offer you this. if we know how to heat up the planet that will come in mighty handy as we come out of the current interglacial period we are now in.
http://www.ncdc.noaa.gov/paleo/abrupt/data2.html
maybe a approach would be to convince humans to move to alternatives energy now so that we can save some fossils fuels for the future to melt the ice sheet advancing on to your farm. One thing we do not know how to deal with is the earth moving towards its normal cycle where it cools dramatically, everyone alive today can thank their lucky stars the issue maybe global warming.
BTW, I have a cave on my place with a archeological record going back 10,000 years. The cave flowed water routinely/periodically from at least 10,000 years to 2000 years ago based on the archeological record, but stopped abruptly ~2000 years ago. Two years ago we had distinguished climate scientist from our state universities telling us Texas was in a permeant drought brought on by human induced climate change. Last november for the first time in 2000 years the cave flowed water. This year in Texas our reservoirs are at near capacity in all places but far west Texas, how could anybody have seen that coming?
(sarc)
Interesting how climate change denial conveniently supports your personal career in the fossil fuel industry as it kills the planet.
How could anybody have seen that coming?
if you found that of interest perhaps you will also find this of interest.
http://www.sciencealert.com/a-mini-ice-age-is-coming-in-the-next-15-years
Hello Texas,
“A ‘mini ice age’ is coming in the next 15 years” is just another sign of denial.
We have white sandy beaches and solar panels on our home roofs powering our EV’s here.
http://huntingtonbeach.regency.hyatt.com/en/hotel/home.html
Come visit, I’ll show you around and buy you dinner with an ocean sunset.
Huntington Beach is proof there is life after oil.
https://en.wikipedia.org/wiki/Huntington_Beach_Oil_Field
Please stop posting pseudo science bunk! That has been thoroughly debunked many many times in the scientific literature. Not a single reputable climate scientist is expecting an ice age in the next 15 years.
What if the Sun went into a new Grand Minimum?
Filed under: Climate Science Sun-earth connections — group @ 19 June 2011
http://www.realclimate.org/index.php/archives/2011/06/what-if-the-sun-went-into-a-new-grand-minimum/
It remains to be seen whether this prognosis turns out to be true (there have been some doubts expressed), but since grand minima of solar activity did occur in the past, it is certainly interesting to explore what effects such a minimum might have on 21st century climate if it did occur. This is precisely the question Stefan Rahmstorf and I investigated in a study published last year (see also our press release. (Earlier estimates for the size of this effect can be found here and here.) In our study we find that a new Maunder Minimum would lead to a cooling of 0.3°C in the year 2100 at most – relative to an expected anthropogenic warming of around 4°C. (The amount of warming in the 21st century depends on assumptions about future emissions, of course).
Fred I have no real issue with someone passionately defending a position. People with passionate positions are frequently wrong.
I do not think it is “pseudo science bunk” to acknowledge or remind or to educate people that the earth has a tectonic and climate history. In that history we have had periods where the atmosphere has had a greater percentage of CO2 without human intervention, we have periods when the earth climate has been much warmer and much colder without human intervention.
It is not “pseudo science bunco” to acknowledge that humans do and will impact their environment often in negative ways, often times at the expense of other species. To the extent we can modify the damage we do that is a good thing, to think we understand all the earth processes and with some good will, higher taxes and enlighten debate can alter them is the very definition of unproven “pseudo science bunco”. We can study the processes/cycles we can adapt to the changes those cycles will bring, but alter them, pure unmitigated unproven “pseudo science bunco”.
That is beyond arrogance, but even worse is that we have people that seem to be able to say, that on this date, at this time in earth’s 4 billion year history, we decree the world climate is at its optimum and we will endeavor to preserve it, if it starts to warm we will cool it, it if start to cool we will warm it.
So be honest Fred, call out some of the “pseudo science bunco”
that has spewed from the alarmist and in fairness and to promote honest scientific debate share with us a few instances where studies like the one you cited above were not only wrong by degrees, but complete and totally wrong. Just seems fair. If you cannot accept the fact and call them out, for the times they just get it plain wrong, why do you believe anybody should listen to anything you or they say. I think that is a fair question.?
Hey Fred, we all get by with a little help from our fiends, in that spirit: http://www.thenewamerican.com/tech/environment/item/18888-embarrassing-predictions-haunt-the-global-warming-industry
Hi Texas Tea,
So you expect an ice age in 15 years? Is that what you are saying? Yes the climate was warmer millions of years ago and carbon dioxide levels were higher and the sun’s output was somewhat lower, also the positions of the continents was different so ocean currents were different.
The more relevant period is the last 800,000 years where carbon dioxide levels (prior to 1900) were in the range of 180 ppm to 300 ppm. The science is fairly well understood though further research on clouds and aerosols is needed as we are now in uncharted waters for the flora and fauna that have evolved over the preceding 800,000 years.
Also note that a carbon tax need not mean higher taxes, income tax or corporate tax, or a little of both can be reduced by exactly the amount of the carbon taxes collected so that the change in total net taxes can be zero.
In fact the legislation could be written that way, or a carbon fee and dividend plan could be used where all taxes collected are returned to citizens as a “dividend”.
The point is to move us to non-fossil fuel energy to reduce the coming energy shortages which will result with no policy changes. Your faith in the perfection of markets is quaint, but perfectly competitive markets only exist in economics textbooks.
Fred I have no real issue with someone passionately defending a position. People with passionate positions are frequently wrong.
That’s fair. However I’m willing to bet you a considerable sum of money that there will be no ice age 15 years from now. Of course given that I’m already 63 I may not even live long enough to collect on that bet.
Part of the problem I have with that statement is the claim that we don’t really know. The argument that science doesn’t know everything or that there are uncertainties is true but it totally misses the point! We actually know a hell of a lot!
Hi Fred,
Yes Texas Tea seems to be implying that either we know everything with perfection (God-like omniscience) or we know nothing at all. That is a false dichotomy. I agree we don’t know everything, but we know quite a bit.
Sometimes people only see black or white, there is a lot of gray in the real world, the fact that there is considerable uncertainty means we should proceed with caution when experimenting with the planet’s ecosystem if we would like to survive as a species. The interdependence of humans with the rest of the biosphere is often missed by most humans.
Yep, I couldn’t agree more!
texas tea,
This interglacial is not acting like the previous ones, nor will it.
The piece at your link points out that glacials end abruptly, and that is correct. CO2 and CH4 concentrations in the atmosphere increase rapidly early in the interglacial and then decline gradually; in the case of CO2 that decline bottoms out at about 190 ppvm during the glacial.
In the current interglacial the lowest measure of CO2 concentration reached was 280 ppmv at about the beginning of the Industrial Revolution, and the current value is above 400 ppmv and climbing. This situation is unprecedented–not seen in previous interglacials. We cannot extrapolate the timing of the interglacial/glacial transition in previous cycles to our present interglacial. We may have postponed the next glacial or canceled it.
The deviation from the pattern of GHG decline during previous interglacials shows up some 9000 years ago as the CO2 decline slows; at around 5000 years ago CH4 decline slows in turn. Forest clearance for the expansion of agriculture is the suggested cause for the first and the spread of rice cultivation for the second.
“We cannot extrapolate the timing of the interglacial/glacial transition in previous cycles to our present interglacial. We may have postponed the next glacial or canceled it.”
the word “may” is the key word and I assume you think that is a good thing if we have delayed or modified the effects at least for humans? I think it is refreshing to see someone with knowledge, at least greater than mine use words like “may” because the truth is we just do not know. I think the one thing, apart from “scientist” falsely blaming every negative weather event on global warming, is that far to many climate scientist do not put their research or ideas or hypothesis into proper context. To say nothing about the endless string of alarmist predictions in the past 10 years that have failed. Being wrong in science is about as normal as falling when one learns to walk. It is not a bad thing, it is not a good thing, is just is.
Hi Texas Tea,
Most climate scientists are not alarmist, it is the environmentalists that sometimes make claims that are not very good.
For example, if we combine the ideas of mainstream climate science with many mainstream predictions for fossil fuel URR (which are considerably higher than my estimates) it is likely that warming will be significant.
In fact, the uncertainty is part of the problem. A doubling of atmospheric CO2 (from 280 ppm to 560 ppm) is easily accomplished with “mainstream” fossil fuel URR estimates (in fact it might result in atmospheric CO2 levels of 650 ppm if it is all burned). Mainstream estimates are for a 3 C rise in temperature (though it will take 400 years as the ocean warms slowly) and a 2 C rise relatively quickly (within 100 years) due to a doubling of atmospheric carbon dioxide levels.
It takes about 30,000 years for carbon dioxide levels to return to 310 ppm due to natural removal of CO2 from the atmosphere from the natural carbon cycle. So an ice age is unlikely to be a problem in this scenario (as anything above 280 ppm will keep us out of an ice age).
The temperature change for a doubling of atmospheric CO2 (after the ocean has warmed in 400 years) is called the equilibrium climate sensitivity (ECS) and the best estimate is 3C+/-1C, if it is 2C there is less of a problem and if it is 4C we have more of a problem and the science is not perfect. Based on temperature data over land, it looks like ECS is not likely to be below 3C, if we assume changes in global land temperatures match the eventual temperature changes over the ocean (once the ocean warms to “equilibrium” with the atmosphere).
A good place to start is at the American Institute of Physics:
https://www.aip.org/history/climate/summary.htm
texas tea,
All that from “may”? Heavens.
Let me make it “We may have postponed the next glacial, or canceled it.” We can be sure we won’t see a repeat of the timing in previous interglacials, because we already see major deviation from it.
I don’t assume the situation is good, or bad, for humans.
The phrasing in the peer-reviewed literature of the natural sciences makes use of conditionals. You will see “this suggests”, “this is consistent with”; you won’t find “this proves”. Outside the peer-reviewed literature is outside its conventions, and everyday language is usual; that, for better or worse, is what will be picked up on by news media.
AlexS
I just learned of the revised OCC guidelines for US upstream E & P.
They were released in late March, 2016.
I am embarrassed I am just learning of them. However, I am not aware of the US business media reporting on them either.
I believe these new guidelines directly resulted in the numerous May, 2016 BK, and effectively end much of the shale revolution. No longer will banks be permitted to ignore a company’s junior debt.
Haynes and Boone has a good summary dated 3/28/16.
Reposted from up thread
Hi Shallow
Years ago I bought shares in a London listed company with producing assets in Russia. In 2012, Maxim Barskiy made a strategic investment in the Company. Shortly after doing so, he took over as CEO. They sold the field in Russia and bought leases in the Texas pan handle with active and non active stripper wells.
There have been various aquisitions and mergers, some wells are currently shut in but they are still drilling vertical wells ( but only 4 this year). The interesting point is that they are now fracturing these new wells in the old conventional fields.
I just wondered if you knew of any other operator that was re completing stripper well by fracturing them.
http://matrapetroleum.com/m/
Lightsout.
I am not aware of the company you linked.
My initial advice would be to see what the CEO, upper management, etc., are being paid and then compare that to the company’s total production. Look at G & A per barrel, or per BOE.
The problem with a lot of public companies in the E & P space, both shale and non-shale, is that they are ran primarily for management, and not for the shareholders.
I see a lot of relatively small E & P’s that are cash flow negative that are borrowing to pay the upper management big salaries.
So, if you see a public company producing under 10K BOEPD, where top management are being paid in the hundreds of thousands of dollars (or millions) in salary, my general advice is to stay away.
Most private conventional E & P in onshore lower 48 have been paying little to no distributions since the end of 2014. Management is taking just enough salary to pay their personal expenses, if that even. Things are still very dire, although there is considerable improvement since Q1 2016.
Please note my comment regarding the revised OCC (Office of the Comptroller of the Currency) guidelines. I see there are not comments on this. Further, the MSM has totally missed the boat on this.
I think many more public E & P’s will be forced into bankruptcy due to the tighter guidelines (which IMO should have been in place from the beginning – we would not be where we are today if they had been).
Again, Haynes and Boone has a client letter dated 3/28/16 which can easily be found by Google search. Maybe someone here can provide a link.
It is a big deal, IMO. Anyone who is trying to forecast US oil production needs to look at this issue. I think it is going to choke off the alleged, “Return of rigs at $50 WTI”.
The only companies able to do much now are those Permian guys who raised cash through diluting the equity. I’d say the Bakken, EFS and Niobrara focused companies will not be able to do much absent the NYMEX strip jumping about $25+ as that is what will be needed, minimum, to get PV10 high enough for them to qualify for more reserve backed funds.
Shallow, I wish to acknowledge your OCC findings and all of your analysis regarding the economics and finances of shale oil development. Your value here on this blog is immense. I agree with you, by the way, that the ramifications of these new banking requirements will potentially end any additional lending to the shale industry…until it find ways to worm around these new standards. Which we should expect, of course. I mean, after all, the lower the price of oil goes, the lower shale oil breakeven costs go, the higher EUR’s go. Its a miracle !
This OCC matter will be of little interest to most people, however. Shale oil proponents have the unique ability to disassociate themselves completely from the business of producing hydrocarbons and, forgive me, are delusional about economics, profit, and where the money comes from to drill wells. They don’t get it. They don’t want to get it.
For financing reasons, environmental and social reasons, for reasons of enormous, unmanageable debt, the shale oil industry in America will never again be what it was, not even close.
Mike
Mike: Thanks!
From what I have read, there are presently/will be a lot of energy loans examined under these new guidelines between now and the next borrowing base redeterminations coming this fall.
Initially, OCC was going to include ALL junior debt. The OCC apparently found out (I wonder how they did not already know?) that including ALL junior debt would result in massive borrowing base cuts, and force many more E & P’s into either BK, or into mezzanine financing (high interest/onerous terms). To quote Raw Energy, cause a mini-meltdown akin to the mortgage backed security financial crisis.
So, for now OCC is only including any junior debt which COMES DUE prior to the first lien bank lines. Most of the bank lines are multi-year, so there could be a lot of junior debt which does come due prior.
Further, OCC is counting not just the drawn, but also the undrawn amounts on the bank lines. So, if Shale R Us brags they have a $2 billion line of credit, but only have $100 million drawn, there is still a problem as the whole line is included in the calculation. It actually becomes a detriment to have a large, undrawn, bank line.
Further, banks are now also being directed to use the NYMEX forward strip, rather than their own price decks. This is a problem, as I suspect many of the banks have been assuming much higher prices in 2018 and beyond, than is indicated by the futures strip.
Raw Energy, on Seeking Alpha, is much better versed on these matters than I am. Hopefully he will write an article there about the implications of the new OCC guidelines.
I think this issue is critical here, where many readers and posters are closely following US production. Absent the ability to issue equity, or obtain mezzanine financing, I’d say shale is going to have to drill out of cash flow. Further, shale is now taking a big risk by not setting aside any money to pay down junior debt. So, what little cash flow there is may be needed to pay down junior debt, not drill new wells.
Shallow sand,
Can you post the link to the OCC document?
Thanks!
here
Enno: Thanks!
Shallow/Enno,
Thanks so much for this Haynes and Boone Energy Alert.
There are going to be a lot of disappointed royalty owners in the Permian and elsewhere when the effects of this start to hit. Most royalty owners don’t realize that they are unsecured creditors with very little recourse if royalties go unpaid.
I almost feel guilty that I am not paying you guys for this information.
Enno,
Thanks!
i think this can be a net positive for the oil price and stability of our industry. good to see. good find. interesting the date posted was just before the most recent advance in price.
shallow, did you see this?
http://www.reuters.com/article/idUSASC08SSX
BRIEF-WPX Energy Inc prices public offering of 49.5 mln shares for total gross proceeds (before estimated expenses) of about $485 mln
The stock went up with the dilution (?) and they plan to use the money to drill wells:
“WPX says it plans to use the proceeds for general corporate purposes, which may include an acceleration of drilling and completion activities, bolt-on acreage acquisition, and midstream infrastructure in the Delaware Basin.”
Let’s hope conservation and the transformation to renewables does put an end to the shale oil industry in America. But you would have thought by now that you would have learned never say “never again”.
If the price of oil rises and shale becomes profitable again. Money will flow back to American shale industry. It just might be done in a different manner. You can take that to the bank.
Hi Mike,
Consider the possibility that many LTO companies go bankrupt, that wipes out most of the debt. Oil output decreases in the US. What would you expect might happen to World oil prices?
I don’t think we would want the LTO industry to be what it once was, a loss making enterprise (for most companies), there were a few well run companies such as EOG that were profitable before the crash in oil prices.
Based on EIA data on proved reserves at the end of 2014 there is still some LTO oil that can be produced. Higher oil prices ($80/b or more) will be needed for this oil to be produced profitably.
I expect by 2020 (at least) oil prices will be at least $80/b (in 2016$).
What is your expectation for future oil prices? Do you believe oil prices will be less than $70/b (2016$) in 2020?
Current futures strip is $56/b in Dec 2020, but futures do not predict future prices very well that far forward.
The EIA’s AEO 2016 reference case has WTI at $71/b in 2020 and $97/b in 2030 (both in 2015$).
Hi Shallow
Thanks for the reply. I was not seeking investment advice I already know that was a bad one.
The point I was making is that when Maxim took over as CEO after investing a chunk of his own money following his displeasure at not getting the top job at TNK BP. He then chose to completely exit russia and in 2013 at the height of the shale boom he sought to invest in stripper well leases.
It says a lot to me about what the top guys think about both Russia and shale.
This “top guy” is a CEO of a company that was producing just 126.4 bopd
in Russia (1H13 average) and is now producing 750 boepd (gross) from 315 wells (2.4 boepd per well) in the U.S. And is loss-making and cash negative.
The table below shows why really “big guys”, like BP, Shell and Exxon, are still doing business and making money in Russia:
BP’s upstream segment replacement cost profit before interest and tax by region in 1Q16 (USD million):
Holy homeland wells Batman ! Link or Page in Stat Review for the Table? BP (a) typical in some of these markets? Reasons why the UK is the most Profitable
1. Experience in Mother County 2. Productivity of Resource.
Reasons the US is Lowest?
1. Lawyers 2. Spill Trauma 3. Regulations 4. Lack of Conventional Resources 5. Poor Acquisitions 6. Management
7. Other costs like ACA? 8. Low Sales Price 9. Cost of Making American Oil Great Again 🙁
BP Annual Report and Form 20-F 2015, p.170
http://www.bp.com/content/dam/bp/pdf/investors/bp-annual-report-and-form-20f-2015.pdf
Sorry, these are 2015 annual numbers, not 1Q16
Below are detailed numbers for the U.S. upstream segment:
Note: Other costs (income) include property taxes, other government take and the fair value gain on embedded derivatives of $120 million.
BP 1Q16 upstream results
Integrated Oil Not interested in shale…think again
Argentina’s Prized Vaca Muerta Shale Could See $10B Exxon Investment
http://oilprice.com/Latest-Energy-News/World-News/Argentinas-Prized-Vaca-Muerta-Shale-Could-See-10B-Exxon-Investment.html
$10 billion over 20 to 30 years, that’s going to support what? 20 to 30,000 bpd addition per year, presumably with huge declines in the first two years. If that is the best news ExxonMobil has to announce it’s time to head for the bunkers. How much money is Rex going to get when he retires next year, $200 million plus?
There has been a lot of talk on here about EVs. Usually cars, but sometime truck. Well here is a hybrid truck. That I am sure will make a few people cream their pants.
A Nat gas burning 400kw Gas turbine power source, battery pack, and all electric drive. With wait for it. 2000hp! of electric power.
They claim 100 to 200 mile range on battery power alone.
https://nikolamotor.com/one
It seems as though it has 2 x 1000hp electric motors. Now the 1000hp electric motors I have used on a regular basis, weigh a couple of ton each, and are normally used in locomotives. Not sure what Nikola are using?
PS. OFM, could you imagine driving an 18 wheeler, with 2000hp?
PS. Looks like it is 6x33o hp electric motors, direct drive to each wheel. They will still be big, especially if it is all unsprung weight!
It seems to me another possible configuration is to combine a big battery with overhead trolley bus wires on the the interstate network. Run off the wires for the majority of the journey, then battery for the last 50 miles.
Of course, it would be a big upfront cost to put high voltage wires on the entire interstate network…
Extrapolating from here http://www.tbus.org.uk/article.htm (clearly not an independent information source ) the figure rounds out to about $400B.
Not cheap, but not the most expensive investment imaginable.
Cordless tool paks drives one nucking futs – Use as necessary ..on a roof or quick yank from Truck Box. Lack of Battery standardization and Non Optional quick charging is holding back potential markets. Single stage dummy charging rates of < 1C — 1 hour charge — a big seller but a pak killer. Keeping spare paks could extend pak life to decades if you could select charge rates of perhaps 2C. Palm format battery tech is heating up.
https://chargedevs.com/newswire/tool-giant-stanley-invests-in-3d-li-ion-battery-venture/
It would be so exciting if a Milwaukee Boombox pak fit a Dewalt drill, fit a robo vacuum, etc. ISO standards anytime soon?
Hi LT, you’re not the only person thoroughly pissed about the lack of interchangeability of battery packs.
Unfortunately, the industry has settled on a sales and marketing model that makes more money selling entire tool kits using very cheap tools. Even if you could buy interchangeable batteries easily, you would find that your actual power tools are designed to last about as long as the batteries or only slightly longer. It’s planned obsolescence pure and simple.
The cell phone industry managed to avoid price competition much the same way by discounting phones to get you to buy long term contracts. But now you can buy a decent used or new phone and go month to month with equally good service for the same or less money. You can get a smart phone now at Mallwart for forty bucks that does damned near anything you might really want a phone to do.
I expect there is some hope for interchangeable batteries but it won’t happen any time soon unless the nanny government FORCES the industry to standardize.
Sometimes a government mommy is a good thing.
You can get batteries rebuilt , new cells installed, by mailing them away, and waiting a week or two for them to come back. Some people swear the rebuilders do a great job for half the price or less of new batteries. I don’t know personally.
It ought to pull away from a traffic light fully loaded about as fast as an eighties vintage sub compact econobox, lol, but that would still be a real pleasure for the driver. You could get up to speed fast enough to make the NEXT light, instead of stopping at every last light in town.
Methinks these trucks are about as scarce as chicken teeth. A few years down the road maybe…………
I don’t know a thing about the economics of long haul trucking, but doesn’t the Nikola Motors lease seem really remarkable?
Unlimited mileage, unlimited fuel, and all scheduled maintenance included for $5k per month lease?
Seems like with (2) two person teams you could keep a truck hauling 24/7/365. 48 hours on, 48 hours off, staggered.
How much is a lease on a diesel semi?
Talking and posting stuff to the web is easy.
Building a couple of trucks such as this, just a couple, would cost a hell of a lot of money.Getting a few actually built and into service would take megabucks.
A quick casual look on my part didn’t turn up any actual examples of these trucks out on the road. But I didn’t spend more than a couple of minutes looking, maybe they have a very very few actually running on the road. Getting one serviced or recharged or even refueled would be a tough proposition for now.
For now, I don’t think the technology is”over the road’ meaning long trip ready. Maybe a few years down the road? Maybe, probably not real soon. Hauling around dead batteries out on the highway means burning more diesel or gas and hauling less freight.
Trucks are subject to VERY strict weight limits. Having an extra two, three or four tons of freight on board, rather than batteries, might bring in more revenue than the operator can save on fuel.
Electrified trucks that stick close to home base and make a lot of short trips, meaning they are close to their charging stations all the time, are just now beginning sell in significant numbers, as for instance city buses. Ditto trucks that run on natural gas, the only ones on the road now, in significant numbers, are the ones used on local routes, making it easy to refuel them on a daily basis.
Give it a few years, batteries are getting better fast, and natural gas filling stations will become fairly common on major highways, because conventional diesel trucks can be easily manufactured to run on natural gas as well as diesel, or both. The only real problem is the cost additional parts.
If gas stays RELATIVELY cheap, compared to diesel, trucking companies will start buying new dual fuel trucks within the next few years. There are some new dual fuel models out there already, but the manufacturers are using them more for testing than aggressively trying to sell a lot of them.
OFM,
Just to bring a little reality to the situation. There no Nikolas on the road at the moment as it is a start up company looking for money. Somehow I feel they have gone for headlines rather than practicality.
If they have a battery pack that can do 100-200 miles on a charge, with electric motors for 2000hp, gas turbine for 400kw plus being 2 ton lighter than an equivalent diesel truck, why not just drop the gas turbine and cng tanks, cut the electric power by 80% and sell a day trip tuck as a 400hp all electric for running around town. Going by their numbers, it would be way lighter than a diesel allowing more payload.
Somehow I feel there is more sizzle than steak in this story, but it is interesting to what some people see as there concept vehicles, whether they are practical or not.
What I think would be a good idea, would be smaller electric motors in the trailer hubs. Not so much for power, but for re-gen braking. If you can get good braking for the trailer, with no lockup of the wheels, then you would save a lot of jack knifed trucks.
“Somehow I feel they have gone for headlines rather than practicality.”
My thoughts more or less exactly.
Such startups fail all but one out of a thousand, but managers can make a pretty good living out of them so long as they can attract venture capital.
Startups aren’t likely to come up with such battery packs, that would be the province of large established battery manufacturers, and tough for them.
Motors of the sort described probably don’t exist, specifically. They would have to be DESIGNED for use in highway trucks and then manufactured. Maybe some existing designs could be modified. Still expensive.
OFM wrote: “Getting one serviced or recharged or even refueled would be a tough proposition for now.”
The turbine is ‘fuel agnostic’ according to their web site, and can be configured to burn methane, diesel, gasoline, so depending on configuration, It can be refueled at any CNG station, or any filling station. As for the CNG, their plan is to establish Nikola CNG stations nationwide similar to Tesla’s Supercharger model, which is how they would include fuel with the lease or purchase.
Although it can be plugged in to charge the batteries, via a 50kW on board charger, it is really designed to be charged via the turbine generator.
The batteries act as a reservoir, and allow for energy to be recovered on declines through regenerative braking, which would also save brake wear and braking heat problems on descents. The engine can be sized and run for optimal generation efficiency, as it never directly drives the power train.
No question they are trying to attract investors, but I don’t see anything fundamentally unsound in the concept. It is similar to a train.
Not sure why they elected for hub drive motors though. Volvo was pursuing that idea but dropped it. The all wheel drive aspect is nice, but life seems harsh at the hub: water, dirt, relentless jarring. It would lose the weight and complexity of propeller shafts, and universal and CV joints however.
As for truck weight, Nikola is claiming that their tractor will weigh 2,000 lbs less than a comparably equipped truck, so more cargo could be hauled with it, not less.
Don’t imagine the horsepower.
Imagine the highway commission that will let the weight destroy the road.
http://www.wsdot.wa.gov/NR/rdonlyres/DF443726-F00D-48BA-A562-8A22F172F254/0/legalweigtchart.pdf
I’m skeptical. Why go over the top for a truck? I could understand using similar traction motors to those used for light rail, to get “off the shelf” motors. How powerful are those? Why not go for more modest specs at a lower price? Why not assemble a proof of concept using an “off the shelf” micro-turbine (Capstone) shoehorned into a standard cab and chassis? It’s not exacfly an original idea. See:
http://www.wrightspeed.com/
Island boy,
I agree the Wrightspeed sounds much more logical. 20-25 miles on battery power seems much more believable, than the Nickola’s 100-200 stated range. But at the end of the day, I am sure the Nikola or even a trimmed down version is what the EV enthusiasts dream about.
https://www.checkiday.com
Today’s holiday list:
Today is “Thank God It’s Monday” Day!
Today is Atheist Pride Day!
Today is D-Day!
Today is Drive-in Movie Day!
Today is National Applesauce Cake Day!
Today is National Gardening Exercise Day!
Today is National Hunger Awareness Day!
Today is National Yo-yo Day!
Today is Russian Language Day!
How can it be Thank God it’s Monday Day and Atheist Pride Day the same day?
The unexamined lies are not worth telling, not Socrates, but somebody must have said that too.
When is it going to be National Oil Day?
That day is August 27th.
http://blogmain.sherware.com/blog/index.php/2010/08/27/happy-national-oil-gas-appreciation-day
National Doughnut Day was last Friday, so every police person in America was happy as a clam.
har
When is national appreciation day list compilers appreciation day?
National Applesauce Cake Day and National Hunger Awareness Day?
Fracking banned Forever?
?Fracking seen increasing UK’s Gas Imports? Reported anywhere in MSM ?
“The Scottish National Party’s energy minister, Paul Wheelhouse, said he and his government remained “deeply skeptical” on the merits of fracking and confirmed that the practice would not be allowed in Scotland until there is clear evidence that it does not cause health-related or environmental harm.”
….
“The UK remains one of the few European countries that has not banned fracking on a national level. Hydraulic fracturing has been seen by many as a means of decreasing the dependence on Russian natural gas deliveries. The contrary seemed to have taken place however as Gazprom’s CEO Alexei Miller said on June 1 that natural gas exports to the U.K. have increased by 91,5 percent to 3.85 billion cubic meters in the first five months of the year.”
http://www.zerohedge.com/news/2016-06-05/scotland-bans-fracking-forever
Barring miracles on the renewable energy front, fracking is here to stay, because depletion never sleeps, and without oil, the world economy will grind to a near halt. Spendthrift irresponsible people can always afford alcohol and tobacco, even if their kids are going to bed hungry.
My best old redneck conservative buddy eventually took my word for the peak oil argument, and then said hell no to drill baby drill, buy it all on credit from exporters, and keep our own in the ground till the last.
My favorite politician is no more going to stop fracking than my least favorite one will succeed in forcing Mexico to build a border wall, lol.
On SECOND thought, he might at that, by creating an IMMIGRATION problem for the Mexicans. Even Canada might have to give a little thought to taking in excessive numbers of fleeing Americans. 😉
Seriously, some localities will probably manage to ban fracking long term, but if the resource is there, and the electric cars are NOT , fracking will be.
test
comment editor is fixed.
Devon Energy to get nearly $1 billion from asset sales
Mon Jun 6, 2016
http://www.reuters.com/article/us-devon-energy-divestiture-idUSKCN0YS0Z6
U.S. oil and natural gas producer Devon Energy Corp said it would sell assets in Texas for nearly $1 billion and that it was making progress on the sale of other assets as part of its plan to improve its finances through divestitures.
Devon said on Monday it would sell producing assets in east Texas for $525 million and in Anadarko Basin’s Granite Wash area for $310 million.
The company will also sell its royalty interests in the northern Midland Basin in the Texas region for $139 million.
With these sales, Devon’s proceeds from divestitures of natural gas-focused assets would total $1.3 billion, Chief Executive Dave Hager said.
“Proceeds for the entire divestiture program are well on their way to achieving our previously announced range of $2 billion to $3 billion in 2016,” Hager said.
The company said it expected to make an announcement within the next several weeks on the sale of its 50 percent interest in Canada’s Access Pipeline, which carries heavy oil across northeastern Alberta.
Devon also said it was making progress toward selling more Midland basin assets that produced an average of 25,000 barrels of oil equivalent per day in the first quarter.
Daily CO2
June 6, 2016: 407.84 ppm
June 6, 2015: 402.99 ppm