EDIT: The EIA updated their International Energy Statistics Monday with their January update. I spent several hours on that update, updating all my spreadsheets, updating the Non-OPEC Charts page, the World Crude Oil Production by Geographical Area page, and creating the post below. Then after I had finished all that they, the EIA, published another International Energy Statistics with the February production data. Sorry but I am exasperated, I will deal with the February update sometime next week. Below is what I prepared before that update. Anyway the emphasis is far more on the yearly numbers than the monthly numbers.
+++++++++++++++++++++++++++++++++++++++++++++++
The EIA finally published an update to their International Energy Statistics. They were over a month late. Last time they were a month late they published two months data. This time no such luck, the data is through January 2014. There was only large revision in the historical data, Canadian December Production was revised up by 298 kb/d. There were several much smaller revisions but World December production was revised up by 273 kb/d to 75,431,000 bp/d in December.
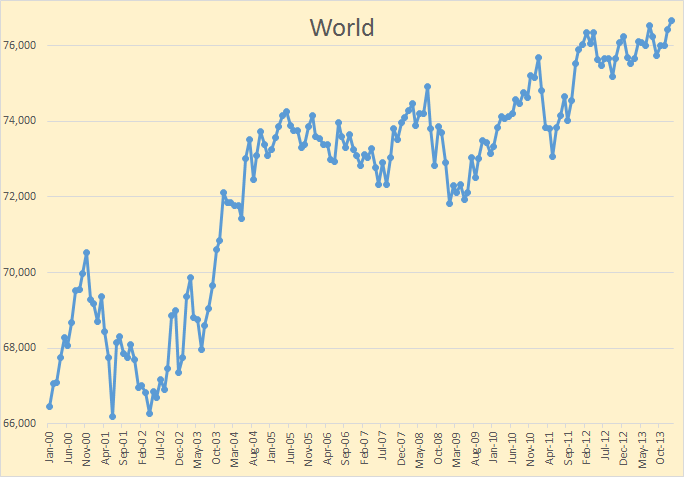 World C+C was up to 76,662,000 barrels per day, an increase of 231 kb/d over December. Average world C+C production was up only 132,000 bp/d in 2013 over 2012.
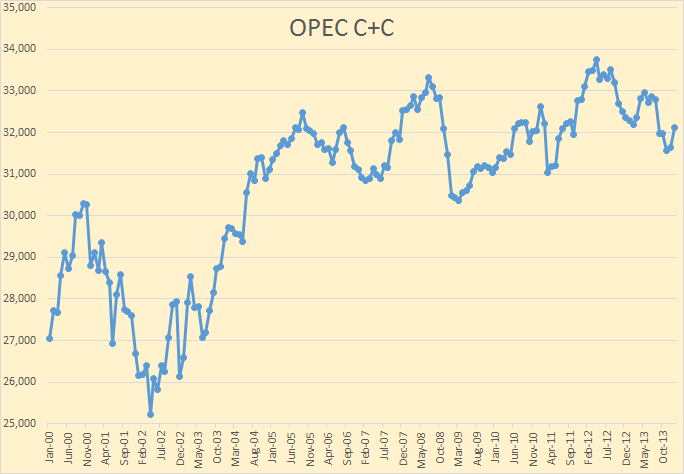
The Gain was all OPEC however. January OPEC Crude + Condensate production was up by 482,000 bp/d to 32,118,000 bp/d. This is considerably different from what the OPEC Monthly Oil Market Report reported. They had OPEC crude only production up by 147,000 bp/d in January to 29,855,000 bp/d. Understand this is crude only, not C+C. OPEC crude only seems to be holding relatively steady and stood ate 29,765,000 bp/d in May.
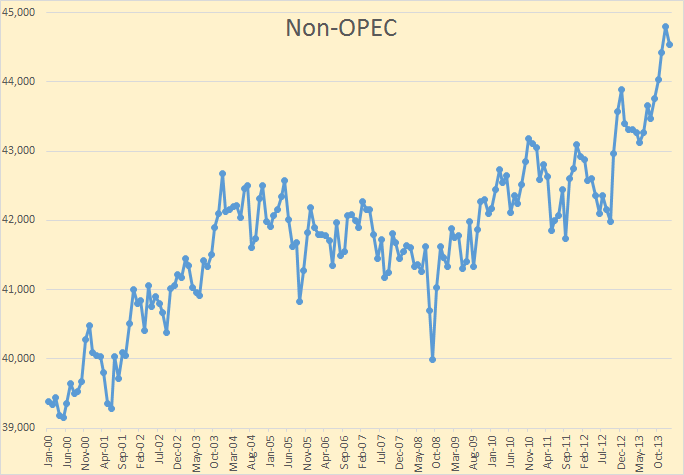
Non-OPEC C+C production was down by 251,000 bp/d to 482 kb/d to 44,544,000 bp/d in January after reaching a record high of 44,795,000 bp/d in December. With the revisions for Canada Non-OPEC C+C production was up 958 kb/d in 2013. US production was up 962 kb/d in 2013 so all the increase was due to US production. Total World C+C production was up 132 kb/d in 2013 so without the gain from the US total World C+C production was down 830,000 barrels per day in 2013.
Only two countries are showing continuing increases year over year, the US and Canada.
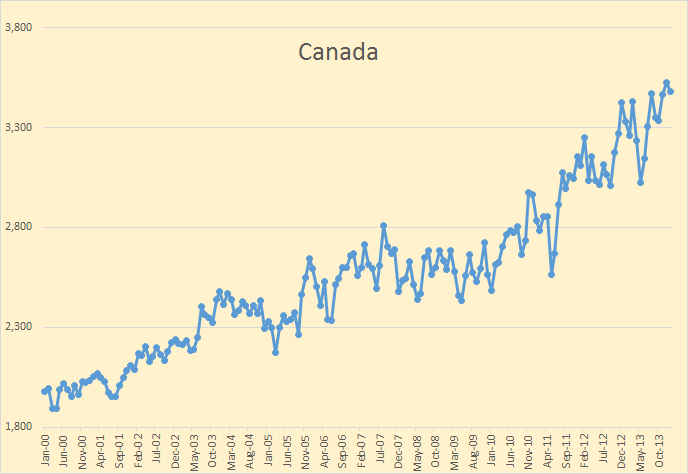
Canada will likely continue to show a slight year over year increase for a few more years then level off. However Canada is the only country that shows such promise.
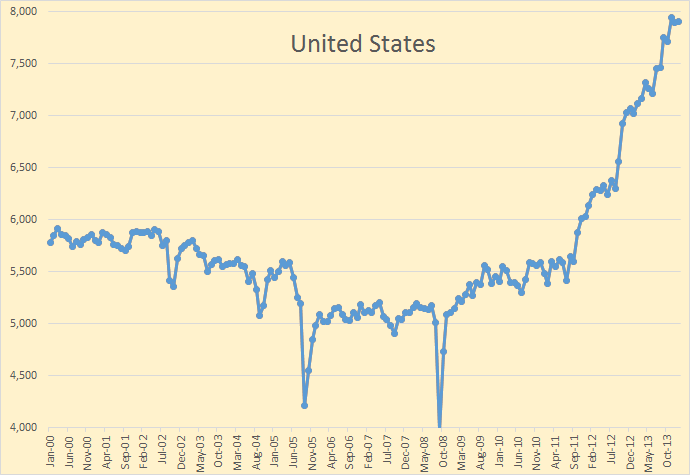
By far the largest increase in production has come from the United States. Peak Oil or no Peak Oil, it is all rides on production from the USA.
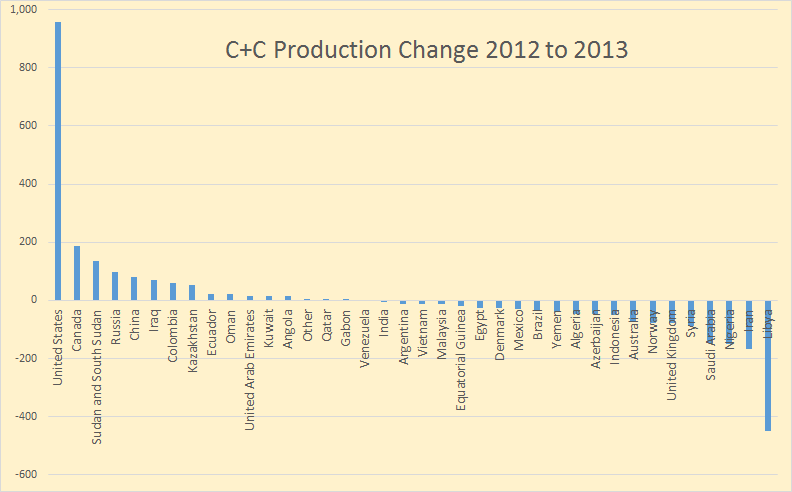
This chart demonstrates that story in spades. Of all the top gainers on this chart, only Canada will continue to increase for any length of time. All the rest, with the possible exception of Kazakhstan, will either plateau or decline in the next two or three years. Most will actually decline.
This chart represents 100% of all World production. All the small producers are combined under the titled “Other”.
Of countries that increased other than Canada and the US, Sudan and South Sudan was just recovering from political conflict. They still have some recovery to go but that could go either way. Russia, I believe, has peaked. Their average production this year will likely be very close to the 2013 average but they peaked in December and the trend is clearly down.
China and Colombia both show signs of peaking and who knows what will happen in Iraq. But Iraqi production will very likely suffer due to the conflict there.
Libya and Iran may recover but continuing political unrest will likely offset any recovery by them.
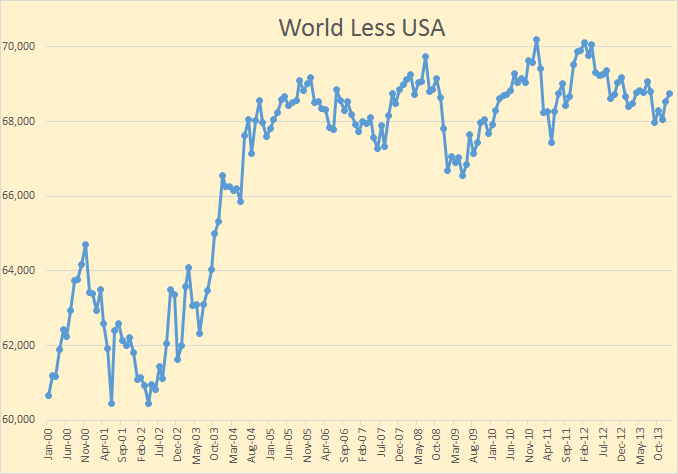
I know I have made this point many times before but I must do it again. The World less USA has already peaked. Only shale oil production from the USA is keeping the world from peak oil. But even with almost 1 million barrels per say increase from the USA world oil production was up a measly 132 kb/d in 2013. The USA does not have to peak for the World to peak, it only has to slow down slightly.
It looks like world C+C will peak either in 2014 or 2015 at the latest.
The page Non-OPEC Charts has been updated with the January data for all charts.
Also the page World Crude Oil Production by Geographical Area has been updated with the January data.
“The World less USA has already peaked.”
But the USA is part of the World. Therefore, the World has not peaked.
Dow reaches 17,000. World oil production reaches a new high. Unemployment rate drops.
Not all the king’s horses could put peak oil back on any reasonable person’s radar.
Humans are real bad with unusual or unlikely problems. Anything that’s too big is always “someone else will figure that out, I don’t even.”
In this case, plenty of humans who know better had the “someone else” being Brazil and Iraq; notably most oil industry people who aren’t talking their book and even the EIA and IEA don’t believe the fracking rise is sustainable for even a relatively short while. Brazil turned out to be overstated and infeasible, and the Iraqis have decided it’s a good time to kill each other.
I don’t claim to be an expert by any means but given the fact that production of real oil and condensate is up only a little over the last decade while the price is up five times or so might strike a reasonable person as evidence that oil is probably very close to peaking.
Changing the names of things in the middle of the game does not make them into new things.The natural gas liquids and refinery gains and biofuels are physically real but in terms of discussing peak oil no more than smoke and mirror tricks used to fool the public-and people like you into believing peak oil is not a concern.
Net energy is the real issue at any rate and counting a million barrels of ethanol as a million barrels of oil is a joke to anybody who passed freshman chemistry.The energy content is only about seventy percent of real oil.
Then if we have the freshmen accounting majors to run the books on ethanol and deduct all the diesel fuel and natural gas and coal and wind energy put into raising the corn and hauling it around and distilling the moonshine the net energy content falls even further.
The natural gas liquids that were formerly called natural gas liquids a decade ago were not dumped and allowed to evaporate to get rid of them as a rule. They were shipped to market and used to manufacture many products.Those same products were not considered to be made from OIL at that time.BUT now we make them from OIL according to the new definitions.Thus the SAME amount of oil is no longer ”enough” which perhaps has SOMETHING to do with the price of it rising so sharply.
Humpty Dumpty said that words meant exactly what HE said and intended them to mean.
Humpty DUMPTY had a great fall and all the kings men and all the kings horses could not put him together again.
Anybody with the brains to balance a checkbook and understand that,one, oil comes out of a hole in the ground , and two , that it does not rain oil, cannot possibly fail to realize that oil MUST peak and decline.
Anybody with a moderate amount of common sense should understand that a five fold increase in the price of a commodity over a decade or so with a very minor increase in production over that same period is ample indication that the resource is getting to be in short supply.
Now of course if you are mainly interested in just winning arguments you can call moonshine a petroleum liquid as does the inestimable MR LYNCH of cornucopian fame.You can call deuces aces if you are in making up the rules as you go.
You can even call synthetic liquids made from coal ” petroleum ”. If you have enough diplomas on your wall and enough impressive sounding positions listed on your resume you can fool people who are not paying attention.
Both diesel fuel and gasoline can be made from coal if you are willing to pay the price of doing so.
But instead of this being evidence of peak oil being a fallacy it will be evidence of peak oil to anybody who has even the brains of a mule once it becomes a widespread industry.
You my friend would do well to consider the parable of HUMPTY DUMPTY.
There is a state park in Pennyslvania where the oil industry was born.I hope to visit it someday.The hole ran dry doncha see?
Now I have bothered to make this extensive reply not because I give a hoot about your opinion but because this blog will be read on many occasions by people who are just now getting to be interested in peak oil.Some of them will be school kids. Some of them will be community leaders and scientists later.Some of them will be folks thinking about buying a new 6000 pound four by four truck. Maybe they will come to understand that gasoline is apt to be up a couple of bucks before they get it paid for.I am still driving a 91 that costs four times as much to fill it up today as it did back then.But at least it is paid for.
I want to do what I can to stimulate people to think and to show them how facts and figures can be twisted into pretzel like arrangements that can fool the unwary.
Thank you for setting the stage for me and demonstrating how easy it is to jump to conclusions that might be technically correct but nevertheless apt to lead one to making very bad decisions on occasion.Like maybe investing in an airline or a resort dependent on air travel. The cost of fuel is now the biggest part of an air ticket’s price IIRC.If oil doubles again how many people will have to give up or cut way back on flying?
IT will keep on going up until the price of it breaks the back of the economy thus preventing further price increases.
Yep. Peak Oil is a fact. We’re really just deliberating the arrival date. Other forms of energy will be discovered, used and exploited but NONE will match the liquidity, density, storability, and economics of oil. THAT is why we are in trouble, because nothing can replace oil.
Oil Creek State Park is a great place. Everyone should go there. When I first went about 15 years ago I happened to meet one of the personal that managed the Drake Oil Well exhibit. I commented briefly when the day would come when we would RUN OUT of oil and he replied at length about the issue of Peak Oil even though he didn’t call it that. I actually didn’t understand what he was talking about at that time because it was beyond me. I had a whole slew of answers and fallback reassurances that things couldn’t be as bad as what he made out to be. I understand now: The tap is to small. There won’t be enough to go around. There won’t be enough to sustain our standard of living. The economy will collapse.
I also have relatives that work the off-shore oil of Louisiana coast. My nephew has specialized in contracting work in Pennsylvania, Africa, Alaska and elsewhere. As the Oil became harder and harder to find and to exploit he acquired skills that made him very valuable in other diminishing or exploiting fields of oil. I think he would just like to live and work in Louisiana but the skills, money and oil take him elsewhere.
In 2013 the world was using about 76,000,000 barrels of oil a day(Crude Oil including Lease Condensate only). If we divide a day into hours, minutes, and seconds we come up with 86,400 seconds in a day. Divide the total barrels by total seconds and you have 879 barrels of oil being consumed every second of every day. Every time we blink our eyes another 879 barrels of oil are gone.
If we take that same figure of 76,000,000 barrels of oil a day and times it by the days of one year (365) we come up with the fact that the world consumes 27.7 billion barrels a year. So when the news announces discovery of a possible basin of 15 billion that is four miles down and eight miles out of the coast of Brazil I just laugh.
There’s no way that we can grow enough corn, mine enough coal, or build fast enough or safe enough nuclear reactors to offset that amount of daily consumption of oil. There aren’t enough hurricanes to supply the wind power and the United States would need a solar panel the size of California to meet it’s energy needs. In fact the AGGREGATE of ALL other energy sources couldn’t make up for our daily consumption of oil.
Oil Analogies
When we think of oil, we picture the gas tank analogy. When the needle reaches E for empty is when we are in trouble. The world does in fact have a trillion barrels of oil left to produce. The real analogy is like a Pearl Harbor reconnaissance plane flying its mission over the ocean. The plane flies as far as it can for as high as it can. The pilot fulfills the mission of aerial photography of enemy positions. At a certain point though the pilot knows he must turn around at the HALF WAY point of the gas gauge to make it back home. When the needle reaches at half the tank the pilot MUST RETREAT and DESCEND to make it back to base. When the world has produced as much oil as it will ever can in one day (peaked), when it has flown as far as it can for as high as it can the world economy MUST RETREAT and DESCEND.
Thanks
P.S. The definition of a self preserved black box is beliefs that don’t mesh with the rest of the world(Reality).
The Dow is not really a measure of anything except in the very short term. And then it is just noise.
Ilambiquated says: “The Dow is not really a measure of anything….
Dear Ilambiquated: The Dow is the measure of the Largest Ponzi Scheme ‘Living Beyond ones means’ ever perpetrated.
By the way, check this link. It’s outstanding! It addresses Anon ‘s statement…. as well as many other issues. I believe most of you, if not all of you, will enjoy.
https://www.youtube.com/watch?v=8BK0XIm0DXE
Not all the king’s horses could put peak oil back on any reasonable person’s radar.
You are saying that any reasonable person would see the US continuing its current increase rate into the distant future, so far that no one could anticipate it on their radar?
I think your reasonable person is being very unreasonable. 😮
Ron,
Great charts, especially the one showing the change from 2012-2013. Yes, you are correct, the U.S. Shale Oil Bonanza is keeping the world AFLOAT. However, as soon as we start bringing on that Oil Shale from the Western States, we can go back to driving around in those 1970’s five-thousand pound Lincoln Town cars.
Lastly, I noticed a lot of CHIT-CHAT on the Climate Change Issue in the previous blog post. I would like to kindly remind everyone here (I know Watcher would agree) that this is a PEAK OIL BLOG… so let’s just remember that. Let’s keep the Climate Change/Peak Oil ratio as low as we can.
That being said, I just spoke to one of the top Climate Scientists. He told me secretly (at a Starbucks at an undisclosed location) that in fact they are FUDGING THE DATA. He said, he had his grandchild use some red crayons to color in the graphic below to make it look like the Arctic was much WARMER than it really is.
I had no idea it was that simple. Silly me.
steve
Actually… that should read… THE OCEANS & EARTH much warmer than it really is. We all know we are actually heading into a new ICE AGE. Pretty soon, it will be hard to cover up all the BLUE AREAS with a RED CRAYON….
know what I mean?
steve
Do you have any idea what you’re talking about? You’re trying to discount AGW with talk of crayons? Usually your posts are very informed, so my suggestion is to stick with peak oil and avoid climate change.
Peak Earl,
Shhhhhhh. Between you and I…. I am just making a FUNNY. You know… a mockery, a spoof, a parody, a put on, a lampoon of the situation. Do you really think a RED CRAYON is going to alter evidence?
LOL… Steve
Perk sees your funny and raises you one.
Maybe you missed the fact that those colors are based on forecasted temperatures from a model, not actual temperatures?
They are not “fudging” any data, they just present the data from their models. And there is a discrepancy between real world temperatures and forecasted by the model temperatures.
But now I see where the confusion comes from, it is clearly labeled but still missed by the wider audience.
Dr,
It’s all in the CRAYONS.
steve
Clearly SRSROCCO is part of the EVIL CRAYONIST CONSPIRACY. (ECC)
The ECC is not new they have been congregating at denialist sites for years.
Here is a link to some of their earlier propaganda
http://hockeyschtick.blogspot.kr/2013/11/hansens-nasa-giss-data-confirm-arctic.html
Hansen’s red CRAYON can be used much more in the Arctic if the cherry-picked baseline is the global cooling scare years between 1951-1980, as Hansen did in the above figure. If the Arctic’s warmest years of the 20th century between 1920-1940 were used as the baseline instead, the Arctic would show little temperature change or possibly even cooling.
Jeju,
Wow… I forgot to include the BROWN CRAYON. Looks like a lot of coloring took place on that graphic.
steve
Everyone,
I gather some people actually take me serious. If you have been reading more posts in here for the past 9 months, I am serious about PEAK OIL and CLIMATE CHANGE. However, I realize most people are going to take to present assumptions to the grave.
So, that being said, sometimes we have to take time to laugh and enjoy a bit of satire. I see the future unfolding in a very dark way. I am not a pessimist at all, but rather pragmatic.
Those who know me also realize I believe in the precious metals. I am not a Gold-Silver Bug because it’s trendy, but rather due to the metals ability to protect wealth. Many people do not believe in the precious metals… and I can’t blame them. 40+ years on a total fiat currency system can make it seem like it will last forever.
When the Dollar goes the way of the Dodo Bird, there will be a lot of Americans totally wiped out. That is the real shame.
steve
There already exists a fine site for those interested in PEAK OIL and GOLD BUGS here
http://www.peakprosperity.com/
It would indeed be unreasonable to think that the US could “continu[e] its current increase rate into the distant future,” but then I never said that would happen.
The fact is, though, that the future (which is here now) has brought exactly the opposite of what the peakers were howling about 9 years ago. And the increase came from the poster child for the reality of peak oil–The United States! The irony is delicious.
I’m a peak oil troll from way back. In 2005 or so, it seemed perfectly “reasonable” to assume that things would unravel presently, given the alleged “peak” that occurred that year. But then no one foresaw what was coming in the Bakken and other fields in the US.
What else cannot be foreseen? Where will the increase come from next?
No one knows, and I don’t worry much about it anymore, though I do enjoy coming to this site every once in a while to see how the “peak” is faring. This site is at least fairly rationalm unlike many sites from 5 or so years ago.
After I renounced religion, I used to like to go to Catholic churches on High holidays and sit in the back during Mass. The music is nice.
There was nothing wrong about the 2005 peak. Hubbert curves are functions of reserves; what was peaking did not include LTO. With how the US & Canada – and increasingly just the US – have been the only reason there is net growth and neither is doing it with conventional reserves, it’s perfectly valid.
We have just been holding the line – at several times the price – by replacing cheap production with expensive production and US demand with Chinese demand. In the meantime, all the capitalist incentive in the world has not come up with any new cheap fields or net production gains outside of tar sands and shale.
China demand IS American demand.
China borrows its funds from Wall Street just like Americans do. There are more Chinese than American so they crowd out the US borrower.
When US companies sent jobs to China, they also sent US demand and credit-worthiness. What we are stuck with are the food stamps.
However, Chinese are no more credit worthy than Americans, the entire idea of ‘worthiness’ is a scam. The Chinese cannot afford high energy prices any more than anyone else. Why? Because they use the same energy-waste infrastructure as everyone else. The more China wastes, the faster the country fails. More cars = more ruin and faster, too. Meanwhile, real price for crude climbs relentlessly.
Only cure is conservation. Without conservation there is force of events; ‘conservation by other means’ ™
“What else cannot be foreseen? Where will the increase come from next?”
It will come from anywhere where there is oil to be extracted at higher costs. And those costs are slowly killing the global economy. Of course, a lot of people in the USA don’t see it, as the US’s imperial status shelters them from the consequences. There was nothing wrong about the peak oil predictions, it’s just that the effects are most visible outside the US, and that distorts the view of mostly US-based observers.
Annual Global E&P spending on oil and gas tripled in the last decade, and global production went up about 3%, all while oil prices went up fivefold. We can perhaps increase oil output a few more years as long as we’re willing to put with more such logarithmic increases.
Where will the increase come from next?
We who have spent substantial amounts of time eagerly looking for this place await your words of wisdom.
We have noticed oil companies drilling in a mile or more of water and another three miles below that. We have noticed them trying to drill up in the ARCTIC.We read about the most advanced search techniques being used extensively on ground the searchers have been over time and again already.
Sooner or later the kids find all the Easter eggs. They are finding less every year now and have been finding less every year for decades. The tight oil American companies are producing domestically was discovered about half a century ago.
Do you know what the average depletion rate is of the worlds existing producing giant and supergiant oil fields is?
Just asking. I never see any of this info when I occasionally visit cornucopian sites relating to oil.
Do you know how long it has been since a supergiant conventional field has been discovered? Or how long it has been since a conventional giant field has been discovered?
Have you ever noticed that the the Limeys are buying back oil at five times the price at which they sold their North Sea one time gift of nature?
So are we still importing around six million barrels a day net here in the US.
Now if it were possible for the world to run on oil that costs two or three hundred dollars a barrel it would probably be possible to keep on increasing production for a good long while yet.Prices in that range are what it is going to take to mine oil shale and process it and convert it into delivered oil.
I don’t usually put too much faith in what economists think because they tend to be happy go lucky types when it comes to such question but I don’t know of ANY economist who thinks the economy can support oil prices much higher than they are already.
And then there is one absolutely critical metric that is seldom mentioned even at sites such as this one- production per capita world wide. It has been falling for quite sometime even as the poorer half the world has set it’s heart on owning an automobile and a refrigerator and tv set.
I am quite sure a lot of people will buy oil at $300 a barrel. Every farmer in the world. The diesel I put in my car at $8.50 a gallon is equivalent to $357 a barrel.
However, my car does much better than 50 miles to the gallon and I cycle to work partly to save money. The total demand for $300 oil is a lot less than for $100 oil, but it is still enough to actually keep the tractors and food delivery trucks running. However, I don’t think the downslope will be smooth. The rest of the economy is so predicated on cheap energy that it is guaranteed to implode first.
$300 oil is not cheap enough to keep the car and diesel truck industry in business. Highways are falling apart w/ crude at $100/barrel. There would be no taxes on fuel or driving if it cost $9/gallon.
Almost every aspect of petroleum use (waste) is subsidized. Factories and infrastructure are paid for with debt. Highways and cars are paid for with debt. Debts are paid for with debt, so are interest costs and fees. Military forces are paid for with debt, so is Finance, Insurance and Real Estate industries. The industry that is failing is the debt industry.
The Minsky Moment arrives when the total debt load denominated in a currency cannot be serviced by more borrowing. We are there or near to it. Afterward = no borrowing; no petroleum or waste, either.
I have often remarked myself that I could afford twenty dollar a gallon diesel fuel easier than I could park my tractors and go back to farming with the horses and mules that I learned to work as a kid at the very tail end of the horse and mule era.I am not old enough to remember when we did not have a tractor but my parents and grandparents still had horses and mules – kept for old times sake and used for gardening – as well as tractors which were used for the real farming as far back as the mid thirties.I can just barely remember some real work being done with a mule such as cultivating a large field of corn.
There is a zero possibility of going back without the human population suffering a catastrophic crash.We will farm with diesel and natural gas for the foreseeable future no matter how expensive it gets because we have absolutely no choice in this matter.Tractors and combines have to be fed only on the days they are used. Horses and mules have to be fed every day no matter what.
They can be fed on locally produced biofuels using less land than is needed to raise feed for draft animals in addition to being many times as efficient in terms of the farmers labor.
NO CONTEST.
Steve commenting below is right about three hundred dollar oil destroying the auto and truck industry. I guess maybe we could still deliver potatoes to rail roads with trucks burning twelve or fifteen dollar diesel and from railroads to local stores but that would be as a matter of survival rather than life as we know it.
Nobody would be driving to a supermarket alone. A whole block of people would have to organize a community shopping trip in a large van or maybe groceries could be ordered and delivered on a route by a small hybrid or electric truck.That way maybe fifteen or twenty people could get their groceries while using as much oil as one or two driving themselves.
But the unemployment brought about by 300 dollar oil would also bring about troubles ranging from a police state right on up to WWIII.
You have a way with words, OFM, even if sometimes you may not realize it (my elipsis added for effect):
“I learned to work as a kid at the very tail end of the horse and mule… era”
I’m glad that you have renounced man-made religion but that doesn’t mean that there isn’t a God, Purpose, Meaning or Values. Atheism is no less a philosophical position than any other religion.
Unless you are prepared to make a formal declaration that Peak Oil will NEVER happen you and I are in the same camp. The fact that yours and my expectations of the projection didn’t occur as scheduled doesn’t mean we were wrong. It just means those projections were premature and without all the available facts.
As we survey the immediate future we can make another projection: that it currently appears(on known available facts) that unless we can exchange, swap out, discover, build or are given a total replacement for oil(as in portability, energy density, volume) in the next ten years(the time necessary to swap out a new infrastructure)our civilization will fail.
As we approach 2024 we can modify our projections if we are still here.
“The essence of the Liberal outlook lies not in what opinions are held, but in how they are held: instead of being held dogmatically, they are held tentatively, and with a consciousness that new evidence may at any moment lead to their abandonment.”
– Bertrand Russell
Thanks.
Atheism is no less a philosophical position than any other religion.
I agree that atheism is a philosophical position, religion is not. Atheism is philosophy, religion is superstition. There are different positions in atheism. Atheism, or at least my atheism, does not deny that something else, some higher intelligence, might exist. I just state that no god created by man exists. All holy books and their gods were created in the mind of man. And whatever exist, if anything, I would not refer to it as “god”. The word “god” implies a being who rules, or reigns. That is “He”, (“God” implies a being of male gender unless “Goddess” is the term used ), sets rules that must be followed else his subjects will suffer after death and those who obey “His”, rules will be rewarded.
Peak oil is a lot closer than most people, even most peak oilers, believe. I have stated that it will happen no later than 2017 but I think the odds are that the peak will likely be 2015, or sooner.
And “Athiesm is no more certain than any other science.”
This is why I phrased it as God, Purpose, Meaning, and Values. I too disbelieve in an anthropological God. I don’t particularly believe in any book, man, or mecca. There is no person, place or thing that is absolutely sacred. I agree also that the word God is an absolutely loaded word that carries with it all kinds of connotations and meanings that are mostly superstition.
Modern science too has its claims that I find hard to believe or understand. The claim of an anti-matter world or time travel, or multi-dimensionality appear no less to me than new superstition. The realization that man’s participation in supposed external objective experiments has an effect on the outcome is a legitimate questioning of reality(where does the reality begin and end). The fact that scientists too are fallible, human, prone to error, greedy, lustful, power-hungry and deceitful appears to signal that things really haven’t changed much.
Anyway, peak oil. In replying to Magenta I stated an outside scenario of 2024 being my personal high side time of the effects of Peak Oil occurring. I actually believe that peak oil will be here in full by 2017(if I have to choose a hard date). Since we are all in the same camp and since reality is constantly evolving(what a scientific word) maybe we could discover a couple new super-giant oilfields(I doubt it) or some other new energy source(I doubt it) but I would never be so certain as to actually bet on it.
“There are no unnatural or supernatural phenomena, only very large gaps in our knowledge of what is natural“
Edgar Mitchell
Apollo 14 Astronaut
Science does not claim that time travel is possible at all, exactly the opposite. It does state that time slows down as you approach the speed of light and that time moves only in one direction.
You have to be very careful because when some people say “science says” they are telling a damn lie.
The term antimatter is a misnomer. It is not anti-matter at all but it just has the opposite charge as regular matter. That is all atomic particles have the opposite charge. The electron has a positive charge and the proton has a negative charge and so on. And it is very real, not superstition.
Ditto for multi-dimensionality. Just because you cannot understand it does not make it superstition. Of course scientists are fallible and human, that is why we have “peer review”. And understand that peer reviewers get none of the glory for any new discovery so they have no reason to lie.
I think you are way too suspicious of science. Science sometimes gets it wrong but that does not make it deceitful.
Yes 2017 is the big year for peak oil I think. I believe production will peak in 2015 or 2016 but it will be 2017 when the shit hits the fan. That will, I believe, be the year of the crash of the stock market as well as many economic hardships around the world. That will be the year when few if any deny that we have have a very serious problem that “new technology” cannot fix.
I am suspicious and I am cautious. Your explanations sound reasonable and I would in fact err to the side of science more than most things. That’s part of what makes it so hard to really try to figure some things out is because there are many good, earnest and sincere people in science and religion.
Regardless of science, religion, or reality the Peak Oil horizon is at our doorstep. As we stated, it is very imminent and real.
Thanks.
And thanks to you. I got to thinking about it and you mentioned “anti-matter world or time travel”. These are favorite subjects of science fiction but not science. Antimatter is real but science, to my knowledge, has never claimed that there are entire worlds made up of antimatter. And the idea of time-travel has been disputed by science even though it is one of the favorite subjects of science fiction.
I am aware that it’s also called dark matter. There is also dark energy and dark flow. I did use the word “world” as in singular, which would appear as another world separate from the viewable universe. You indicated that it is just the negative of the positive world.
Wikipedia has this site with a diagram/picture of the universe that includes proportional estimates of matter to dark matter and dark energy.
http://en.wikipedia.org/wiki/Unsolved_problems_in_physics
According to their claim the universe might be made up of 26% dark matter and 68% of dark energy. How they got this I have no idea.
I heard this same claim from others across the internet that the universe we know of and see is exceedingly small compared to what we don’t know and what we can’t see.
The only reason I suggest that modern science is analogous to superstition is because of the sheer magnitude of the gigantic claims being made as possible reality scenarios. Besides time-travel and multi-dimensionality there is the idea that the world is just a hologram. What other group has the audacity to have discovered the “God Particle”? That language should have been shot down from the very beginning.
Actually I feel that like mankind can observe an infinite external world the internal reality is limitless and infinite also. No matter how far we search for the smallest reality it just never ends.
The so-called peer review can be real and effective but it can also be self-serving. How many times have groups (scientists or any others) just gone along with the crowd? How many have their egos and their careers at stake? How many are afraid to speak up or speak out about their own spiritual inclinations and ideals? How many scientific discoveries were initially shot down because it didn’t just jibe with what the status qua wanted?
The peer reviews can just be another version of the church board sanctioning (echoing) the words of the minister. Science can frequently have its own “congregation.”
I’m not trying to be argumentative it’s just that like any book, person, or place; any group too can have a constellation of a self-group mind set rules that blinds them to the truth(or truths).
Besides time-travel and multi-dimensionality there is the idea that the world is just a hologram.
I think, PeakOilIsHere, that you are confusing science with science fiction. And for sure you are mixing them. Multidimensionality just states that there are more than four dimensions, that’s all, nothing more. And that is a very real possibility. Yet you mix that up with the silly concepts of time travel and “world as just a hologram”. They are not even remotely related. Do you think it makes valid science concepts less valid if you mix them with very silly science fiction concepts?
And the God particle? Jesus, you are out in left field here. No one is claiming that it actually has anything to do with God. They could not call it the “Goddamn Particle” so they just called it the God particle. It is just the Higgs boson they are talking about, it really has nothing to do with God.
The God Particle
Lederman explains in the book why he gave the Higgs boson the nickname “The God Particle”:
This boson is so central to the state of physics today, so crucial to our final understanding of the structure of matter, yet so elusive, that I have given it a nickname: the God Particle. Why God Particle? Two reasons. One, the publisher wouldn’t let us call it the Goddamn Particle, though that might be a more appropriate title, given its villainous nature and the expense it is causing. And two, there is a connection, of sorts, to another book, a much older one…
And I completely disagree with you on peer review. Scientist, in general, just hate to “go along”. They absolutely love to shoot each other down and by doing so become “king of the hill” so to speak.
I think you are far too suspicious of science. Look at the world you live in. Then compare that with the world of just 100 years ago. That is what science has accomplished.
Of course that is a curse as well as a blessing. It has enabled us to feed many times the people, keep many who would have died alive, and employ people in the industry that gives us all this junk. Science, and fossil fuels, have enabled the population to explode. Read about it here:
Of Fossil Fuels and Human Destiny
The problem with unforeseen great things happening to save the day is that when you maneuver and make decisions in such a manner as to **buy time** for those great things, you’re also buying time for bad things.
The bad things even have some extra special appeal — the decision makers knew all along they were just buying time and hoping, and now they’ll have something to blame the failure on, other than themselves.
And, the bad things are just as likely as the good things.
Hi Watcher,
Probably true. There are certainly unintended consequences and both bad things and good things will happen whether intended or not.
The comment above was supposed to be a response to the comment linked below:
http://peakoilbarrel.com/eia-world-crude-condensate-production-update/comment-page-2/#comment-44276
Magenta, what do you think is going to prevent oil production from peaking? $200/barrel oil, or do you think they are several more cheap-to-extract supergiant fields just waiting to be discovered?
Did I ever say anything would prevent oil from peaking?
I was commenting on the utter error of the peakers in the past. Current events are the exact opposite of what they said they would be. Which is why peakers don’t have much credibility with me anymore, even though I acknowledge that oil will “peak” “one day.”
But when that day arrives, perhaps no one will even care by then.
Did I ever say anything would prevent oil from peaking?
Yes you did:
Not all the king’s horses could put peak oil back on any reasonable person’s radar.
At least that’s how I interpreted the above comment. Meanwhile it’s not an unreasonable assumption to believe that peak oil will happen before 2020.
Proportion your beliefs to the evidence.
The much-ballyhooed hypothesis that oil would peak and decline rapidly circa 2005 has been falsified. But like many a prognosticator found to be wrong, peakers just move the goal posts forward:
…if there’s one characteristic of the crank, it’s what I like to call the “I’ll show you!” phenomenon, or, as I’ve sometimes called it, the “vindication of all kooks” principle. Basically, it’s the delusion from which nearly all cranks suffer besides their other delusions, that one day their quackery or pseudoscience will be vindicated. On that day, their enemies will be forced to admit that they were right all along and abase themselves in embarrassment and atonement. On that day, the crankery, whatever it is, becomes mainstream science that everyone appreciates.
Source: This is a post about homeopathic quackery.
As I understand it…straight petroleum production peaked in 2005. Plus the addition of condensate to total production numbers shows a slight rise in petroleum production since that time. Further inclusion of all liquids including gaseous (light) stuff from LTO and ethanol adds to the current levels above 2005 totals. If there is a movement of coal to liquids the number may increase some more.
This seems like the Peak to me and I don’t see why Magenta is gloating? We have been given some ‘gentle adjustment’ time to prepare and transition. While I am no apocalypse doomer, it seems pretty straight forward that our very well-fed and luxurious way of life will be changing soon. Govt. revenues, for all Governments, are shrinking. The pie is being divided up in more pieces than ever. Where I live in BC our Govt refuses to run a deficit. As a result there has been much upheaval in all expected services; from cuts to the ferry system and a current acrimonious strike in K-12 education. Nursing contracts are next up and everyone expects that one to be another bitter set of negotiations. There simply isn’t any money to spread around as we are accustomed to.
When I was a kid growing up in the 60s our Provincial Govt departments had so much money they were like kingdoms….building all manner of infrastructure and services. Like the boiling frog the gifts are drying now up, slowly….some notice the changes and some don’t. However, almost everyone I talk to rails against the new prices for groceries and fuel. People are poorer, while on the surface it looks pretty flush mostly due to increased levels of personal debt. This is the Peak…in BC Canada, where we are doing pretty good compared to others. This year our feds will have a balanced budget and as mentioned, our Provincial budget is supposed already balanced.
http://www.fin.gov.bc.ca/PT/dmb/ref/debtSummary.pdf
“Due to government’s debt management strategy, the
taxpayer-supported debt to GDP ratio will peak at 18.5 per cent in
2013/14 before progressively declining to 17.8 per cent in 2016/17”
Washington State is almost the same at just over 18%
Canada is at 85%
USA is at 106% (stats courtesy of CIA on wiki)
With the Undulating Plateau upon us, I call it entering Peak….(JHK calls it the Long Emergency), individuals that continue to build debt are living foolish. Stats indicate there is some very modest increase in energy production, but looking at the ELM numbers and forecasts this will never improve despite additional fracing and offshore. This is the decline and if slight number adjustments dispute this then what exactly is this pain people are feeling at the pumps and the grocery store?
Paulo
Hi Paulo ,
While I agree with you whole heartedly about living high on the hog by accumulating debt I want to point out that debt judiciously used is a very useful tool especially if you use it to lock in the availability of increasingly scare resources at a low interest rate.I for instance just recently bought a nice tract of well watered farm land on credit with a very small down payment from a neighbor on very good terms no real estate agent no bank fees etc.
Given the fact that the population is growing and that we are losing farmland at a blistering pace due to sprawl ( not as fast as formerly of course but every time a farm is subdivided even to children by older parents some land is usually lost to farming) farm land is good investment that can be rented for enough to cover the taxes and bring in a small income especially if it can be easily irrigated.
Some things are almost for sure cheaper now than they ever will be again at least so long as business as usual holds up and bau is going to outlast me more than likely.
Deflation may hit housing and it may hit the stock market but so long as people continue to eat and the climate continues to get hotter and drier in the worlds breadbaskets farmland in small tracts located near towns will hold its value.
Some of my neighbors are profitably growing potatoes for the first time in many years. The cost of shipping them from Idaho or other big potato states has gotten so high due mostly due to the price of diesel fuel that local guys can now under cut the delivered price of shipped potatoes even though we don’t get as many bushels per acre.
Inflation is going to pay for that tract of land for me for the most part.
There just isn’t any way the federal government will allow prices to collapse across the board. Any body who doesn’t understand this has never known a bunch of people who get welfare checks. The govt will extend the checks to the extent necessary to support prices even if it means writing a check for x thousands of dollars to each citizen. The money is after all in the end only electrons and electrons are available in increments of powers of ten just by pushing a key on a keyboard.
But that land is real and when I pay it off I will be paying it off in severely depreciated electrons.
BUT anybody who buys even farm land on credit better be sure he has the ability to make the payments.In the last resort I can make mine with my old age welfare check aka Social Security.
Yeah, you are right on that OFM. I should have said accumulate debt for frivolous things (like over-the-top weddings instead of a house down payment, toys, all inclusives, etc). I have always marvelled (and posted before) when did working guys develop the need for luxurious tropical vacations? Or huge trucks with tow behind luxury homes? My dad would have just shook his head if he saw me do that.
I quit formal work at 57 because I had no debt and live in an affordable place. While I now work harder than ever, it is for building up our land, house, or working for cash or trade. Now, when I try and do a 10-12 hour day, I hurt for a few days and limp around. The production days have been substituted for more careful and deliberate puttering. My friends in town are waiting for the magic retirement moment which never seems to come. One, they live too rich with travels…(just have to fly to NY and see some plays or go to Paris or Mexico). The other thing I have noticed is that if they stopped work they wouldn’t know what to do with themselves.
Debt…I am mulling over the idea of going into debt to buy our neighbours place when they are too hold to stay in the house. We have first consideration, and it is a wait and see type of thing. If this Plateau continues we may do it? Don’t know.
Paulo
Hi All,
The peak may be soon, but the decline may not be as steep as many people think, unless there is a severe World recession or other shock.
Using Jean Laherrere’s analysis as a starting point, I did a Hubbert linearization on World C+C output minus extra heavy (XH) oil (from Canadian oil sands and Venezuela’s Orinoco belt) from 1992 to 2013 which points to a URR of 2500 Gb for crude less XH oil. I use Laherrere’s URR estimate for XH of 500 Gb which results in a C+C URR of 3000 Gb. This compares with Jean Laherrere’s C+C URR estimate of 2700 Gb.
The depletion rate for estimated producing oil reserves has risen from 3.4% in 1994 to 3.9 % in 2013, I assume in a medium scenario that the depletion rate continues this rate of increase until 2030 when it reaches 4.2% and then remains at this 4.2% level indefinitely. The depletion rate rose as high as 5.8% in 1973 and as oil supplies run short there will be pressure for the depletion rate to rise as oil price rises.
Chart for Medium scenario below using Webhubtelescope’s Oil Shock model.
Same model as above with shorter time scale on x-axis (time in years). Only World C+C model is shown, chart below:
A lower scenario with depletion rates falling from 3.9% in 2013 to 3.4% in 2027. Note that 3.4% is the lowest level of depletion rate from 1960 to 2013. From 1991 to 2003 the depletion rate was 3.4 to 3.5%.
This depletion rate is based on an estimate of mature reserves which is similar to proved producing oil reserves. After 2027 depletion rate is assumed to remain at 3.4% until 2060 and then rise slowly (only reaching 3.5% by 2100. Note that I do not think such a scenario is realistic unless we assume there will be a severe economic recession in the near future. This is possible, but by no means certain. Chart below.
A more optimistic World C+C “high” scenario is presented below. The depletion rate increases at a similar rate to the medium scenario until 2060 when the depletion rate reaches 5 %, this also is not that likely in my opinion and reality is likely to fall somewhere between the high and low scenarios.
All scenarios (low, medium and high) have a URR=3000 Gb for World C+C.
The IEA 2008 World Oil Report concentrated on defining future decline rates. They published a production-weighted average decline rate worldwide of 6.7% as of 2007. This is predicted to rise to 8.6% by 2030 as more and more old giant fields pass their plateau and start to decline, and the long tail of global production shifts to smaller more rapidly depleted oilfields. In a more recent World Oil Report IAE stood by these predictions. The IEA have always made highly conservative predictions.
I know a number of Petroleum Engineers working in various parts of the world, all of whom concur that production in plays with which they are involved is being “forced” and that reservoir longevity will suffer accordingly (in some cases drastically).
The North Sea (perhaps the only area from which we have reliable data) production has been in free fall for some time and plays such as the North Slope are obviously being “forced” to keep the TAP viable though annual depletion still averages about 6.5%. Many major deposits are being creamed, including Burgan in Kuwait, meaning they will fall off the cliff eventually. I expect the consequences will become obvious in the next two or three years. Probably Jeff Brown would be the best person to ask about this.
Hi Doug,
In the Norway portion of the North Sea the depletion rate is about 12%. In Alaska the depletion rate from proved producing reserves was about 7.5% in 2012 and was about 10% in 1998.
For the US from 1996 to 2012 the depletion rate from producing reserves has been between 12 and 13%. I define depletion rate as the annual C+C produced divided by the proved producing reserves at the end of that year (data from EIA).
I doubt that on the World level that we will reach the Norway or US depletion rates, note that the depletion rates in my models above are for crude less extra heavy, I model the extra heavy oil separately.
There is no real way of knowing what the reserves really are until the field is nearly depleted. So the true depletion rate is always a guessing game. However the decline rate is something you can accurately measure. You can know exactly what that is. But I admit, if you could know the exact depletion rate that would be very interesting.
Hi Ron,
You are correct the depletion rate can only be estimated, there are no numbers that are known exactly, though I agree the estimates of past decline rates are much better. To attempt to predict future decline rates we need to estimate future rates of depletion, and we can do that better by estimating past depletion rates.
In the shock model the focus is on mature reserves which is close to proved producing reserves. For the US you can find crude proved reserves and proved non-producing reserves
http://www.eia.gov/dnav/pet/pet_crd_pres_dcu_NUS_a.htm
http://www.eia.gov/dnav/pet/PET_CRD_NPROD_DCU_NUS_A.htm
The proved minus proved non-producing equals proved producing reserves.
An estimate of the depletion rate is crude produced divided by proved producing reserves.
For the World this estimate is based on Jean Laherrere’s oil discovery data, a dispersive discovery model to estimate future discoveries, and the oil shock model to estimate how these discoveries are transformed into proved producing reserves over time and how they are depleted (using the depletion rate.)
Ron,
Actually, if the reservoir is well characterized depletion rates can be determined accurately. One example is Prudhoe Bay which was well figured out quite early. The original “pay” zone was about 600 feet thick and it is currently at less than 60 feet thick. So, taking the shrinking lateral effects, depletion has been worked out quite well (probably). Of course, owing to faulting, facies changes, and other issues, many (most) deposits are poorly understood and, as you say, it’s a guessing game.
I’m not being condescending because I realize you know this stuff but there will (may be) be some who don’t. [Yellow face]
Doug
I tried to insert this above but it jumped down here, sorry. Sometimes your Blog has a mind of its own. Maybe the HAL effect!
Yes, comment placement has been acting real funny lately. If it continues on the next post I am going to call WordPress to see what the problem is. Or perhaps I should call Bluehost, I am not sure but the comments section is just not working right.
Hi Ron,
I think this happens if you or I delete a post.
In the future if you don’t like a post, just edit the post, but don’t put it in the trash bin. For spam comments just mark them as spam and that seems to work correctly (I think).
I noticed that I caused this problem when I deleted a comment (one of my own.) in the future I won’t do that.
Yes, I think you are right. In the future I will not delete a post, just edit the contents and leave the post. However some spam posts have their link as the sender’s name. But I think I can just mark them as spam and let the anti-spam program delete them. That program blocks about 50 spam post per day but a few still get through.
Dennis/Ron,
I agree, when I commented on a spam post, and the spam was removed my post straight to the bottom. Obviously we all need to learn the finer points of the program.
But Ron, look on the bright side, you must be impressing people to be attracting all this spam.
You would make Monty Python proud, lol
Good Luck and keep up the good work.
The spam posts are mostly computer generated. Spammers subscribe to a service that does this. They go out to hundreds, even thousands, of blogs at the same time. The spam filter catches all of these and I never see them. But the ones that are typed in personally and sent to a specific site, like this one, are the ones that get through. I think it is the reply’s to deleted posts that messes everything up. When I delete a spam post any reply’s to it go into limbo and the program does not know what to do with them. But that is just a guess, I really don’t know why the comments get messed up but I am pretty sure Dennis is right, it all starts when a post is deleted.
I just replied to Old Farmer and my post went to the bottom, I assume this one will too; also when I attempted to get to page 2 of the comments I was redirected to the previous article published here, but page 2 of those comments was at its bottom. WordPress must be doing some code overhaul at the time to create these bugs.
Dennis,
“I doubt that on the World level that we will reach the Norway or US depletion rates…” Well, I think you’re wrong, certainly for the lighter oils. There’s no doubt heavier grades will deplete at lesser rates; tar sands will hardly deplete at all. But, in the grand scheme it’s the oil from Bergans, Ghawars, etc. that matter. Anyway, it’ll take two or three years to know and by this time tomorrow nobody will remember what either you or I said (or care). However, with due respect, I think your protections are misleadingly wrong and should be challenged. They are therefore, challenged!
[yellow face, smiling]
Doug
Hi Doug,
That is fine. Do you also think that Jean Laherrere’s estimates for URR are in correct? Essentially I have raised his crude less extra heavy by about 10% based on Hubbert linearization from 1993 to 2013 for crude less extra heavy.
So you think I should use higher depletion rates say 12 %, I can do that I just wonder how realistic it is for the world as a whole, so far the World has never risen above 5.8% for depletion rate (in 1974) so any depletion rate for the World as a whole above 6% seems unrealistic don’t you think?
To be honest I don’t know what the depletion rates will be, what do you think is realistic?
You can give me depletion rates for 2015, 2020, …, 2100 and I would be happy to run that model. Anything above 12% seems unrealistic to me for the world as a whole.
Of my three wrong models, which of the three looks most realistic to your eye?
Dennis,
The problem, as I see it, is the word “oil” is being used in a collective sense that fogs an important consideration. The great “Legacy” fields (North Sea, Ghawar and North Slope, for example, were (are) primarily the “good” stuff: Fuel that made our world what it is today. But it’s being depleted at ever increasing rates all over the world.
Of course you can toss in all that sticky goo in Venezuela and make your depletion numbers look great but, to my mind, this is grossly misleading. Naturally this a gray area but it hides something important.
So, not only do I disagree with you about giving too much credit to so-called TRR “reserves” I don’t like the fact your projections seem to slough over rapid depletion of light (the good stuff) through what I think is a (misleading) generalization.
One more example, the reservoirs recently brought on line in Saudi Arabia have been known about forever but they weren’t exploited because they were barely viable or not viable. Obviously gross depletion rates will be low because they’re heavy (in some cases “polluted” with vanadium) but of course if you average their depletion rates with light oil deposits of course the numbers look OK. If you want a metaphor, you shouldn’t include draft horses with stallions. That’s why I don’t your depletion assumptions (one of the reasons).
Doug
Any info or links to articles about removing vanadium from crude written so as to be understandable to a layman would be greatly appreciated. I gather that it is an expensive and energy intensive process but beyond that I haven’t a clue.
Hi Mac,
This is a great article on sour/impure oil: The Oil Drum | Manifa Oil: Malodorous, But Really Not That Bad
Dennis,
“In the Norway portion of the North Sea the depletion rate is about 12%. In Alaska the depletion rate from proved producing reserves was about 7.5% in 2012 and was about 10% in 1998.” Sorry but I have to say this. It’s REALLY annoying when you make statements like this. Everyone on this Blog (including me) know this or has as much access to these facts as you do. In other words, you’re not talking to a grade five class. We I make a point I shouldn’t have to go through records and dredge up references to different sources already available to everyone. Please don’t talk down to people in your comments. Don’t be offended Dennis, I realize it’s just you being you.[Yellow face]
I’ve no idea where this comment will appear.
Doug
Magenta, we are not cranks. Your source is an article about homeopathy. If the best you can do is compare peak oilers with homeopathy then it is you who is the crank.
Unless you can do better than that then please don’t post anything.
Edit: The more I think about it the more it pisses me off. Only a blooming idiot would compare those who think crude oil production will peak in the near future with those who believe in homeopathy.
Ron,
I think I know what Magenta is trying to say. PEAK OIL will lead to a peak in essential oil production.
Steve
🙂
Steve, I agree with you like you mention on your site as well, it’s not just peak production, but what is the net energy to society.. There are no good graphs for that as far as I know, and that is why looking at the production of fluids is interesting, but it doesn’t tell the whole story. You could even imagine a theoretical situation where production stays flat but net energy increases due to less energy needed for extraction.
But that ain’t happening of course, it’s the opposite. I wish there was a good graph of “net energy available to society” Put that next to “energy lost in resource extraction (sans energy)” and you’d have a scary combo i’d reckon.
I agree, it might be useful to look at net energy available. Would it not be possible to break out the various products and assign a Btu value to them? I realize this wouldn’t be completely accurate due to the natural variances within product classifications, but I guess it would offer some insight into the true energy picture.
Hi Magenta. Sure, if you want to define the idea of peak oil that way, you are right (which seems to be very important to you, and most of us as well).
However, what most folks who have concern about this issue are worried about is the general notion that the cheap ( easily available and processed) oil and gas that enabled the world population to grow from perhaps 2 billion to 7 billion+, is now much harder to find. The result of this definite phenomena will be price escalation ( crude has gone from about $20 to $100 in the past 10-20 yrs), and at some point the price will be too high for many to afford. In effect, there will develop scarcity that will be severe- severe enough to threaten not just frivolous uses like air travel, but critical ones like food production.
So, however you choose to define the terms, Houston we have a problem.
But like many a prognosticator found to be wrong, peakers just move the goal posts forward:
Are you saying that the goal posts will continually be moved forward indefinitely, and therefore oil production will never peak? Is that really your argument against peak oil?
You don’t really expect me to know the answer to that, do you?
If Hubbert didn’t know, I sure don’t.
Ron, great job!
Question: US tight oil is exported to Canada to dilute Canadian tar sands for syn crude. Is this light oil/condensate counted twice?
Matt, yes “some” US light tight oil is exported to Canada to dilute the tar sands heavy crude in order to make it pass through the pipeline. However I doubt that it is counted twice. But I really don’t know.
Seems like it would be counted as production in the US, and listed as an export. Then included in the count of imported dilbit volume from Canada.
Double counting can associated with eroi data. Suppose y units of oil are produced then used to facilitate the production of x units at a different facility, Published data will show that x + y units have been produced. But net production would be x – y units.
There was an interview a long time ago about Lukoil and double counting. They produce in Russia, but they also had Africa holdings and now Iraq holdings. Those produce.
And there is some question as to whether or not they are reported as both Russian and Iraq/Africa production.
From last Ronpost:
>>
“I don’t usually put much faith in anything I hear from the top management of any oil company but they big boys have all said they can’t make it in natural gas at under current conditions.”
If there ain’t no liquids, there ain’t no drilling.
This btw is why the ND production reports are soooooo shaky. You have rail cars blowing up. You have humongous amounts of flaring. And we hear NOTHING about huge NGL production out of the Bakken?
All it takes is a little API tweaking and presto, every cubic centimeter in those trucks is “oil”.
The gubmint knows. They were pointed mostly at the EF when they said distillate oil could export provided it was refinery processed for safety.
There is a lot of lying going on in the world about just about every number we hear from anyone measuring anything.
>>
Is there Bakken NGL data?
Yes there is. It’s growing.
There is a hyped pipeline to take it to ethane crackers in Kansas.
It can’t get to that pipeline unless EVEN MORE trucks go to the wellsite to load up and take it there.
No question in my mind, if you can’t get NGL trucks on site without slowing the oil hauling trucks, then some NGL is going to get into the oil truck.
Oooh, how does this play in winter? Is this another source of winter slowdown? If you fill up the onsite NGL tank, you have to stop producing, just as you would if you filled up the oil tank onsite.
Watcher, I don’t understand this at all. When the gas comes out of the well it is all mixed, it is just gas. The gas is a mixture of methane, ethane, propane and butane. And the largest component, by far, is methane. But without a gas plant there is no way of separating the different types of gasses, or at least that is what I thought.
I did not know that they trucked these gasses away, I thought it required a pipeline and if there was no pipeline the gasses had to be flared.
Clue me in here. Is there something about the Bakken here that I don’t know.
The point was NGLs.
But your point is entirely valid and the source of NDIC annoyance, and possible motivation to close chokes. If the flaring doesn’t stop, then they know a way to stop it. It’s a side effect of oil production, so close the chokes.
For butane, for example, boiling point 34F so you can easily have a lot of liquid at the site in winter. Gotta store it or ship it. Or flare it, I guess. The data says NGL production from the Bakken is growing, so . . . butane is gonna go by truck, either its own or just happening to occupy volume in the oil truck (that is recorded as all oil).
Naw, I really don’t think they are going to separate butane from the rest of the gas at the wellhead. The stuff is quite hot when it exits the well. They would have to store it and let it cool long enough for the butane to condense out. I really don’t think they do that….
Well, good point. It will come up hot. Maybe above boiling point, in which case the flaring is not just CH4.
You have to store it, ship it or flare it. If they are flaring higher fractions, that is really attention getting regulation-wise. If they don’t flare it, just vent it, then in winter it will be raining butane onto the well site as it cools below boiling point.
Bottom line: I don’t know. But a quick google of Bakken NGLs says production is rising sharply. It’s gotta get shipped somehow.
Wait a minute, so Libyan and Iranian production declines YOY 2012-2013 owing to unrest/sanctions; and the Saudi response was to shut in their own production? That makes absolutely no sense whatsoever, why wasn’t this a screaming headline; or was there a factor involve that makes this a non-issue? Although I’m scratching my head bigtime to come up with one. Contracting demand in China, Oil Weapon…that’s all I’ve got. Oh, Price Collapse, there’s a good one.
KLR, yes that is the case. But the Saudis would argue that the US increase in production more than made up for that decline so there was no need for them to increase production.
Matt Mushalik as usual fired up an excellent graph of the situation last fall in his piece about why the US will always remain a crude oil importer. The US could step up to the plate to cover the change for KSA imports all on its own, yes, but I’m surprised so many countries shut in production in the face of obstinate high prices – aren’t they committed to keeping their share of the market anyway? Aren’t there enough new customers in the developing world to keep them producing? Not to mention the inexorable growth in their domestic consumption.
If the price is going up, it must be amazingly precious stuff.
Better keep it in the ground for later use.
Brilliant idea! Maybe in a thousand years someone will come up with some use for it besides burn it up for fun.
Oh it shouldn’t take 1000 years. If you want your grandchildren to be the dominant humans on earth, just save it until everyone else has burned all of theirs.
It would be interesting to see what a YOY chart of the oil actually available to the world markets after domestic consumption looks like. Let alone an EROI chart after domestic consumption is factored in. Great charts Ron.
A chart follows showing 2002 to 2012 data for the combined net exports from the (2005) Top 33 net exporters, what I define as Global Net Exports of oil (GNE). I’m estimating that the 2013 GNE value was around 43 mbpd, but the EIA does not have complete 2013 consumption data out yet.
Mr. Brown,
I thought that you should know that:
Everyone’s that knows me, knows this ‘Your’ chart…. As well as this website. I mean, everyone!
And they all look at me very differently. And for your information: Few came to me at the bar to thank me because they had NO clue about these issues.
And I live in Washington, DC. …….. go figure!
An interesting comment from an energy analyst who recently reviewed my net export work:
They CAN NOT hear it because it’s too depressing, they will tell me later on. Keep in mind that, these conversations, for the most part, happen at the bar while drinking, thus we’re all more relaxed.
Also, people around here have a very low view of the rest of America. They find the American people too dumb and frustrating to deal/talk to. I ask, because some are European and I came from Brazil, “How about in Europe” and they tell it’s even worse. Keep in mind that they are benchmarking Europe versus DC.
Once Noam Chomsky asked a question that goes something like this: “What is the difference between ‘Efficient Market Theories’ and ‘Noah’s Ark’?” Chomsky was referring to stupid people with power.
My Point: I find most people real dumb/misinformed. And I was one of them. So, websites like this, especially the way Ron lays out his data and knowledge, clean and to the point, are priceless. As well as important, because ‘some’ people are waking up and searching for answers.
However, what I find really disturbing is not that the American people, as well as the European and Brazilians, might have been dumb-down by religion, education, and mass media but, their ability to self-deception. And the analyst’s first line comment above is a good example: “… something better must happen. I frankly don’t know,…”
And he/she is an energy analyst.
Astounding!
Here was my reply to analyst friend:
Almost no one seems to be aware of what I call “Net export math,” and most people who are aware of it either discount it, or they are in some stage of denial. I’ve previously used the following analogy:
Very Good analogy Mr. Brown. Very good Indeed.
Ron,
Without the Eagle Ford & Marcellus, shale gas production from the remaining shale fields is down from a peak in Sept 2012 at 19.6 Bcf down to 17.8 Bcf presently. The majority of declines come from the Barnett and Haynesville.
steve
…. and if we just look at the Eagle Ford & Marcellus, their total shale gas production increased a staggering 14 times from its May 2010 total of 1.2 Bcf to 17.3 Bcf May 2014. While this is impressive, I highly doubt it’s sustainable.
steve
NOTE: all figures should be in Bcf/d
steve
Jeffrey,
Yeah, I remember that report. You know, if we compare the increase in U.S. natural gas production from 1930-1973 compared to the Eagle Ford & Marcellus, we see a very interesting difference.
You will notice that it took 33 years for total U.S. natural gas production to increase 8 times its 1940 rate of 2.6 Tcf to 21.7 Tcf by the peak in 1973. However, it only took the Eagle Ford & Marcellus four years to increase production 14 times their May 2010 rate of 1.2 Bcf/d to the current 17.3 Bcf/d.
Bill Powers believes the Marcellus could peak next year. We’ll see.
steve
Based on the Citi Research report, we need about 16 BCF/day per year of new production in order to maintain current dry processed US natural gas production.
Citi estimates that the decline rate from existing gas production is about 24%/year. This is supported by the observed 20% year over year decline in total marketed gas production from Louisiana. This is the net decline, after new wells were put on line in 2013. The gross decline from existing wells (not counting new wells put on line in 2013) would be even higher.
Steve,
I am not sure about Eagles Ford, but the Marcellus is basically pipeline constrained. RBNenergy.com has some good articles on the reversal of many pipelines to take Marcellus gas to West and South. In the next few years there is something like 9-10bcf/day of pipeline capacity being redirected.
It will certainly be interesting to see how the Marcellus handles this massive increase in take away capacity, but in the meantime they have plenty for those who have access to the area.
The big jump in Nov 2013 was the New York pipeline opening, not some massive increase wells coming on line.
That’s interesting. In an all gas field you can just wait for the pipelines because you HAVE to just wait for the pipelines.
But I still do have problems with the issue of well death rapidity. How do you get enough gas out of a dying well to pay for the stretch of pipeline from it to the big main pipeline?
(answer: liquids)
Watcher,
You confuse me, in a dry gas field the only way to have a dieing gas well is to be producing it, therefore it must be hooked up to a pipeline. If the pipeline is too small and you want to expand it, the expansion will not be paid for by the dieing well. It will be paid for by the wells waiting to be drilled or the wells that are choked back because large enough pipelines do not exist.
One thing that annoys me about flaring gas in an oil field is that many companies claim it is not economic to build pipelines for the gas. This doesn’t necessarily mean they can’t make money selling the gas, just that those same dollars invested in drilling more oil wells will earn more money rather than if they invested it in gas pipelines.
So on a short term company perspective this makes economic sense. On a long term country/world perspective, it is a total waste of natural resources.
Toolpush, The companies are all operating with borrowed money (debt). So if I borrowed $1000 bucks from you and said its all kind of promising but risky nonetheless, and I have two options. One is to spend your money building a pipeline for a small amount gas, and maybe? it will give you a slight return, or I can spend your money drilling for some concentrated and easier to transport oil, well, which risk do you want me to spend your money on?
Like most such decisions, people go for the more bang for the buck.
In a nicer world, we would all go much slower and carefully utilize the resources, and there would only be 1-2 billion people max. Perhaps we wouldn’t be fracking at all.
hickory man,
I know why the oil companies go for the cream (oil) and leave the skim (gas) behind. That is what there short term accounting principals teaches them. Skim milk and Whey used to be waste product of the dairy industry, now they are a major part of the a dairy companies profit stream.
I have worked on projects where the governments have given the oil companies quotas on what they can flare. It is amazing to see the different response to repairing the gas process that has broken down resulting in increased flaring, when they are in quota. “Yeah just order those spare parts my normal channels, send them sea freight” To when they are over quota, “Can we DHL, do we need to hand carry, do we need to charter a plane.”
I know the business needs to make money, and if they don’t, the oil is not produced, but a little guidance and financial incentives go along way maximizing the use of valuable irreplaceable resources.
Simple things like ND insisting the oil companies have a plan in place for using the Nat Gas before they issue drilling, is surely not a major cost burden to be placed on project that have progressed well beyond the exploration phase.
Nod. Yes, there will be a wide pipe somewhere semi nearby. It’s the length from well to wide pipe that the well has to pay for.
Now that would be a good calculation. How much length of pipe gets paid for per million cubic feet of dry gas at today’s price? If it’s dry. This would mean that the more wide pipes thread around a Pennsylvania county, the shorter the distance each well’s pipe has to be to get to the main / wide pipe given they know what the decline profile will be.
A cursory look says $75/foot, and that’s not residential in house pipe, which is $15. That seems like 2 miles would be about $800K?
Gotta be liquids paying for all those pipes.
Watcher,
The Bakken producers are actually setting themselves up for easy Nat Gas collection by all this pad drilling. One pipe to the pad to service 8-12 wells, and if you believe our Martin friend with all the multi layer shale formation and close drilling, it maybe 20-30 per pad, and these pads are going to be on every two square mile plot of land. Real easy to connect the dots.
Don’t take all what I wrote too literally, my tongue was in my cheek at the time, but the concept is there. Put a few financial disincentives to flare, and as they say the market will find a way to consume the gas.
Some examples below. Can’t you just imagine all your trucks running on CNG/LNG. The same with the drilling rigs and frac spreads. No need to truck in diesel from out of state.
http://www.ogj.com/articles/uogr/print/volume-2/issue-3/statoil-tackles-bakken-flaring-with-innovation.html
http://site.ge-energy.com/businesses/ge_oilandgas/en/newsletter/geog_viewsandnews_1213/changeforum.html
http://www.statoil.com/en/OurOperations/ExplorationProd/ShaleGas/Pages/ReducedFlaringCoop.aspx
Compressed natural gas is a viable alternative to diesel fuel IF it is available at an adequate number of truck stops suitably located. I can see it being widely adopted within the fairly near future especially in areas where natural gas is produced.Trucks can be built to be dual fueled easily and a small on board tank of diesel would be enough to get a driver home or to another natural gas station if he runs short on the road.
Liquified natural gas is another animal altogether.I don’t see it becoming economical anytime soon. It costs too much to outfit a truck to use it.Maybe if there is a cost breakthrough in the art of building the tanks needed to haul it around in small quantities of a hundred gallons or so as truck fuel………..
Mac,
What you say is perfectly true about the use of CNG/LNG for normal road economics. But we are talking about in field oil field economics. For drilling rigs and most likely transport trucks as well, the drilling company is responsible for the maintenance on the engines, and the oil company supplies the fuel. If the oil company has the Nat gas as a waste product, therefore it is free fuel. It can actually be better than that if there are penalties for flaring, therefore the nat gas used to fuel the rig can actually have a negative cost to the oil company, and therefore becomes a strong driver to encourage all the contractors to switch to nat gas.
As for LNG, it is happening,
http://www.prairiecompanies.com/news/154-north-dakota-lng-llc-announces-first-to-market-liquefied-natural-gas-production-facility-for-the-bakken
You will find it will mainly be used for drilling rigs, frac pumps and other high volume applications that are some distance from the plant. Even the farmers get a mention, displacing propane as a fuel.
The rail companies are also looking at LNG, but it will be a couple of years before that will take off, due to some regulation issues and full testing on the new engines.
Here is another good link
http://www.prairiecompanies.com/news/156-big-role-seen-for-natural-gas
With a new liquefied natural gas plant in the works in Tioga, North Dakota LNG Chief Executive Officer Pat Hughes predicts 50 percent of North Dakota oil drilling rigs will run on natural gas in the next 12 months.
“Hughes is hopeful that 100 percent will use natural gas to supplement diesel fuel by the end of 2015, he said Tuesday during the Williston Basin Petroleum Conference.”
Seems over optimistic, but they are there words not mine.
Blumberg’s Report on Renewable Energy:
http://bnef.folioshack.com/document/v71ve0nkrs8e0/who42hnkrs8fo
Just from eye balling, Bloomberg appears to predict that annual installation of wind power will stabilize around 50 GW and of solar power will be about 150 GW by 2030.
Interesting to see that USA C+C increased from about 5000 to 8000 on the 5th chart of the article from year 2007 to the end of 2013, while in the meantime the price of a barrel of crude went from approx 65$ (pre-crash gyration) to about $98 at the end of 2013.
That tells me that elsewhere in the world there must be increasing competition for the purchase of available oil on the market, and thus supports the notion that we have moved beyond the age of inexpensive oil (beyond peak cheap oil).
There will always be a lot of oil left in the ground. The question is how much we can afford to get at. What price/barrel puts us in recession or depression. One sign of a terminal downswing will be the increase in domestic coal consumption.
Thanks for the work you do on this.
Re: Manifa in Saudi Arabia
I assume that it is here: 27°32’31.4″N 49°11’43.4″E
map
However, on Google Maps the offshore area is all erased.
Is there any way to see this oil field?
Hello Ron and anyone else who backs his arguments with numbers and arithmetic:
Is there some way to compute net oil production in quads or some other physical measure that distinguishes between West Texas Intermediate and hydrocarbon liquids from Eagle Ford? Probably, the world total for net energy from all forms of oil has already peaked and has been in steady decline for years.
Tom Wayburn, Houston, Texas
I don’t think there is Tom. There is nothing published publicly that would reveal that kind of data. Well not to my knowledge anyway.
My 2¢ worth, regarding actual crude oil production versus liquid byproducts of natural gas production:
Based on foregoing assumptions, I estimate that actual annual global crude oil production (45 or lower API gravity crude oil) increased from about 60 mbpd in 2002 to about 67 mbpd in 2005, as annual Brent crude oil prices doubled from $25 in 2002 to $55 in 2005.
At the (estimated) 2002 to 2005 rate of increase in global crude oil production, it would have been up to about 90 mbpd in 2013.
As annual Brent crude oil prices doubled again, from $55 in 2005 to an average of about $110 for 2011 to 2013 inclusive, I estimate that annual global crude oil production did not materially exceed about 67 mbpd, and probably averaged about 66 mbpd for 2006 to 2013 inclusive.
Hi Thomas,
There is no way to get an exact number for the energy difference between WTI, and the Eagle Ford, but you can get a rough estimate:
If you go to our site, and go to Study Graphs on the left bar, then go to graph# 20 you will see the Exergy vs API graph. Exergy is the energy content of a hydrocarbon, and is given in BTU/gal. It is the same number that is used by the EIA when they report gross energy production. You can see from the graph that the energy content (exergy) of a hydrocarbon is a property of its density (API).
The equation of that curve is: y = exp(-0.0045x + 12.01). y = BTU/gal, and x is the API rating for the hydrocarbon in question. For example: octane has an API rating of 68.65. Plugging that into the equation gives 120,701 BTU/gal. By using the API of WTI and the Eagle Ford you can get a comparison on a per unit bases (BTU/gal). By multiplying total production (in gallons, 42 X barrels) you can get total energy produced from both. The per unit bases is the most accurate because some of the Eagle Ford is going to be in the WTI. Last time I read the Eagle Ford was running an API of about 50, and WTI 39. Check at the EIA website, its in there someplace, and constantly changing. Anyway, you will find that a barrel of Eagle Ford has about 95% of the energy value that is in a barrel of WTI. When you get down to the lightest liquid hydrocarbon (pentane, C5H12) that falls to 79.5%.
Drop me a line at the site if you have any questions.
http://www.thehillsgroup.org/
Thomas,
“Probably, the world total for net energy from all forms of oil has already peaked and has been in steady decline for years.”
If you look at the study you will find that we break it down into finer detail than that. We look at Gross Energy, Production Energy (which includes extraction, processing, and distribution) and Deliverable energy (the quantity of energy that the end user actually gets). 2000 was the year that the end user received the maximum amount of energy from petroleum; at 89.62 quad BTU. That number is now declining, and will continue to into the future. What is happening here is that the energy to produce petroleum, and its products is going up, while the energy available for the rest of the economy is going down. So the whole melt down event doesn’t really show up in economic data like GDP. It just shows up in things like standard of living, and quality of jobs.
http://www.thehillsgroup.org/
BW – This is very interesting. It would appear to be getting at the crux of the EROEI issue that I harped on for years back on TOD. Is there a graph you can share here that show’s the declining net energy you mention above with its peak in 2000 at 89.6 Quads?
I like your use of the term ‘dead state’:
“All processes approach an equilibrium state with their environment. This is called the “dead state”, and represents the point where no additional work can be extracted from the system’s energy. It is the point where the system’s internal irreversibilities overcome the system’s energy.”
That is the essence of the problem of declining EROEI. The graph of the exergy in a gallon of crude on your front page shows it in the ‘dead state’ in 2030. I think few, even here, fully grok the implications of that. Are there any other graphs you can share here, such as the one you mention above?
Thanks!
Very interesting post BW!
‘Not all the king’s horses could put peak oil back on any reasonable person’s radar’
Is an incoherent mess of a mixed metaphor. Meaningless.
It’s certainly not English anyway.
Oil producers spending more, making less
Oil producers are making less for the capital they’re spending than they did a decade ago, when U.S. benchmark crude prices were below $30 a barrel, a new report concludes.
A study of more than 80 oil companies showed they made an average 8.6 percent in returns on average capital employed last year, and 11 percent in 2012 – both lower than exploration-and-production returns in 2001, according to a report from research and consulting firm IHS…
“My guess is that shareholders are asking, ‘What gives?’ ” Nicholas Cacchione, a lead researcher for cost and energy performance for IHS, said in a statement. “The culprit is cost escalation.”
“The culprit is cost escalation.”
The amorphous villain “cost escalation”!
Well, it’s good they’ve named the enemy… especially when it comes to fighting a propaganda war.
He is a suitably vague villain who folks can easily attach their prejudices to. It’s clear he is entirely at fault, even though he can’t be seen or properly defined. All the better, one wouldn’t want the consumers to begin to think the producers we’re to blame. Or to have the consumers begin to think that the promise of abundant and cheap liquid fuel forever was hollow? Or for consumers to recognize their profligate use has as a consequence lead to expensive fuel… that might invoke guilt and shame on their part.
The enemy “cost escalation” is here… to the ramparts.
If only we could round “cost escalation” up and intern him.
Riots in Kuwait again. Armed protesters attacking Police:
http://www.zerohedge.com/news/2014-07-03/arab-spring-just-got-serious-again-kuwait-burning
Other News doesn’t report the violence or downplays it:
http://www.dailystar.com.lb/News/Middle-East/2014/Jul-03/262539-kuwait-police-fire-teargas-to-break-opposition-demo.ashx#axzz36WAu9HyH
http://news.yahoo.com/kuwait-police-tear-gas-break-rally-135622114.html
How much Oil does Kuwait Export?
Some 2012 data for net exports from Persian Gulf producers (total petroleum liquids + other liquids, EIA):
Saudi Arabia: 8.8 mbpd
UAE: 2.6
Kuwait: 2.4
Iraq: 2.2
Iran: 1.8
Qatar: 1.4
Oman: 0.8
It would appear that most of these countries showed flat, to slightly declining, net exports in 2013. The EIA doesn’t have complete consumption data yet, but based on EIA production data and based on BP consumption data for 2013, for example Saudi net exports fell from 8.8 mbpd in 2012 to 8.5 mbpd in 2013.
Greater Burgan in Kuwait is a super giant second only to Ghawar in many respects; production is currently over a million barrels per day, I think. A friend of mine (a petroleum engineer) who is currently working in Kuwait, or he was until recently, insists Burgan is being “creamed” with a ridiculous number of very recent in-fill holes. I haven’t spoken to the chap for several months and know nothing about riots or whatever but for what it’s worth I know the Kuwaitis are an extremely conservative bunch. Apparently there are a lot of US military types hanging about as well. After all, it’s all about the oil isn’t it? I’m sure Jeff will have a handle on how much Kuwaiti oil is exported, most I expect.
Jeff beat me to the punch!
Doug,
By the way…. I plan on buying sone arctic real estate. As temperatures increase, it will be the new vacation spot.
We are talking a real get rich scheme here. What say you?
Steve
Where do I send my check? Actually I’d like a place for myself there. Can I have beachfront? And, it’s asking a lot but a spot with no bugs would be nice. Thanks so much for thinking about me on this. Sounds like a really great opportunity.
Doug,
Buy beachfront in the Arctic now and it’ll be underwater in a couple of decades.
Now, if you send ME that check, I’ll show you where you can have Arctic beachfront at any given decade in the future…
On second thought, how about silver ingots?
Synapsid,
Actually… silver is a better bet. Some of the top precious metal traders have much larger physical silver holdings than gold.
Steve
07-04 15:54: Ecuador May oil output fell 1.1% M/M to 554,300bpd Ransquawk
Would be quite elucidating to see the World production graph overlaid with the price of oil per barrel.
A couple of quick items from Natural Gas Intelligence.
(behind paywall, free 7-day trial)
Eagle Ford Gatherer Planning Pipeline to Mexico
July 2, 2014
Colombia Pipeline LLC filed an application with FERC on Tuesday to construct a border-crossing pipeline from Texas to Mexico that would allow Eagle Ford Shale natural gas to supply power generation and other demand in Mexico.
KM’s Sierrita Pipeline to Mexico Goes Forward With Local Mitigation
July 2, 2014
With a mitigation agreement with local county officials signed in mid-June, Kinder Morgan Inc.’s (KM) proposed Sierrita Pipeline link to new natural gas transmission pipelines in northern Mexico won FERC approval Tuesday to begin construction, opening the door wider to future U.S. natural gas exports
She’ll have to “run ever faster” with all these extra demands on her.
Manitoba flood: Assiniboine River to crest in Brandon on Saturday
CBC News Posted: Jul 04, 2014 10:39 AM
Manitoba usually floods in the Spring, not in the Summer. A warmer atmosphere holds more moisture, when it rains…
Heavy rains, flooding threaten harvests in Manitoba, Saskatchewan
Eric Atkins, The Globe and Mail, Published Thursday, Jul. 03 2014, 5:17 PM EDT
I came across this that reminded me that I have been meaning to mention something that was posted by Kay MacDonald at Big Picture Agriculture.
Report shows declining trend in Prairie Pothole Wetlands
Tri-State Neighbor, July 03, 2014 2:30 pm
A Minnesota Writer Muses on Being Called “Anti-Farmer”
The tragedy in this is that the cause of much of this poor land stewardship has been the rising price of corn stemming from the ethanol mandate… the insult is that ethanol has a dismal and probably negative EROI. The last thing the world will need on the other side of the peak are degraded agricultural lands in the plains and prairies.
July 4 Barbecue Costs Climb to Record: Chart
By Megan Durisin and Fareeha Ali Jul 2, 2014 7:00 PM ET
I recall posting comments at the now shuttered TOD site predicting as a sure thing a big rise in the price of such foods as are common at barbecues because the basic costs of production were rising sharply.
Some folks there said there was no evidence of it happening- which was true at that time for the most part. But it can take years for such changes in cost to work their way thru the agricultural industry with some farmers ” eating ” the increased costs for a long time until the lack of profit or actual losses drive them to shut down production which thus allows prices to rise again.
We hung on with our orchards for years after prices fell to the point raising apples was an expensive hobby. But enough growers finally gave it up for the wholesale price to rise substantially over the last few years.
But a big increase in wholesale prices does not show up at the supermarket the way it would appear to at first glance. IF apples for instance go from twenty-five cents to fifty cents wholesale that doubles an orchardist’s gross.But it will add only twenty five percent or so ballpark to retail prices in most cases.
Of course moonshine and bad weather have had a lot to do with these price increases at wholesale too.
Farmers have been trimming herds as a matter of necessity to avoid running out of feed for some years now. This process has not yet entirely run its course. The effect of it is to drive wholesale prices down well below the cost of production if enough farmers are making desperation sales at any given time.
But eventually the livestock herd becomes small enough that there are not enough animals being sold in desperation to depress prices.
Then you get a big price rebound all the way up to new wholesale record prices at the wholesale level because there are not enough Momma’s left to supply the market with their babies.
And of course except for capacity utilization the middle men’s cost are rising too. They spend megabucks on energy and materials as well as wages.Ditto the supermarkets where the food is finally retailed.
With the exception of rents in some cases every body’s costs are going up.
The only notable exception might be a place where the supermarket is staffed mostly by minimum wage part time employees but even then the rest of the costs are rising and the government has just mandated health care via employer for just about all supermarket chains.
Food prices may decline a bit with some good luck with the weather over the next few years at wholesale at least but there is no reason to expect any meaningful relief at the retail level. Any fall in prices at the farm or wholesale level will be mostly or totally wiped out by increasing costs in the distribution system.
Understanding declining energy options and accepting it because of the DATA…the hard numbers that go beyond argument….becomes the lense everything is seen through and the motivation actions are undertaken by individuals. PV? Insulation? New car, what kind if any? Debt?
And if the timing is off a little bit then by golly you have a head start on almost everyone else. If you knew Mt St Helens would erupt would you have bought that summer cabin on Spirit Lake? If you even thought it was possible that it would erupt one day, would you buy it?
Thanks Ron and all the other contributors to this new site for helping me understand my disquiet with events and circumstances in our wasteful society. If I hadn’t stumbled on TOD (I don’t even know how many years ago now…8? 10?) I simply don’t know what our lives would look like now? Actually, I tried to think why I even started searching about PO and I just remembered it was because my father-in-law lent me The Long Emergency. It shook me up. We are not Oil People, although I have an old buddy who is a Petroleum Engineer. We just had no idea what was going on or how out of touch MSM is and continues to be.
Thanks again…Paulo
U.S. overtakes Saudi Arabia, Russia to become world’s biggest oil producer: report
Another false headline from the mainstream media. Last time I looked, Russia was the world’s biggest oil producer followed by Saudi Arabia the second biggest and the US the third biggest.
Hi Frugal,
My comments keep going to the bottom, this is a response to your comment at link below
http://peakoilbarrel.com/eia-world-crude-condensate-production-update/comment-page-2/#comment-44644
The NGL barrels need to be discounted by 70% to get the boe (barrels of oil equivalent), using EIA data for February KSA C+C+NGL was 11.2 MMboe/d and US C+C+NGL was 9.9 MMboe/d, so the Bloomberg article is incorrect for February 2014, though perhaps this has changed since Feb, C+C output has increased by 0.3 MMb/d through April 2014, data for NGL is harder to find.
Hi Dennis, I think NGL only needs to be discounted by 30%. NGL energy content is 70% of crude oil for the same volume.
Hi PE,
yes that is correct I phrased that incorrectly. The NGL needs to be discounted because a barrel of NGL has 70% of the energy content of crude. In my calculations above I multiplied barrels of NGL by 0.7 (diccounting by 30% not 70%) to get a barrel of oil equivalent (boe).
Hi Dennis:
A good source of data for the properties of hydrocarbons can be found here:
http://www.google.com/url?sa=t&rct=j&q=&esrc=s&source=web&cd=4&ved=0CDoQFjAD&url=http%3A%2F%2Fwww.pe.tamu.edu%2Fbarrufet%2Fpublic_html%2FPETE310%2FAPIDATA.XLS&ei=c225U6DdFofNsQSr-4LADA&usg=AFQjCNHvvhQlLV574AFlchQkQJ2uIUsBNA&sig2=OzDnDMQBzb18DQSAkwMYZA&bvm=bv.70138588,d.cWc
We’ve checked some of these numbers, and they seem to be quite accurate. To use this spread sheet it is easier to download it. It is an XLS document, but Open Office can read it. It sends a warning that some data may be lost, but their isn’t any loss. Just ignore that.
The term Boe is a little deceptive, it refers to gross energy (exergy). But not all hydrocarbons burn with the same efficiency. Compounds equal to, or above hexane (C6H14) have a maximum thermal efficiency of about 71%. Those below about 57%. That is, from two quantities of NG, and crude with the same energy content (exergy) the NG can only supply about 80% of the energy that the crude can supply. That is why NG powered machines will never be able to operate with the same efficiency per lb as crude based fuels. They produce more waste heat, at least 148% more.
http://www.thehillsgroup.org/
Thanks for the analysis Dennis. Many of tend to jump off the doomsday cliff at first chance, but there is certainly a big probability that things will play out gradually. We can deal with gradually by downsizing over 10-30 years.
I think the big risk is the tendency for people to fight over the scraps. Egypt just today announced increasing fuel prices of up to 78% because the government can no longer afford to subsidize it. That country just experienced the crossroads of depletion of domestic supplies and increased internal consumption such that they are no longer a fuel exporter. The revenues earned had been in part used to placate the population with both fuel and wheat subsidies (they are the biggest wheat importer in the world). How do you spell “unrest”?
Thanks all.
I think Hickory Man’s comment is in response to this comment at the link below (which I moved, sorry).
http://peakoilbarrel.com/eia-world-crude-condensate-production-update/comment-page-2/#comment-44669
Is North Dakota Oil Production Rapidly Approaching a Peak?
According to Continental Resources (NYSE: CLR ) President Rick Bott, the answer is a resounding no. At the IHS CERAWeek conference in Houston earlier this year, Bott made a forceful argument that the Bakken still has several decades of life left and that production from the play is nowhere near its peak.
His views are in sharp contrast to those of shale skeptics who argue that Bakken production is quickly nearing a peak because shale wells feature much steeper decline rates in their first few producing years than conventional wells. After the initial decline, output falls off to very low levels, they argue.
Their point is a valid one. According to the EIA, production from Bakken legacy wells is declining at a rate of about 72,000 barrels per day. Meanwhile, production from new wells is running at about 92,000 barrels per day, which means that net production is growing by only about 20,000 barrels per day…
However, absent major improvements in technology, net production growth could continue to slow if legacy declines become bigger. This would suggest that Bakken production could reach a peak much sooner than most experts believe, perhaps as early as before the end of this decade. Investors should keep this risk in mind when investing in Bakken producers, and shale producers in general.
Perhaps as early as before the end of this decade! Are you kidding me? David Hughes says perhaps next year. Others say sooner. I think it is quite absurd to believe that the Bakken will not peak before the end of this decade.
In the chart below Hughes has the Bakken peaking in 2015 and Bakken-Eagle Ford combined peaking in 2016.
Shell not interested in UK shale prospects:
http://www.telegraph.co.uk/finance/newsbysector/epic/rdsb/10948157/Shell-sails-ahead-without-UK-shale.html
These days I think they are mostly interested in keeping their share price up by share buy backs and selling assets to support their dividend…….
I am waiting for Ron’s update on EIA internatinal and his comments. From the EIA data, world oil production increased quite significantly in February. Most of the increase seemd to come from Iraq.
Ron,
Based on my most recent comment (to Dennis) placement, and indentation, is still screwed up. You’re probably on top of this but…………
The secret society governing the US propaganda machine has given false testimony of the so called facts in order to further their agenda. I do not believe any statistics the US propaganda machine has provided. It seems providing misleading statistics (lying) would benefit their agenda in many ways.
By far the largest increase in production has come from the United States. Peak Oil or no Peak Oil, it is all rides on production from the USA.
When he lies, he speaks his native language, for he is a liar and the father of lies
Thanks for finally writing about > EIA World Crude + Condensate
Production Update