US October Oil Production Pushed Higher by New Mexico

A guest post by Ovi

All of the Crude plus Condensate (C + C) production data for the US state charts comes from the EIAʼs December Petroleum Supply monthly PSM which provides updated information up to October 2022.

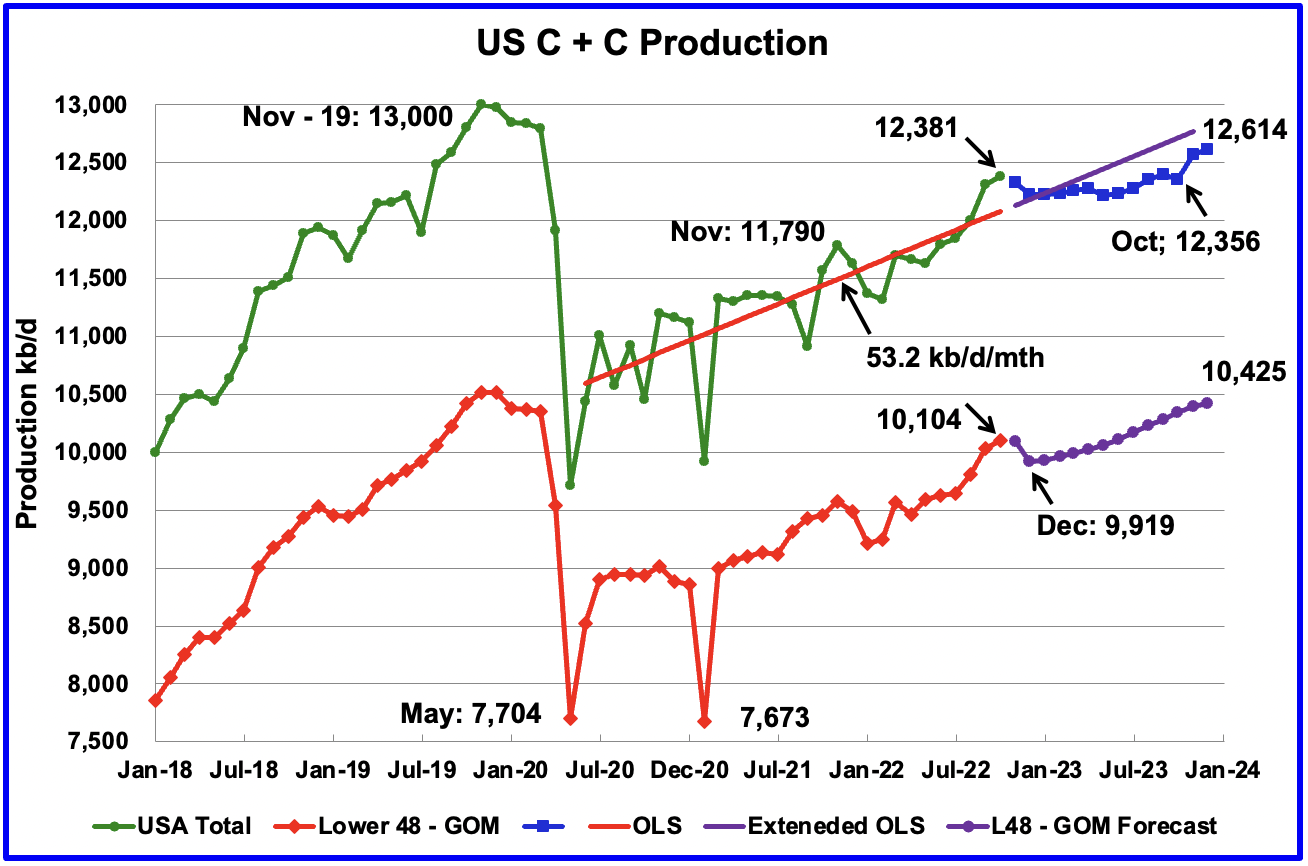
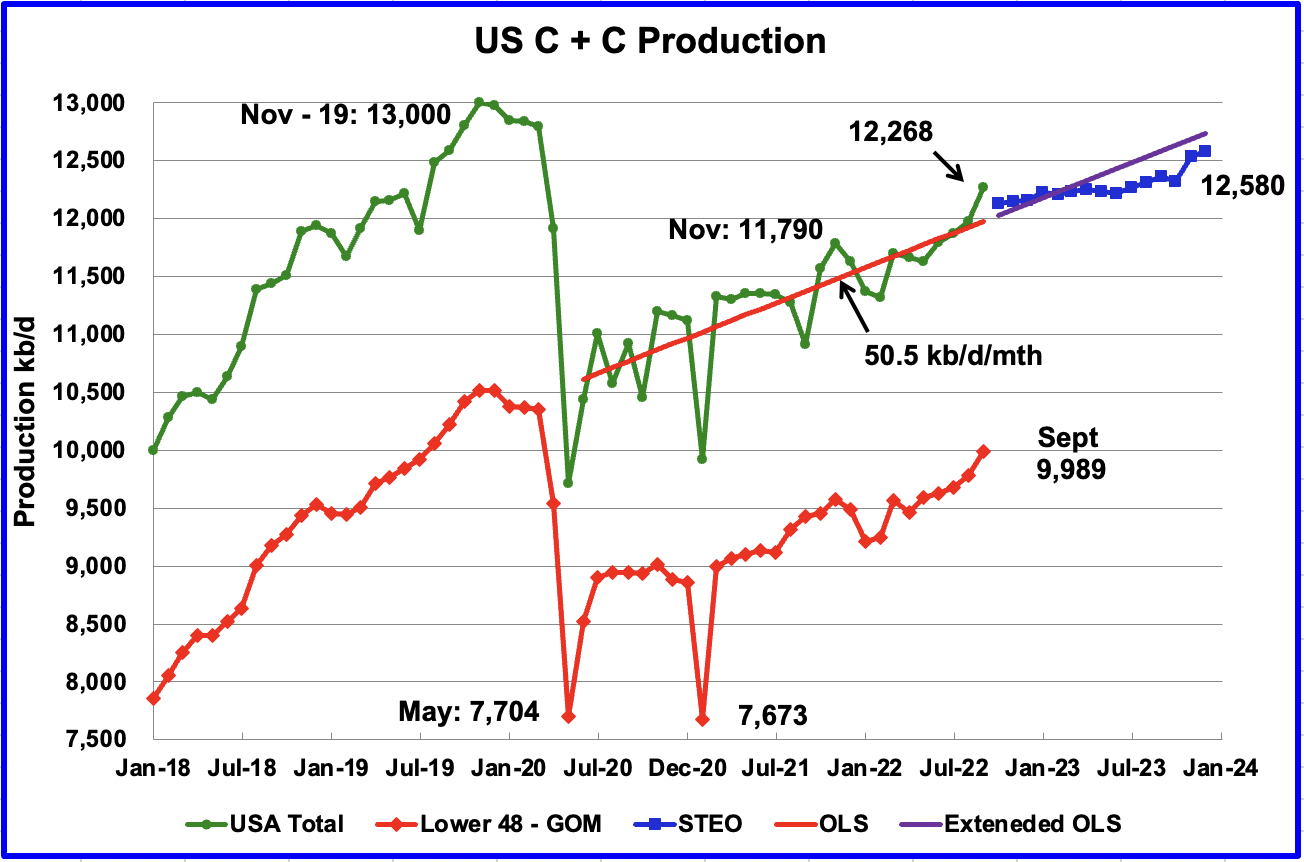
U.S. October production increased by 69 kb/d to 12,381 kb/d to a New post pandemic high.  It should be noted that September’s oil production increase of 289 kb/d to 12,268 kb/d which was reported last month and was considered high, was revised further up by 44 kb/d to 12,312 kb/d in the current October report. For September, the state with the largest increase was New Mexico 41 kb/d, along with a number of small increases from the smaller producing states.

Read More

Permian Pushes US September Oil Production to Post-Pandemic High

A Guest post by Ovi

All of the Crude plus Condensate (C + C) production data for the US state charts comes from the EIAʼs November Petroleum Supply monthly PSM which provides updated information up to September 2022.

U.S. September production increased by 289 kb/d to 12,268 kb/d.  It should be noted that August’s oil production was revised up by only 4 kb/d in the current September report. The large increase over the August update is real. For September, the states with the largest increase were Texas 90 kb/d, New Mexico 75 kb/d and North Dakota 43 kb/d. The Gulf of Mexico added 64 kb/d.

Read More

US August Oil production at Post Pandemic High

A guest post by Ovi

All of the Crude plus Condensate (C + C) production data for the US state charts comes from the EIAʼs October Petroleum Supply monthly PSM which provides data up to August 2022.

U.S. August production increased by 102 kb/d to 11,975 kb/d. It should also be noted that July’s oil production was revised up from 11,800 kb/d to 11,873 kb/d in the October report. So the total increase over the July report, including the revision, was 175 kb/d. For August, the state with the largest increase was Texas at 78 kb/d. August’s production was a new post pandemic high.

Read More

US July Oil Production Shows Little Growth

A guest post by Ovi

All of the Crude plus Condensate (C + C) production data for the US state charts comes from the EIAʼs September Petroleum Supply monthly PSM which provides data up to July 2022.

U.S. July production increased by a minimal 12 kb/d to 11,800 kb/d. For July, the states with increasing production were offset by states with decreasing production. July’s production was a new recent high. Production was 10 kb/d higher than November 2021 which was producing at a rate of 11,790 kb/d.  However it should be noted that June’s oil production was revised down from 11,816 kb/d to 11,788 kb/d in the September report.

Read More

GOM Oil Production fuels US June Increase

A Guest post by Ovi

All of the Crude plus Condensate (C + C) production data for the US state charts comes from the EIAʼs Petroleum Supply monthly PSM. 

U.S. June production increased by 201 kb/d to 11,816 kb/d. Of the 201 kb/d increase, the largest increase came from the GOM, 183 kb/d. June’s production was a new recent high at 26 kb/d higher than November 2021 which was producing at a rate of 11,790 kb/d.

Read More