US May Oil Production Little Changed

By Ovi

All of the Crude plus Condensate (C + C) production data for the US state charts comes from the EIAʼs Petroleum Supply monthly PSM which provides updated information up to May 2023.

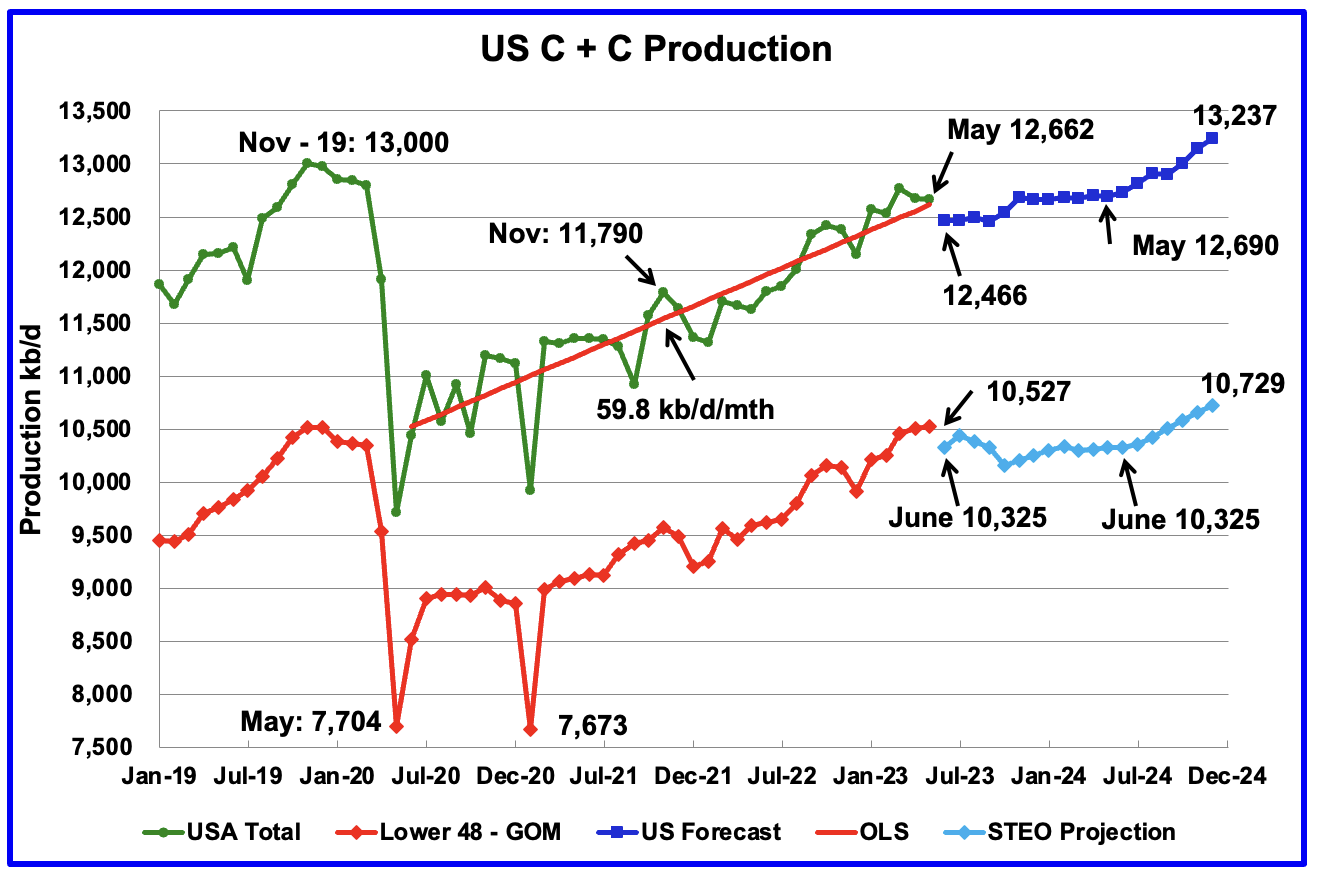
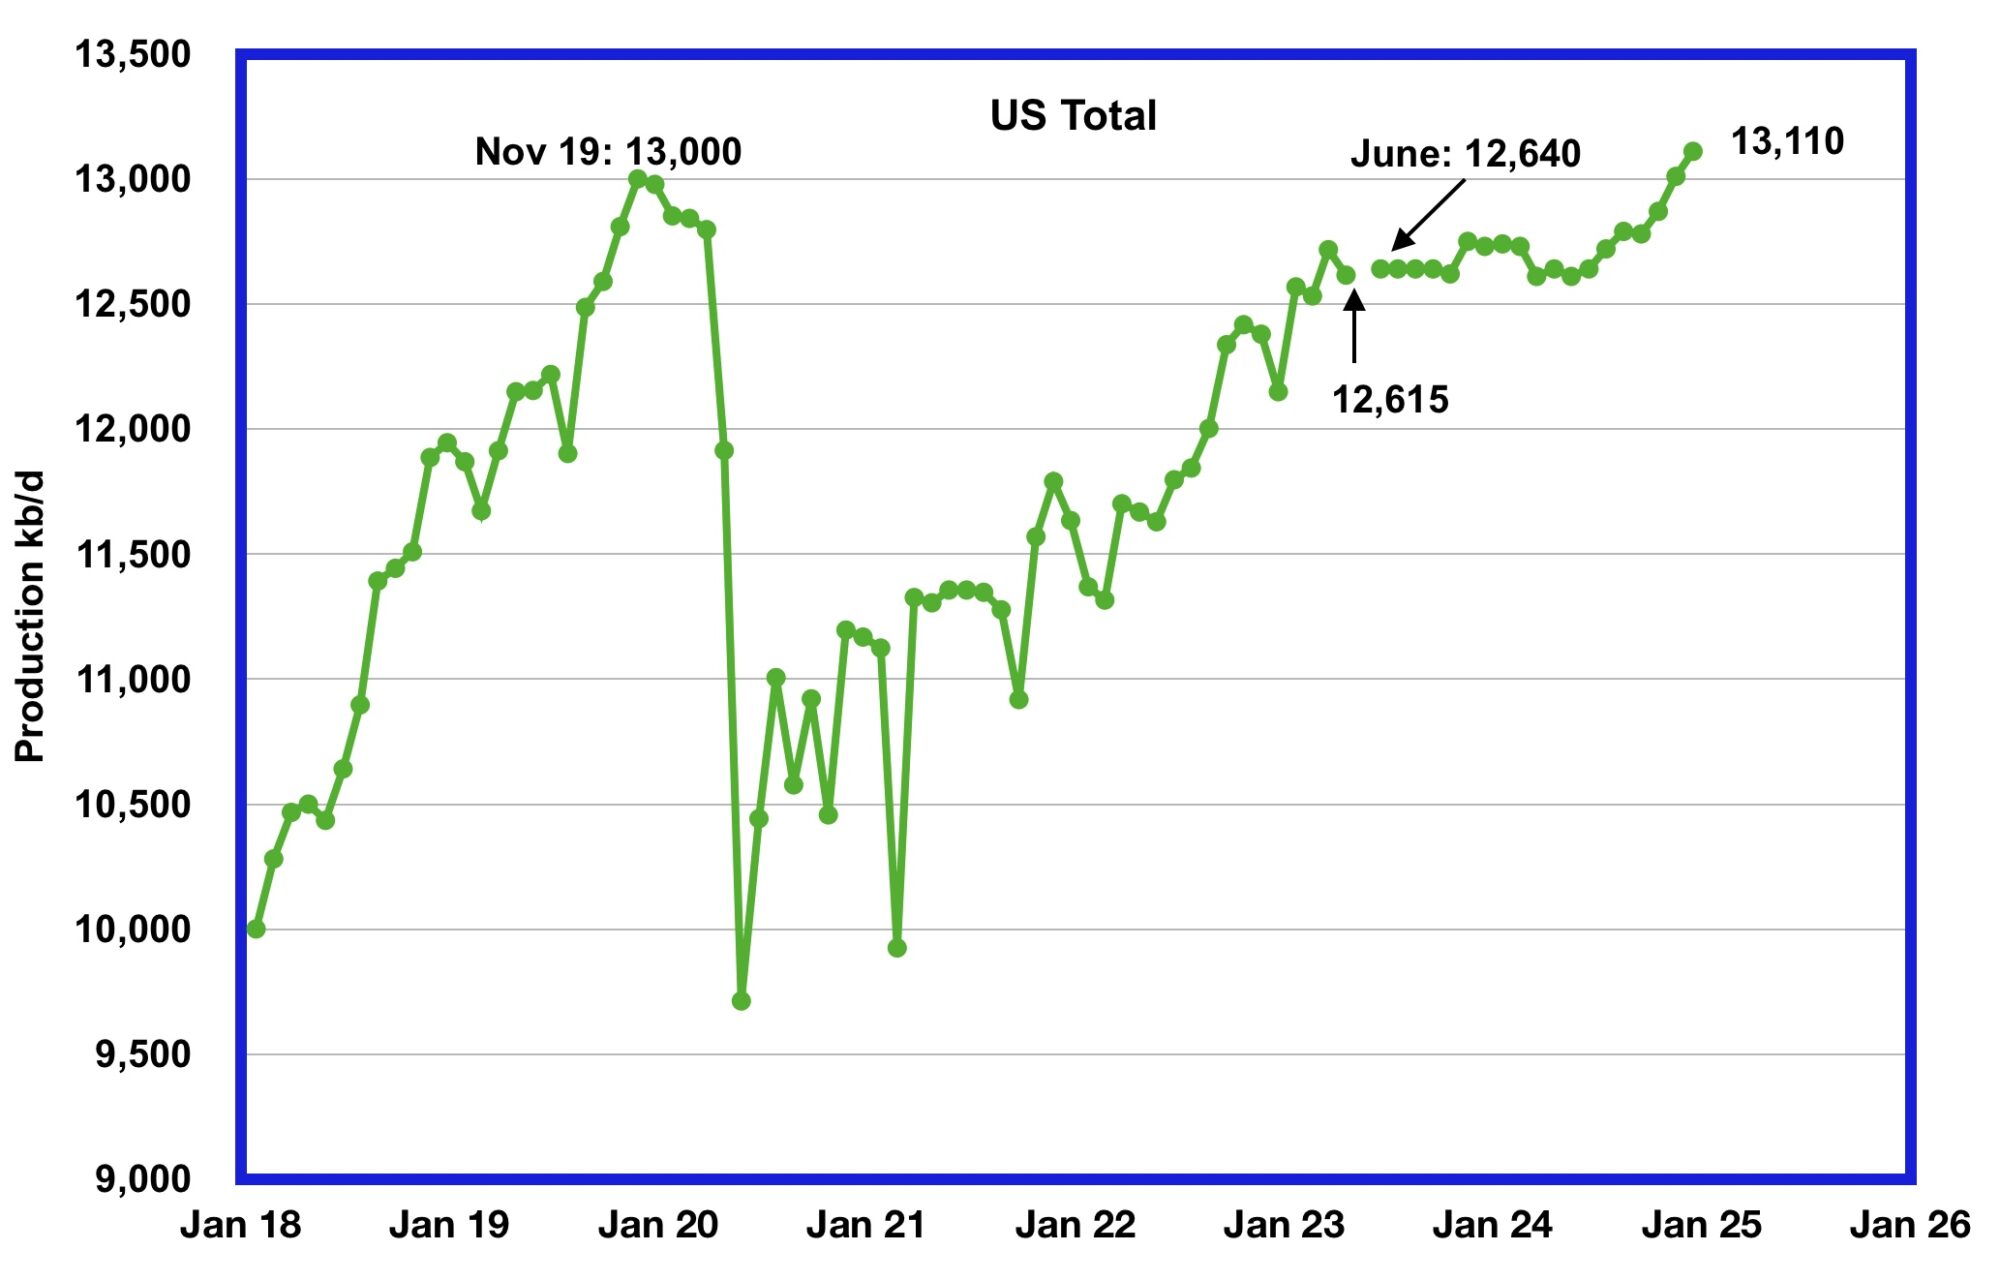
U.S. May oil production decreased by 15 kb/d to 12,662 kb/d, an atypical small change. The small change is primarily due to the upward revision of April output from 12,615 kb/d to 12,677 kb/d, an increase of 62 kb/d.

Read More

GOM Drop Drops US April Oil Production

A guest post by Ovi

All of the Crude plus Condensate (C + C) production data for the US state charts comes from the EIAʼs Petroleum Supply monthly PSM which provides updated information up to April 2023.

U.S. April oil production decreased by 102 kb/d to 12,615 kb/d, a drop from last month’s post pandemic high of 12,717 kb/d. Note that March’s output was revised up by 21 kb/d from 12,696 to 12,717 kb/d.

Read More

US January Oil Production at Post Pandemic High

A Guest post by Ovi

All of the Crude plus Condensate (C + C) production data for the US state charts comes from the EIAʼs March Petroleum Supply monthly PSM which provides updated information up to January 2023.

U.S. oil production increased by 437 kb/d to 12,462 kb/d, a post pandemic high. For January, the GOM contributed 125 kb/d to this high. The states with the largest increase were North Dakota with 97 kb/d followed by Texas with 76 kb/d.

Read More

Winter Storm Drops US December Oil Production

A guest post by Ovi

All of the Crude plus Condensate (C + C) production data for the US state charts comes from the EIAʼs February Petroleum Supply monthly PSM which provides updated information up to December 2022.

U.S. December production decreased by 276 kb/d to 12,101 kb/d. For December, the state with the largest decrease was North Dakota with 135 kb/d followed by Texas with 65 kb/d while New Mexico had the largest increase, 46 kb/d. The December production decline was caused by bad weather in many states.

Read More

US November Oil Production Shows Small Drop

A Guest Post by Ovi

All of the Crude plus Condensate (C + C) production data for the US state charts comes from the EIAʼs January Petroleum Supply monthly PSM which provides updated information up to November 2022.

U.S. November production decreased by 35 kb/d to 12,375 kb/d. For November, the state with the largest increase was Oklahoma with 19 kb/d while North Dakota had the largest decrease, 23 kb/d. The GOM also experienced a production drop.

Read More