Bad Weather Drops US January Oil Production

By Ovi

All of the Crude plus Condensate (C + C) production data for the US state charts comes from the EIAʼs Petroleum Supply monthly PSM which provides updated information up to January 2023.

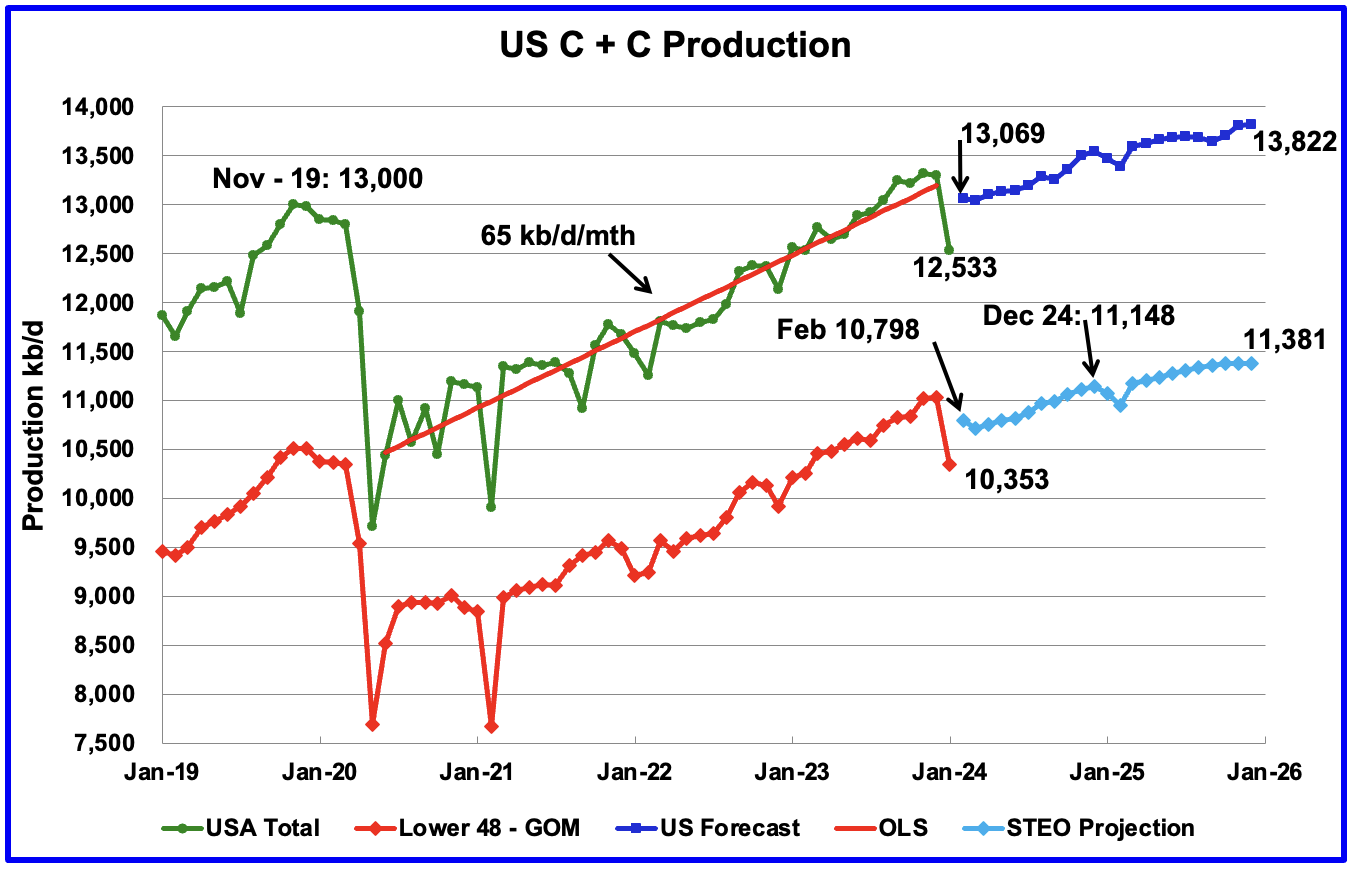
U.S. January oil production decreased by 762 kb/d to 12,533 kb/d. The large decrease was due to a severe US winter storm that was spread across most central states. The largest drop came from Texas, 288 kb/d.

Read More

US December Oil Production Flat

By Ovi

All of the Crude plus Condensate (C + C) production data for the US state charts comes from the EIAʼs Petroleum Supply monthly PSM which provides updated information up to December 2023.

U.S. December oil production decreased by 4 kb/d to 13,315 kb/d. The small decrease was a mix of increases and decreases that netted out to a negligible decrease. The largest decrease came from Texas, 20 kb/d, offset by a New Mexico increase of 23 kb/d.

Read More

Another New High for US November Oil Production

By Ovi

All of the Crude plus Condensate (C + C) production data for the US state charts comes from the EIAʼs Petroleum Supply monthly PSM which provides updated information up to November 2023.

U.S. November oil production increased by 84 kb/d to 13,308 kb/d, a new record high. The increase was primarily due to increases in Texas and New Mexico offset by a decrease in the GOM. Note that October production was revised down from 13,248 kb/d to 13,224 kb/d.

Read More

US October Oil Production Held Steady

By Ovi

All of the Crude plus Condensate (C + C) production data for the US state charts comes from the EIAʼs Petroleum Supply monthly PSM which provides updated information up to October 2023.

U.S. October oil production decreased by 4 kb/d to 13,248 kb/d. The decrease was primarily due to decreases in the GOM and North Dakota being partially offset by increases in Texas and New Mexico. Note that September production was revised up from 13,236 kb/d to 13,252 kb/d.

Read More

US September Oil Production New Record High

By Ovi

All of the Crude plus Condensate (C + C) production data for the US state charts comes from the EIAʼs Petroleum Supply monthly PSM which provides updated information up to September 2023.

U.S. September oil production increased by 224 kb/d to 13,236kb/d, a new record high by 236 kb/d over November 2019. The increase was primarily due to increases in the GOM and North Dakota. Note that August production was revised down from 13,053 kb/d to 13,012 kb/d, which accounts for 41 kb/d of the 224 kb/d September increase.

Read More