The North Dakota Industrial Commission just published their Bakken Monthly Oil Production Statistics and also their ND Monthly Oil Production Statistics.
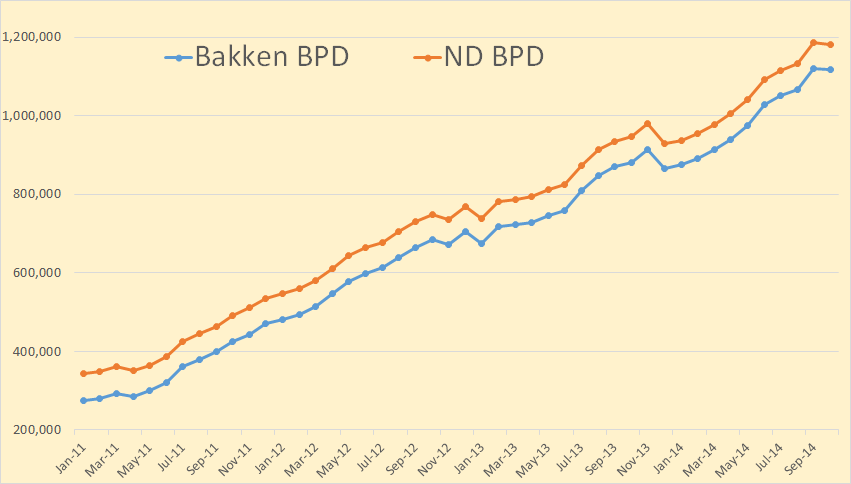
Bakken production was down 1,598 barrels per day to 1,118,010 bpd. All North Dakota production was down 4,054 bpd to 1,182,174 bpd.
From the Director’s Cut, bold mine:
The drilling rig count dropped 2 from September to October, an additional 3 from October to November, and has since fallen 5 more from November to today. The number of well completions decreased from 193(final) in September to 134(preliminary) in October. Three significant forces are driving the slow-down: oil price, flaring reduction, and oil conditioning. Several operators have reported postponing completion work to achieve the NDIC gas capture goals. There were no major precipitation events, but there were 9 days with wind speeds in excess of 35 mph (too high for completion work).
The drillers outpaced completion crews in October. At the end of October there were about 650 wells waiting on completion services, an increase of 40.
Crude oil take away capacity is expected to remain adequate as long as rail deliveries to coastal refineries keep growing.
Rig count in the Williston Basin is set to fall rapidly during the first quarter of 2015. Utilization rate for rigs capable of 20,000+ feet is currently about 90%, and for shallow well rigs (7,000 feet or less) about 60%.
Sep rig count 193
Oct rig count 191
Nov rig count 188
Today’s rig count is 183
Sep Sweet Crude Price = $74.85/barrel
Oct Sweet Crude Price = $68.94/barrel
Nov Sweet Crude Price = $60.61/barrel
Today Sweet Crude Price = $41.75/barrel (lowest since March 2009)
I just checked Rig Count. It now stands at 181 but one of them is drilling a salt water disposal well. So they have 180 rigs drilling for oil right now.
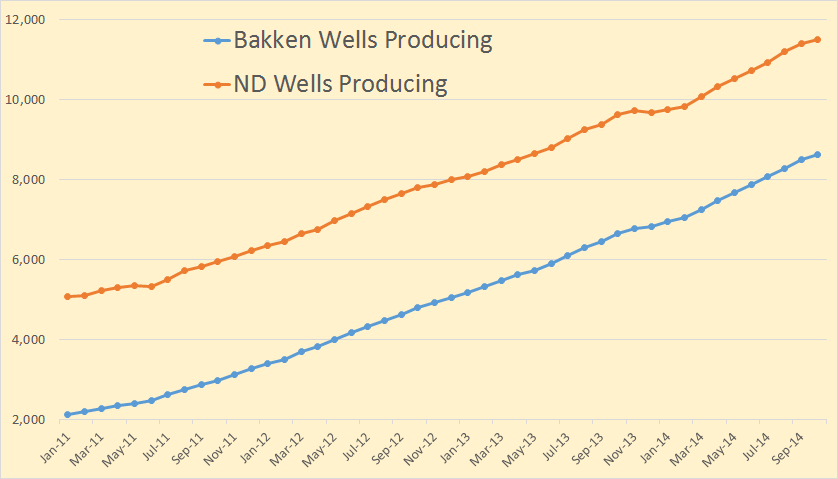
Bakken wells producing increased by 118 to 8,602 while North Dakota wells producing increased by 92 to 11,507. Since Bakken wells are included in the North Dakota count this means at least 26 wells outside the Bakken had to be shut down.
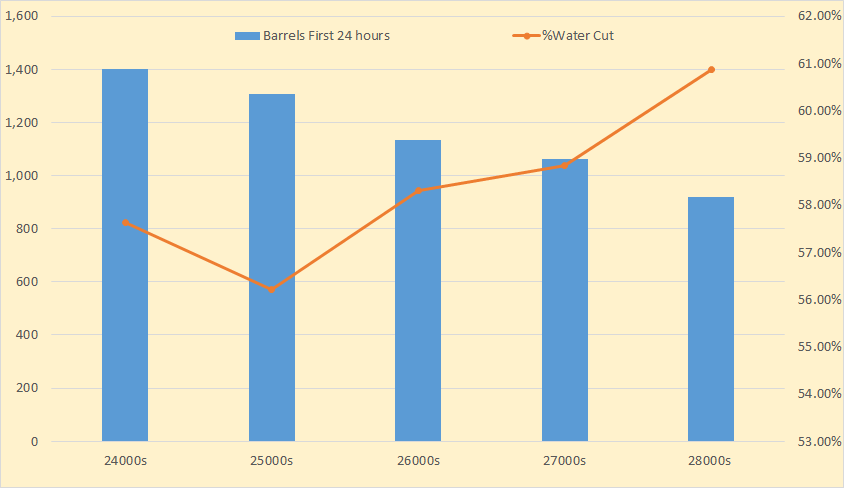
I am still tracking first 24 hours production by well numbers. I am now more convinced than ever that the first 24 hours production is a significant indicator of future production of that well. So far there are only 73 wells in the 28000s however.
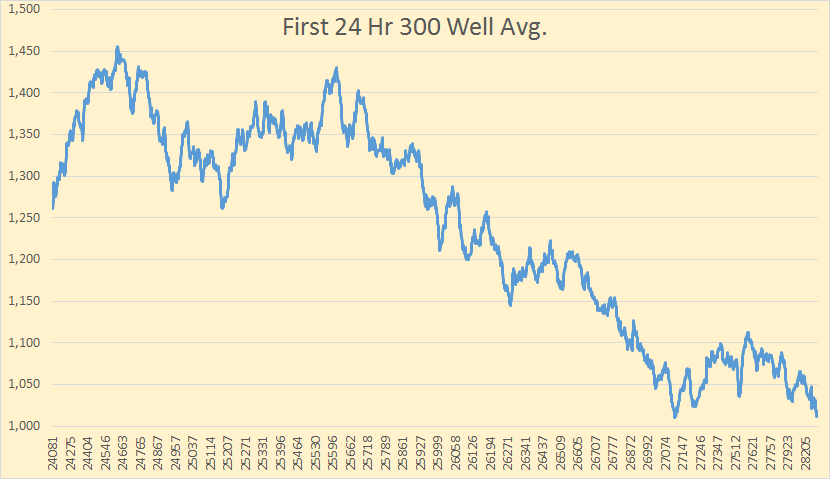
Using a 300 well average and sorting by well number you can see how the BOPD falls off as the well number gets higher. The 27000s seems to have leveled out but I believe it will keep falling as more higher well numbers come on line.
I have 2 weeks worth of data for December. There are 121 wells brought on line so far in December. But concerning the first 24 hours of water cut.
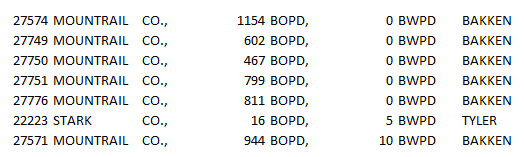
Everyone is telling me the first 24 hours is all fracking water so it means nothing. Welllll… I think the drillers have some way of accounting for that. I sorted the 121 wells I have so far for December by barrels of water per day. Above you see the seven wells with the lowest water cut. If the water that comes up the first 24 hours is all fracking water then there is a problem here. I am willing to hear opinions of what that problem is because I haven’t a clue.
Incidentally at the other end of the sort, the seven wells with the highest water in the first 24 hours, averaged 5,396 barrels of water per well and 1,898 barrels of oil per well.
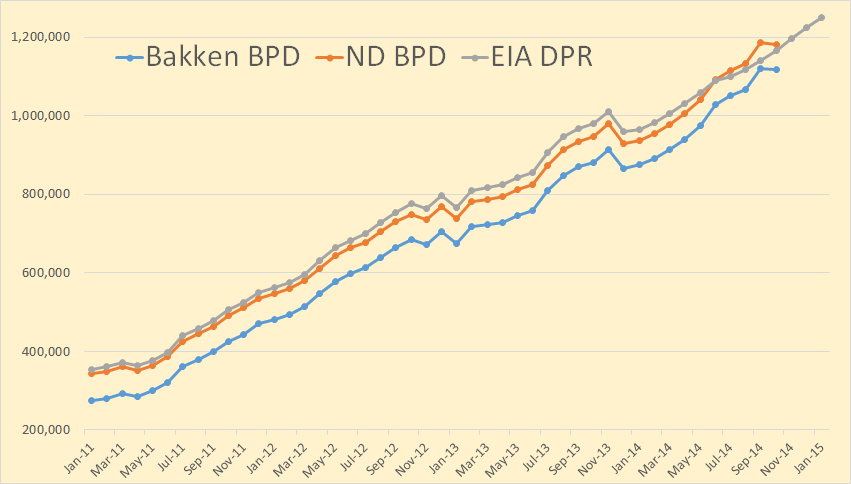
I have included the the Bakken data from the EIA’s Drilling Productivity Report here. Their data is for all the Bakken, including the Montana part, but not the non Bakken part of North Dakota. Their data goes through January 2015. The last six months of the DPR data is nothing but a wild guess.
I wanted to show the DPR data because people and the media keep pointing to it as if it were gospel as to what will be produced from all shale fields within the next two months. For instance this article: EIA: Despite lower crude oil prices, U.S. crude oil production expected to grow in 2015.
The recent decline in crude oil prices has created the potential for weaker crude oil production. EIA’s Drilling Productivity Report (DPR) includes indicators that provide details on the effect low prices may have on tight oil production, which accounts for 56% of total U.S. oil production. Analyzing these indicators and the changes in oil production following the drop in crude oil prices during the 2008-09 recession may offer some insight into possible near-term oil production trends.
They are expecting great things, at least through January 2015. From their report:

They are expecting light tight oil to be up 116,000 barrels per day in January. They think the Bakken will be up 27,000 bpd in January and Texas’ Eagle Ford and the Permian to be up a whopping 76,000 barrels per day.
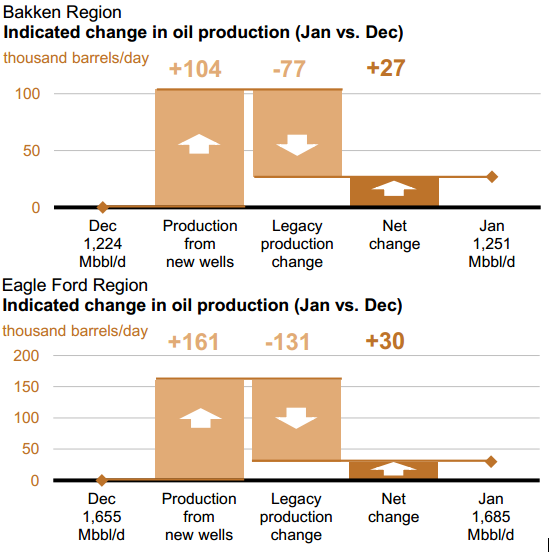
I did the math. If these decline rates are right, then in January, these two fields will decline by 208,000 barrels per day. That is they will have to produce 208,000 barrels of new oil in January just to break even. Or if production declines by just 21.5% they will just break even. I expect new well production from these two fields, for most months next year, to be well below 208,000 barrels per day
The IEA has lowered their expectations for 2015 but only slightly.
Oil Market Report
Global production fell by 340 kb/d in November to 94.1 mb/d on lower OPEC supplies. Annual gains of 2.1 mb/d were split evenly between OPEC and non-OPEC. Surging US light tight oil supply looks set to push total non-OPEC production to record growth of 1.9 mb/d this year, but the pace is expected to slow to 1.3 mb/d in 2015.
Note: I send an email notice when I publish a new post. If you would like to receive that notice then email me at DarwinianOne at Gmail.com.
A good main stream media article on the economics of extracting oil at current prices.
The Saudi standoff: Oil-rich nation takes on world’s high-cost producers
Hard to believe that the recent tumbling oil price is already having an affect on tight oil production. And 134 new wells isn’t enough to keep the Bakken Red Queen at bay. Unless I’m missing something crucial, I’m flabbergasted how quickly things are happening.
These numbers are for October. The price crater process was just warming up and Bakken oil was still nearly $70 (which means WTI was still $86). And even then, production started to fall.
The price is down about 60% (!!!) from then. (41/68)
This is like a bomb going off.
ack down 40%, to 60% OF then.
I would imagine the severe winter weather in November will have had an impact as well, so it’s entirely possible the next data series will confirm your suspicions, but for entirely different reasons.
In general we’re heading into the slower months for Bakken production, so we likely won’t know for certain until late-Spring 2015. That time period will be incredibly revealing though. If well completions, wells waiting to be completed, and rig count don’t do their usual Spring upswing it’ll be very meaningful.
Depending on what happens with Greece in the next few weeks we could see prices fall further, and at the very least stabilize near this current price for a few months. I think a lot of traders are staying sidelined until a clear bottom is in. Everyone knows oil will go back up, so once that bottom is in it’ll have a sharp correction to the upside.
Fascinating stuff unfolding at the moment!
If events in Greece move the world market price of oil, I would take it as proof positive that the prices are pure speculation, unrelated to the fundamentals (that is the cost on the supply side and the pain point on the demand side).
Greece affects the price of oil by the amount of oil they consume. A change in Greek consumption would have only a tiny effect on the world price of oil. Only by the effect they have on the Euro and therefore the Euro’s value to the dollar can Greece affect the price of oil. But that would be a change in the fundamentals.
To say that the price of oil is unrelated to the fundamentals is something a only totally uninformed person would say.
The quoted price of $41 and change is confirmation of the previous month . . . today’s WTI was $57 and change. The delta is $16, and it was last month, too. No dodging that.
$41 has no chance of working out.
Tidbits:
A recent study commissioned by the state Department of Commerce calculated North Dakota’s effective tax rate on oil production at 9.8 percent, making it the fourth-lowest rate among the top eight oil-producing states in the fiscal year ending in June 2010, the most recent year for which comparable data was available.
That was from an article in early 2013 right after the legislature voted to reduce extraction tax to 4.5% (where it is now cuz > 1 million bpd for 3 consecutive months, per the law). But that 9.8 is a tad higher than our estimates. We know royalties are a bit north of 15% so the sum is 25ish%.
The extraction tax item is price related.
“The tax breaks for oil production are invoked when the price per barrel of West Texas Intermediate Cushing crude oil (minus $2.5o per barrel) falls below the trigger price. What’s interesting is that the WTI per-barrel price is not always very indicative of actual oil prices in North Dakota.” The trigger for 2014 is $52 for 5 months. So it has a ways yet to fall before there is a tax break to the bankrupts doing oil in NoDak.
Note that is extraction tax, not income. HY interest expense doesn’t spare the producer from paying the govt.
http://sayanythingblog.com/entry/oil-tax-trigger/
“I am willing to hear opinions of what that problem is because I haven’t a clue.”
Are those wells fracked? Maybe they are verticals or horizontals with money not spent on sand and thus no frack water?
Aren’t these supposed to be producing wells?
They are producing wells.
I don’t think so. Most of them are in Mountrail County, the heart of the Bakken. And the water cut goes up gradually from these wells. It’s not like there were just a few wells with a low water count. The next well up from these seven had 44 barrels of water the first 24 hours and 1,309 barrels of oil. That had to be a fracked well to produce that much oil.
And one of those with zero barrels of water produces 1,154 barrels of oil the first 24 hours. That is a fracked well.
I see the EIA has the Permian posting the largest expected gains of 46,000 bpd, as I posted on the last thread, the Permian has dropped 20 rigs this week. It seems as though the Permian maybe in the vanguard for the slow down.
Sorry Dennis, I used to scoff at all your graphs where drilling came to a complete halt, and production dropped away a very fast rate. The way things are stating to look, you maybe able to dust them off, and look brilliant with your foresight, lol.
With all these fast declining wells that will not be replaced by new capacity, we could be in for a sharp bump in about 12 months, once all these actions start taking effect.
Russia should be an interesting place to watch, as they also have some very fast declining wells. The question will be, will they continue to drill new wells at a fast enough pace with such a low oil price. I know Ron will be our man to supply the good oil on that one.
Hi Toolpush,
Thanks. I think I overreacted when prices went down so low. The point of those charts was that if prices stay at low levels that production would decline rapidly, but I believe I overstated how quickly the rate that new wells would be added would decrease, note that my model suggests that at 120 new wells per month and new well EUR starting to decrease in June 2016 that output would be relatively flat for a couple of years and then slowly decline if prices rise by about 1% per year from 2015 to 2030.
The problem with all of these scenarios is that there are three crucial pieces of information that are unknown and we can only guess at:
1. Future oil prices
2. Future rate that new wells are added to the Bakken/Three Forks (and Eagle Ford)
3. Future decrease of new well EUR as sweet spots become fully drilled, both when this occurs and the rate of decrease once it begins.
Even Ron does not know the answers to these, nor has he ever claimed to know. Sometimes people do not realize that picking a peak date implies knowledge of these factors (though there are many different possibilities for the combination of these factors which will determine the output path.)
Scenario below has two guesses for oil price (low and medium) and both scenarios assume 120 new wells per month starting in June 2015 (falling from 200 wells/month in Oct by 10 each month), the decrease in new well EUR is assumed to begin in June 2016 and reach a maximum rate of decrease of 4% per year 6 months later. In the medium price case (ERR=8 Gb) new wells added decrease in Jan 2020 to 60 new wells per month by June 2020 (decrease of 10 per month) and remain at this level until 2029 when they fall further to 48 new wells per month.
Higher prices or more new wells added per month would result in very different scenarios, also a change in when new well EUR begins to decrease would change things. I do not know what future oil output will be, there are a huge number of variables, the future values of which are unknown.
Another set of variables ids the abandonment rate of production and the exponential decline rate of the tail (in this case I used 15% annual decline rate after 6 years and a low value for well abandonment, these have a relatively small effect through 2020, but influence output from 2020 to 2030 where the guesses become highly speculative.
Dennis, why would you assume the price of crude oil will follow a linear trend? To large degree oil prices have always corresponded to energy investment cycles and obviously wide price swings have occurred in times of shortage/oversupply with cycles extending over several years responding to changes in demand (as well as OPEC/non-OPEC supply). Geopolitical events have also represented a major effect on prices throughout oil’s history. A glance at any oil price chart spanning 1850 to the present looks more like a saw tooth design with no significant intervals containing even approximate linear trends.
Hi Doug,
It is an exponential trend, which oil prices roughly followed between 1998 and 2011 (prices rose at about a 13% annual rate rising from about $20/b to $100/b in 2014$ over a 13 year period).
Just a guess at a rough trendline for oil prices. nobody knows what they will be or where the noise above and below trend will be.
I have not seen your predictions, though I would be happy to use them.
I have on many occasions suggested that people tell me what they think will happen. Ron and Fernando have done so, and Mike as well, I think a rough trendline like the EIA does in the AEO makes sense.
In the few feasibility studies that I have been involved with the main economic metric employed was the average total production costs of competing producers versus the one under consideration: the rational here being, if production costs applicable to a given reserve were lower than most competing production that entity would remain viable during negative price cycles. That’s the main reason small reservoirs were often rejected because their life cycle could be easily trapped within a low oil price cycle. I have no idea how shale operators think. Perhaps they are akin to speculative stock players (where small investors absorb most of the risk). Anyway, I think predicting future oil prices is a mug’s game – too many variables.
Obviously anyone can define different parameterizations of production curves but looking at the graphs of oil production over the past 100 years I fail to see evidence of trends that conform to simplistic defined-curves, linear, geometric, exponential or otherwise (across meaningful time intervals). And, believe me, I’ve studied differential geometry of curves in painstaking detail in my past life. As stated above, there are too many variables affecting oil production. If anything, the lesson from history should be you simply cannot predict oil production across years, even approximately.
“If anything, the lesson from history should be you simply cannot predict oil production across years, even approximately.”
Marvy.
Hi Doug,
You are absolutely correct that oil prices do not follow any trend over long periods. I would think that when oil companies make investment decisions some kind of low and high oil price scenarios would be used.
The financial guys at the oil companies have to use some future guess about oil prices, possibly a window that they expect will define the upper and lower bounds of the oil price. For example in the chart below, I show a low, medium, and high price scenario (low matches the price scenario you didn’t like), we could think of prices fluctuating between a low and high price scenario, they could be anything, but to make a business decision oil companies nees to make some assumption about expected future oil prices.
Doug said:
You are absolutely correct that oil prices do not follow any trend over long periods.
Here is a 47 year price trend curve with a correlation coefficient of 0.965 (first graph). We’ll have to wait for Arch Angel Gabriel to come down with the whole thing engraved on a gold platter to do much better. Quit to the contrary, we know exactly where oil prices are going on a yearly bases with a predictable margin of error. It is only the short term variation that is not possible to predict.
http://www.thehillsgroup.org/depletion2_022.htm
No sir, you do not know “exactly” where oil prices are going, long or short term. I have seen the link to this graph so many times I want to hurl.
Pretty easy to control oil prices.
Bomb KSA pipelines for a nice uptick.
Bomb Shanghai for a downtick.
Precisely, Mr. Margerie; merci. By the way, I hope you are well. The internet works well up (down?) there; how is the red wine?
These same guys also like to say oil prices will never be above 100 dollars again. The world is one little ‘ol brain fart away from total chaos; one of them giant tankers 4 football fields long sunk in the Strait of Hormuz would just about guarantee 150 dollar oil overnight.
Bon chance, mon ami.
Mike
Hi BW Hill,
I said that, not Doug, I doubt that long term oil prices can be predicted. A fit to past data is no guarantee that the future oil price will follow the fit. Numerical fits without a decent theory to explain the fit, tells us very little.
Mike said:
No sir, you do not know “exactly” where oil prices are going, long or short term. I have seen the link to this graph so many times I want to hurl.
The equation of that graph is:
$/barrel = exp(5.4*10^-5(1.4*10^5 / (1+ 361.44e^(-0.053*yr))) + 0.6877)
You are very mistaken, you have never seen that graph before, or anything even close to it. You can not demonstrate a function that can reproduce the last 47 years of petroleum prices with a correlation coefficient of 0.965. Such a statement as the one above need to be substantiated, or they have no creditability.
http://www.thehillsgroup.org/
Dennis Coyne said:
“Numerical fits without a decent theory to explain the fit, tells us very little.”
Sorry Dennis, yes you did say that – not Doug. The derivation of the Etp model is published in a 57 page report that is available at our web site. It is directed toward the professional energy analyst, and is a commercial product. We do supply copies free of charge to individuals for non commercial use if they can show that they possess the necessary mathematical skills to understand it. If you would like to inquire into obtaining a copy contact us at our site. Thanks.
We have now distributed over 500 copies world wide.
http://www.thehillsgroup.org/
If i had such a great oil price predicción tool i would keep it súper dooper triple lock top secret. I would hock myself to my eyebrows, and play the futures market, and gradually take over the world. When I got to my first $500 billion I would buy me a large island, and fund my own army. The rest of it is up to your imagination.
I know it is winter, but with all the slow down about to take effect, do you think we are looking at a production peak for the Bakken?
Hi Toolpush,
If prices stay low, yes. if they rise there may be a secondary peak, it also depends on how quickly oil prices rise, they would need to increase by 2% or more annually.
Re-posted from end of last thread:
I thought this graph from ZH was pretty revealing – yields on junk bonds from the energy companies shooting up through the roof, and starting to take the rest of the high yield market with it:
http://www.zerohedge.com/sites/default/files/images/user3303/imageroot/2014/12/20141212_EOD3.jpg
Yep, it certainly does look scary. Things are getting bent so fast, that something is going to break, and I don’t think we have long to wait!
Tidbit maybe not clear to the oil people here. That graph shows a spike to 988 bps. That’s basis points, not barrels per second. And so 9.88%.
That doesn’t mean the bonds already issued by the companies and bought by the lenders are now going to yield 9.88%. That paper doesn’t change. It was probably issued at 5% and that’s what the lender gets.
BUT.
This paper has its own market. It gets traded, just like any other bond. Quick little lesson. Yield = Coupon / Price. The coupon is the text on the piece of paper that says “the bearer of this paper gets $50 every year”. The paper was issued (bought) for $1000, and so that’s 50/1000 or 5%.
It’s not still priced at $1000. It’s an asset. Its price moves with the prevailing yield (interest rate) and at 9.88% the price has to adjust to make $50 (which is fixed for the life of the bond) equal 9.88%. So that piece of paper, bought for $1000, is now worth $50 / 0.0988 = $506. The owner of that bond, the guy who bought it — who loaned that money to the driller — has lost $494 of his $1000. Already. Before default. He can sell it on the open market and that’s all he’ll get — $494.
He can hold to maturity and get the full $1000 back, assuming no default, but that’s years in the future and all that matters is NOW. What is it worth now. The future is dice rolling.
Point being, the lenders have ALREADY BEEN SCREWED. Hard to see how they are going to anxious to buy more issuance (which is what 9.88% indicates).
“He can sell it on the open market and that’s all he’ll get — $494.”
errr $506.
BTW, in this overall context, a Fed decision to begin buying these bonds, at par value (the original $1000), takes the yield right back to 5%, even with oil price in the Bakken at $41.
The drillers could keep operating because they can still borrow at 5%. Hell, the may ask the Fed to pay more than par value, taking the rate down to 2% and even cooler, do what the Fed does with Treasuries. They never have to be paid back.
The price of oil could sit there at $41 in NoDak, and the drillers can borrow $10 million for each well, drill and pump oil because the well is free. It costs nothing. They won’t pay back the loan because the Fed will just let the paper mature and trash it, as they do with Treasuries.
Behold, what started when QE started.
What a tangled web we weave?
Thanks Watcher for the making the ridiculous simple, it must be all that spook training you had as Big Mac flipper trainee!
I know Watcher annoys people, but that’s a very snobbish comment, Toolpusher.
Bill,
I know humour can be hard on these boards, but there was no snobbery intended. In the last few days a few of the regulars were taking shots at Watchers true occupation. being a spook was suggested due to his broad knowledge of all things. In which he replied he worked at a failed McDonalds.
I am sure everyone has there opinions about our Watcher, but I do not believe anybody would judge that to be a true statement about his back ground.
Anyway, knowing Watcher, if he had any grips I am sure he would let me know. As he is certainly not a shrinking violet, lol
WATCHER could be anybody from an old fat guy mostly stuck in the house like me to a bond trader or a middle man of some sort in the oil business.
There would be some real insights into the way the market is headed to be gleaned from a site such as this one.
And while I caught him out on chainsaws a couple of days ago- that proves nothing because he could have deliberately written his comment in such a way as to conceal a knowledge of loggers tools.
There are at least two sides to spook theory – desk jockey spooks keep an eye on websites and newspapers for any relevant info.He may be writing a tight little report twice a day on what is posted here and forwarding it to his employer who might be anybody from a paper trader to an assistant to the director of Homeland Security.
Or the personal secretary of the ceo of Exon or BP.
I am the dead CEO of Total.
Thanks, toolpusher, I withdraw my comment unreservedly!!
With qe government buys government bonds not junk.
I read somewhere that venezuelan bonds are paying very attractive interest rates, near 20 %. And a birdie told me their oil exports are down.
The way you calculate the yield to maturity is wrong. It is not that simple and depends on the time to maturity. For example, if the bond has a face value of 1000, yields 5%, the current price is 500 and matures in a year, the YTM is 101% (and not 10%). If it matures in 2 years, the YTM is something a little north of 40%. This is simply because the bond issuer has to pay the face value on maturity.
– Lurker and a bond investor.
Sorry 110% (not 101%)
We ain’t adding it up to maturity. The bondholder cares about NOW. He’s down a ton.
Of course, more to the point, what’s the yield to maturity for the Fed, who may buy such things, bearing in mind that they refund all interest Treasury pays them.
When they are saying a bond yields 9.88%, that is what it means. Its yield to maturity. If you are issuing a bond for a period of time, you are obliged to pay the face value on maturity provided you are solvent. Hence the yield which is stated is what is your return per annum compounded if you hold it till maturity. So yield is not coupon/price like you have stated. That is simply false and misleading to guys who are uninitiated. The bond holder is down a lot depending upon when the bond matures but he is not down 494 bucks as you have calculated. And it is applicable for FED too.
Well, I took 9.88 from the posted graph.
I don’t even know what we’re arguing about. I didn’t calculate 9.88%. That was the posted rate from Bloomberg? Actually I didn’t go look at where the quote came from, but it was a quote, not a calculation.
Ahhh, wait — you are typing very clearly yield to maturity and I was reading a different blog talking about future annuities. You’re right. YTM is a more accurate evaluation when looking at a comparison of various instruments with different coupons and maturities — but . . . we’re somewhat not, really. The point was the bond the bondholder bought (from the issuer, at par), when prevailing rates were 5%, and now they are 9.88% (not calculated, quoted) and that means the price of his asset has declined and he’s got a big loss.
To be clear … and if there is not bankruptcy:
1) If several years ago you issued a bond at $1000 with yield 5%, whatever happens on the bond market, you have to pay $50 every years until maturity.
2) If you are the lender, you will receive $50 every year until maturity and $1000 at maturity. However, the mark-to-market reporting will increase your assets if hield is below 5% and decrease you assets if yield is above 5%. In the initial Watcher example, (not sure about his computation), the assets will be evaluated at $506, so the lender would book a loss of $494.
3) The market yield will be important for new issuers or lenders, or to people involved in the secondary market. So a company wanting to issue a new bond should pay 9.88%, an investor buying a the bond on the secondary market would get an return of 9.88%.
The equation to compute the new asset value is the following: $1000 * ( 1 + N * 5%) = MV * (1 + N * YTM) where N is the number of year to maturity, MV, the market asset value and YTM, the new market yield to maturity.
In summary, higher yields are important for lenders (lower asset value in balance sheet) and NEW issuers (they will have to pay that yield).
the lenders have ALREADY BEEN SCREWED.
That’s very unlikely. The original lenders will have sold the commercial paper on the secondary market and become liquid, ready to lend to someone else.
They’ve lost nothing.
It’s weird, and hard for people outside the financial world to believe, but there are always lenders ready to give money to bad risks – they just ask for higher interest rates, and other sweeteners.
Look at Greece – they’ve been going bankrupt for every 25 years, for the last 200 years. Someone always lends to them the next time.
Yeah it’s funny reading this stuff given after the OPEC decision a lot of the further falls have come on the back of what someone said or some report of how much production will grow and not once was it questioned.
TAKE IT FROM THE FARMER.
Commodity prices in the real day to day world are determined almost solely by what the end user is willing and able to pay.
When you get away from day to day and start talking month to month and year to year then the producers cost come into play. Hardly any producers are able to make significant changes in their production on a day to day basis especially in a business as complicated as oil.
Even in a relatively simple business such as farming it takes a year for the producers to change their production schedules to any noticeable extent and farming is dominated by small independent operators.
The people in the oil industry are well started on cutting back production- but production will not actually fall off to amount to anything for months yet and more likely closer to a year.
The FUTURE PRICE of oil has to do with expectations. TODAY’s price has to do with reality on the ground TODAY.Next year and five years from now have almost nothing to do with the price of oil TODAY.
When the end user just doesn’t want ( can’t afford) your product anymore he quits buying it and the price goes down.The wholesalers orders fall off and he quits ordering and the factory starts laying off.
The thing about the ” oil factory” is that it takes a while for the high cost producers to shut down.
The high cost producers will shut down because reality forces them to. The low cost producers will continue to produce because they are still making a profit and want the money.
They will be making a LOT more when the price goes back up of course which gives them some incentive to maintain production now in hops of crippling the high cost competition and keeping it on the disabled list for a good while.
Some people even think the competition in the form of tight oil won’t EVER come back but I think they are badly mistaken.There is obviously a price at which tight oil IS profitable and oil will most likely go up to that price if not next year or the next then the year after that or the next one.Depletion never sleeps.
It is true that a lot of hedging may have been done meaning a lot of end point sellers may be OBLIGATED to take what they contracted for- in that case it just drives the short term price – the spot price even lower as they do what they can to get rid of unwanted inventory- generally by running a losing money sale price on it.
Ron, can you do a little statistical analysis and see if there is a correlation between first 24 hour production and first year production? I think that could help prove one way or the other whether you’re right.
I will see what I can find out. I can only do a few wells because each well would have to be searched seperately but I will try to pick out a few very low first 24 hour producers and a few very high ones and see what comes up.
One can get an idea of the correlation between the first day production and the annual number by using the Bakken decline curve presented by D. Hughes in his recent report, “Drilling Deeper”.
Using the Arps Hyperbolic function to model the monthly data provided to me by Mr. Hughes shows that the flow rate at time zero is 667 b/d. Note that at the end of the first day, the rate is down to 657 b/d. The initial and month 12 rates provided are
Mth Rate (b/d)
1 548
2 423
6 243
12 157
Doing the detailed analysis provides the following results. First year production is 41% of the initial production rate. Second year production is 19% of the initial rate.
To put some perspective on these numbers, below is a back of the envelope estimate.
Adding up the first 12 months of the Hughes production rate data gives an average rate 3252 b/d. Multiplying by 30.416 gives 98,912 bbls for the first year, close to the Arps cumulative number of 99,115.
The problem is, how to estimate the first day rate from the monthly rate. The rate drop between months 1 and 2 is 548 – 423, 125 b/d. Since the 548 b/d rate occurs around mid month and assuming linearity, adding 1/2 of the 125 to 548 to gives an approximate first day rate of 611 b/d. This is 56 b/d lower than the Arps value of 662 b/d, about 8%.
Using the approximate initial rate of 611 b/d gives an annualized production of 223,015 bbls. Dividing the estimated first year production of 98,912 bbls, obtained from the Hughes data, by 223,015 yields 44%, which is 7% higher the more accurate estimate of 41%.
It would be interesting to see how close some actual data comes to this approximate estimate of say 40%.
That looks interesting, but you are at the mercy of variable choke.
The well reserves over 15 years won’t change that much. raising flowing bottom hole pressure helps manage gas, should reduce water production. I wonder if they considered using a higher gathering system pressure? That ought to cut back compression costs. Do any of these operators optimize their systems?
Falling Oil Price slows US Fracking
http://oil-price.net/en/articles/falling-oil-price-slows-us-fracking.php
From my website:
11/12/2014
World on drip of unconventional oil
http://crudeoilpeak.info/world-on-drip-of-unconventional-oil
3/12/2014
US crude imports from Non-OPEC countries peaked 10 years before tight oil boom
http://crudeoilpeak.info/us-crude-imports-from-non-opec-countries-peaked-10-years-before-tight-oil-boom
US Peak Oil II is here and soon will be gone. Print it. Peak Oil is history, i.e., in the rear view mirror.
The energy junk debt bubble is bursting, which will precipitate defaults on US and Canadian C&I bank loans and bust the offshore shadow banking’s carry trade that is levered 50-80:1, increasingly via emerging market (EM) debt, US Treasuries and MBS, and equity index futures.
The current debt bubble is global in scale and now larger than that which preceded 2008-09. The coming debt-deflationary collapse will be unprecedented in history, making 2008-09, 1929-33, and 1893-98 look like an amateur-hour rehearsal.
This is what the collapse in oil and $2 or lower gasoline in 2015 is signaling.
Japan’s monetary base now exceeds the value of loans of the largest Japanese banks. At the current rate of growth of the Japanese monetary base, the base will reach par with total loans by late 2016. The US is on the same course, implying that the Fed will eventually be directed by the TBTE banks to print another $2-$4 trillion in bank reserves to liquefy banks’ balance sheets and to provide sufficient liquidity to clear (monetize) US Treasury issuances to run the necessary fiscal deficits to prevent nominal GDP from contracting hereafter.
This implies the 10-year Treasury yield at 1% (like Japan and the EZ) and, by extension, wages, CPI, and nominal GDP decelerating to 1-1.5% in the years ahead.
The shale boom/bubble was not economically justified given the level and no growth of US consumption and the uneconomic energy costs of extracting costly, lower-quality crude oil substitutes.
Some argue that the price of oil is collapsing because of a glut of oil, but the glut is a result of Peak Oil pushing up the price of oil that we cannot afford to burn and grow real GDP per capita. We will have a permanent glut of costly crude oil substitutes that we cannot afford in terms of energy costs to extract that permits a sufficient supply of affordable costly oil in order to grow the economy.
Peak Oil, LTG, the end of growth, population overshoot, the onset of the post-Oil Age epoch, over the Seneca Cliff, and back to Olduvai we go.
BC- very well said, and that’s just about how I see the whole deal as well.
I especially think that population overshoot is the root cause, and low and behold you have billions of poor young, and now a growing hoard of poor old who can’t afford to live “the consumer dream” in a world with expensive fuel. All the QE, and yen printing in the world won’t fix that.
Most of all the others problems stem from this population overshoot, which was enabled by 100 million years of crude accumulation being tapped and burned in just about 100 yrs.
Ouch.
BC,
You are severely misguided. There is going to be no debt deflation. I will repost my response that I wrote on the clueless Raul Ilargi Meijer’s Debt deflation nonsense website.
“The total Debt in the world depending what all you count in it, is around 200-235 Trillion. This is the basic amount that is used for fear mongering. Comparing it to GDP it looks high. That would show a high Debt to Ebitda ratio if the world were a corporation.
But focusing on income ignores a very important side of the equation.
Which side you ask? I am glad you asked Raul Numbskull Ilargi.
The question is what is the value of the world Equity? I know this may be foreign concept to you so I will elaborate. The world total assets is the sum of the World Equity (not equity like stocks, but equity like residual value after Debt is paid off) + World Debt. So what is the value of world total assets?
That is incredibly hard to figure out as values for a lot of things simply do not exist or are unknown.
But we do know values of a lot of things. For example World Financial assets (stocks, bonds, money market funds, excluding all derivatives) is close to 300 Trillion, and total world Residential and Commercial Real estate is 250 Trillion or so. There are many, many, other assets which are owned by Governments which do produce revenue (for example roads and bridges which are toll taxed) that are not included in this count. Gold and other precious metals are also excluded. The value of all of those would conservatively be 150 Trillion and probably a lot higher. So total assets would be 700 Trillion. Subtracting out the Debt gives you between 465 and 500 Trillion as world Equity. For a Debt to equity ratio of around 0.4 to -0.5. Now most single companies have rarely gotten into trouble until Debt to equity exceeds 4. So at 1/10th those levels only a retard like you could think that. That is why you and Nicole Foss have repeatedly missed the big picture and got everything wrong. And every now and then when after years of fear mongering something remotely goes your way you have orgasmic debt rattles. Actually I have left out the Net value of all private corps. That data is not easily available but most people believe it is between 1X-2X public corps. So between 300 Trillion to 600 Trillion.
That Means your total world assets are 1.0 to.1.3 Quadrillion giving a debt to equity ratio of around 0.2 to 0.15.
You think these numbers are made up?
How about this? This is actually Statistics Canada’s graph.
http://www.statcan.gc.ca/pub/11-008-x/2011001/c-g/11430/c-g003-eng.htm
Showing Canada’s debt to Assets of 0.2! That would imply a Debt to Equity of 0.25! So fucking scary. That chart actually says that it is at the highest level in 35 years and it is still so incredibly low. I actually pointed this out to you in early 2009 as to the reason stocks would rise big time and you made fun of me. Sorry for being like you.
And BTW the average Return on Assets by companies is around 6-8%. So 1000 trillion producing a world GDP (income of 60-70 Trillion would make perfect sense). “
Pretty sure that in that amorphous financial gobbledygook there was a personal attack.
You are correct. I agree it is hard to work out in view of Huck’s poor punctuation skills. Had he inserted a comma before the word “Raul” in line 7 the personal attack would have been much clearer.
As it is, he makes”Raul Ilargi Meijer” the object of the verb “asked”, making a nonsense of the sentence. The ensuing sentences are in the same nonsensical vein.
This character has been trolling over at theautomaticearth for some time.
I have been trolling there. We chose different ways to do our battle. I believe his deflationist view is extremely damaging to people. While I find my own methods crude (haha) I have yet to find one person show that my numbers are even remotely off. That includes Prechter’s family of idiots too.
I won’t troll here as Ron Patterson even on his worst day could not think as 1/10th as stupidly as those two nutcases.
I’m pretty sure your total debt calculations are just government debt, not total debt.
Statscan link confirms that at an individual level Debt to asset ratio is 0.2.
“I’m pretty sure your total debt calculations are just government debt, not total debt.”
You would be pretty wrong.
http://blogs.wsj.com/economics/2013/05/11/number-of-the-week-total-world-debt-load-at-313-of-gdp/
Sounds clumpy… Does it come in a lotion?
But seriously, this is yet another example of complexity and, say, the ‘oligarchy’ or ‘high priesthood’ of information/knowledge. Like legalese.
It’s a trap.
Knowledge is power, status, with power comes responsibility. Or not.
…POB could have a status-o-meter… maybe using something like WordPress’ voting widget.
You forgot to add in the value of all of the ocean’s water, that resource, the value added for ships to be able to sail, the value of the ice cap covering Antarctica, the ice covering Greenland, the coal, the oil, photovolts, wind production, the value added from electricity production, enhanced manufacturing from the available electricity, all of the icebergs in the North Atlantic, the fresh water there, etc.
The totals become astronomical.
The US Treasury should issue a check to everybody on planet earth for 100,000 dollars.
What’s 7,000,000,000 times 100,000?
700,000,000,000,000 that’s seven hundred trillion dollars.
Subtract a 3 percent tax for administrative fees, raise 21 trillion dollars instantly, pay off the national debt in seconds, everybody can afford to live for a few years, buy groceries, the banks can do bail ins, charge fees to keep the hundred grand in everybody’s accounts, they’ll be able to pay off their debts, the world has 700 trillion dollars in cash. The price of oil would become expensive and gone in hours.
What could go wrong?
Good points Ron, and don’t forget the value of all the data in the cloud- just imagine its auction value in the future. And how do you value the productivity of soil microbes, and the work of insects on your sovereign territory?
And I had thought Huck Finn was supposed to be a likeable character.
You are confusing two issues which TAE does quite often.
1) Is debt enough to cause massive deflation…and the answer is no. Would someone who has $60,000 loan on a $300,000 house be considered insolvent? That is virtually impossible. Yeah shit happens occasionally but that is not the average.
2) Is resource depletion and environmental destruction a problem? Yes.
It is. Ron Patterson and everyone around who has worried about this stuff is correct.
But bringing them together to spew a complete garbage of madness? What is the point?
Yo Huck, have a try at this one.
Is eroding EROEI the sort of reality that biases all systems towards deflation entropically.
EROEI only matters if the energy which is the input is non-renewable. if the energy input is for example solar EROEI becomes merely a measure of efficiency.
If you make (m) ethanol from water and CO2 using electricity from a solar or hydro (both energy capturing methods which relatively quickly pay back their own energy input), what is the EROEI?
Rgds
WP
Exceptional answer WP.
You know Watcher your answer reminds me of Robert Prechter and Raul Meijer’s thought process. You know RP spent over 2 decades trying to find a wave count that would create DOW 1000, because he had to see Deflation. Even with oil, that genius saw that $20 would be the peak and we would go to $4!. He was wrong in 2008 by a factor of 35. But hey he still continues to talk about deflation.
If we create an Electric Car Fleet and with the improvements we see in battery efficiency, we improve our EROEI by a factor of 5 as we are using Coal and not oil anymore. I don’t see that happening within 10 years but when it does deflationists will point to the fact that we will reaching Peak Solar power in 40 years and eventually things will all go downhill. Yeah eventually everything will go, but unlikely in our lifetimes.
Does Prechter have anything to say about oil production and how effort to get it rises? I thought he just looked at squiggly lines.
He predicts constantly lower prices, constant imploding deflation and hence was relevant to the topic I thought.
EROEI is only eroding for fossil fuels. For renewables, it’s rising (even though it’s already high enough).
Renewables don’t exist in a vacuum. They require or make assumptions about certain questionable (ethically and otherwise) sociopolitical and infrastructural forms and commitments.
At the same time, I am unsure what is factored into EROEI calculations, since some energies invested don’t always seem to factor in (energy investments in) such things as manufacturing, shipping, maintenance, land-use, pollution, health effects, cleanup, affordability (haves/have-nots), and even social unrest that might come from any of the above.
And then there’re cost-benefit analyses.
There are well known standards and procedures for developing EROEI calculations.
They certainly include energy related to manufacturing, shipping, maintenance, and land-use. The rest are not energy, and therefore not part of an EROEI calculation.
Affordability, of course, is part of a cost analysis.
Any standards/procedures that neglect various energy inputs over the course of a form of energy’s lifecycle seem questionable. I cite nuclear energy’s waste disposal and accident management as two simple examples.
But then, this is like some forms of so-called economics as well, such as with regard to the neglected costs of externalities.
Many cost-benefit analyses are a joke.
EROEI analysis isn’t expected to handle everything, you have to expect your analysis to be a little more complex than one simple quantitative measure.
Heck, if you’re going to try to boil everything down into one simple measure, why not use dollar cost?
No kidding.
Even so, all the measurements in the world, all the uneconomic mumbo-jumbo (that few really seem to understand, even those who are supposed to) are not going to make a better difference without real, pure direct democracy/lateral hierarchy, which includes Earth and the living beings on it.
Pure democracy– control/input over/into your own life– seems to plug, inextricably, into climate change, for example.
That seems to imply doing away with cops, military and governpimps.
If we care about climate change, we care more about democracy/hierarchy than, say, EV’s, PVs or EROEI, and make it more of our narrative or discourse; more about who we are and what we need as priorities.
BTW, over here in so-called Canada, a hint, the secret, to much of our ecosociopoliticultural problems might be found on its 20-dollar bill. In your face, in your pocket, in your food, in your life: Oligarchy; undemocracy.
I don’t think you understand this subject very well. If a companies assets exceed its liabilities it is technically insolvent, you wont be able to borrow very much if your debt is equal to 80% of your assets, let alone 400% which is the point you claim companies start to get into trouble. Your total debt seems very low, US govt unfunded liabilities alone are calculated at around $100T and growing, which is half your total world debt, seems unlikely. Unless of course you are assuming that promises to corporations should be honoured and promises to voters should be defaulted on.
I’m not getting into inflation v deflation debate, but if you are going to rant and rave, and post an ad-hom you should do a bit more thinking first. You have raised some interesting points, but I suggest you use a more constructive approach instead of launching into ad-homs.
If a companies assets exceed its liabilities it is technically insolvent,
Don’t you have that backwards?
“If a companies assets exceed its liabilities it is technically insolvent”.
I think as Ron mentioned above you meant Liabilities exceed Assets.
But you are misunderstanding what I am saying which is quite common among people who confuse Equity with Assets.
I spoke about a Debt to Equity ratio of 4:1. NOT debt to asset Ratio of 4:1.
So If you buy a $250,000 house and put done $50,000, you have $50,000 Equity, $200,000 Debt and your Assets are $250,000. Your Debt to Equity Ratio is 4:1 and your Debt to Asset ratio is 0.8.
Now in the example above most people might think that is a fantastically large downpayment and the borrower would rarely get into trouble. I am saying that, that level described above is the minimum level at which a corp would get into trouble.
Now the Current ratio for the world is as if the World bought the same $250,000 house and paid for it with $200,000 Cash and $50,000 debt.
So Debt to equity ratio is 0.25 and Debt to asset ratio is 0.2.
As the benefits of shale (lower trade deficit, higher economic growth) existed mostly for the US economy, the damage is also now for the US economy. Emerging markets are multiple times outperforming the DOW (Shanghai and Mumbai are up more than 50% during the last three months) and the bond market (EMB outperforms HYLD by 30 % during the last months). The US economy provides the world with cheap oil at its own high costs. This is an huge economic advantage for the rest of the world. China oil and copper imports are at seven months high, India metals and ore imports up 100% yoy, Indonesia production up 10% yoy…. The world is already booming at the expense of the US economy. Furthermore the dollar has already shown a significant reversal (long down candle followed by a long up candle). So, things are very likely getting much better for the world economy) when the dollar starts falling. The US economy has painted itself into the shale corner, which would be only a good position if oil prices would be very high. At low oil prices this is just a fantastic opportunity for the world economy to grow and create jobs and bring many people out of poverty worldwide. The US economy does here a fantastic charity job. Thank you.
The US economy provides the world with cheap oil at its own high costs.
Isn’t the US the second largest importer after China?
ok. It provides also cheap oil and gas to its own economy. However, the net benefit is important. The US imports around 6 mill bpd, the rest of the world around 25 mill bpd. On the other side the US has 10 mill bpd (inclusive natural gas) high cost energy production and the rest of the world close to none. So the balance has shifted significantly towards the rest of the world. At the current level of oil prices, shale is a significant burden for the US economy. This may change over time as I am sure oil will go up again.
There’s been some discussion as to whether lifestyle and income are depressing the demand for oil, especially in the US. This seems relevant. Some have argued that this is only temporary, and as soon as incomes rise, people will go back to their old spending ways. But what on the horizon is going to make incomes rise?
http://op-talk.blogs.nytimes.com/2014/12/11/for-millennials-home-might-be-a-moving-target/?partner=rssnyt&emc=rss
http://www.eia.gov/dnav/pet/hist/LeafHandler.ashx?n=PET&s=WRPUPUS2&f=W
Some argue stuff that’s wrong. This ain’t much of a decline and what there is of decline is from the 2008 global Apocalypse that continues.
The reduction in demand meme is bogus. Looks like 20 mbpd of everything, but even though it’s not pure crude consumption, hard to see how it would vary a lot from that graph. mazama’s graph looks the same. This “US is reducing demand” stuff is delusional.
Now that I squint at that it looks clear that every week above 2014 is above 2009. Looks like demand is increasing, don’t it?
Watcher,
The claim for the falling oil price is the lower demand. I don’t believe the lower demand is from the US, but other counties. Since the oil price recovered form the 2008-09 thing, Brent has been over $100 and Tapis a SE Asia oil has been $120. It has been these prices that have fallen the most, and have basically forced WTI lower. Tapis was $20 to $30 more expensive than WTI, is now $66, just $8 difference.
As you note, US oil demand is actually increasing, after the 2009 dramatic drop in consumption. You will need to look out of the US for the so called drop in demand.
Currently, I think many people explain oil price crash by falling demand. This is not correct at all… It should be stated “demand is GROWING lower than expected”. It is incredible how the mainstream media are washing the brain of anybody. So don’t try to find which country has demand falling to explain the “lower demand”. Moreover growth in LTO production was so high that supply is now higher than consumption. The difference is stored, but storage has also limits. I saw recently an article stating that if this oversupply continues, oil sill be stored on sea (in tankers)…
You can get a much better view of what’s going on by looking at the monthly data and then shortening the time base. Of course you will have to make your own graphs, but this is quite easy. The last data point in the chart below is October 2014.
Monthly Energy Review
On that scale it looks pretty flat post 2009, so a meme of US oil consumption dropping because unicorns and flowers have arrived and people gently and in a sense of namby pamby community are all gathering together to not consume oil . . . is crap.
There is no down ramp. There is the 2008 Lehman Apocalypse event and there is nothing else. A GOP Congress will quickly see to it waivers are granted for all CAFE silliness and mazama/BP will show no decline in Chinese consumption this year, nor anywhere else than maybe Greece.
There are no unicorns. Never have been. Never will be. The only significant drop in consumption we will ever see will be imposed by military force.
In fact, now that I notice it, even an Apocalyptic event of Lehman magnitude only got 10% off the US consumption . . . because there is no wastage. What came off was economic activity.
Looking even closer, the Bear Stearns preparatory even to Lehman is also visible. All that upheaval, and all you get is 10, maybe 15%. hahahaha What a disaster.
”The only significant drop in consumption we will ever see will be imposed by military force.”
I assume you mean short to medium term and no unforeseen economic heart attack.
For damned sure consumption will eventually drop due to geological factors and or an economic shift to other energy sources.
I am agnostic about renewables EVENTUALLY being scalable to the extent they can shoulder the load but only because of the ambulance on the way to the hospital aspect of bottleneck and overshoot.
The current remaining stocks of fossil fuels are in my estimation certainly adequate to build out enough renewables to give up fossil fuels- IF we were to get started on the job in a determined way and simply stay after it.
Unfortunately seven billion naked apes aren’t going to get after ANY job except each other and making more apes in a determined way and keep after in.
The reason I believe it is possible though is the snowballing effect of economies of scale. The more you build the cheaper it gets until you run out of raw materials and the two utterly essential materials are sand and an energy source. There is coal enough and sand enough to spare several times over if we were to go for renewables and efficiency the way we go for destroyers and tanks and icbms and mindless entertainment and junk food.
The ” positive ” positive feedbacks would be simply astounding if the decision to go for renewables on a war time footing is ever made and implemented.
I really do have enormous respect for the Wonderful Wonderful Market and the Invincible Invisible Hand.
If the supply of fossil fuels were large enough that the downside of the supply curve would be long and gentle and we were not faced with economic and ecological collapse due to overshoot the market would take care of the ff depletion job for us.Renewables , conservation and efficiency would come into their own about as fast as fossil fuels depleted.
Unfortunately the Market and the Hand are not really on the job and aren’t going to be SUMMONSED to the job by price signals until even the efforts of THE MARKET AND THE HAND are going to be too little too late.
The meme most journalists and economists seem centered on is that changing habits – like people moving to urban areas, using mass transit, buying higher mpg vehicles, driving less in general – led to lower demand for oil in the U.S.
To me they put the cart before the horse. Global net exports were shrinking, less oil was available, so demand by importing countries HAD to fall. Prices rose until import demand shrank to match available export supply on the global market. The result? Involuntary changes in behavior that lowered oil consumption.
The fundamental premise that is wrong is that U.S. oil consumption is lower due to voluntary changes. We chose to use less! Yay!
In reality, lower consumption was forced upon importing countries and people rearranged their lives to cope. When “voluntary” changes don’t drop demand fast enough to reach equilibrium with declining supply we get recessions.
A recession is basically when small, elastic reductions in consumer demand aren’t large enough to equal reduced supply. What then occurs is that more inelastic demand from commercial and industrial consumers must ALSO decline. That commercial/industrial decline IS a recession, and is usually heralded by a rapid rise in oil prices.
It all comes down to elasticity, and which sectors have elastic or inelastic demand curves. Markets had been driven by the demand curve over the last decade, but the inelastic supply curve is, at the moment, dominating the price trend. OPECs decision to not cut supplies changed the equation – economists assumed the supply curve is elastic since OPEC can (presumably) raise or cut supply at a moments notice, thus assuring large price changes aren’t possible on the supply side. Turns out that supply is inelastic (large price change had little effect on supply).
Basically, at any given moment you just need to figure out if the market is being driven by the supply curve or the demand curve, and from there discover if the driver is inelastic or elastic. You can predict the magnitude of price changes with these two pieces of info.
http://www.ritholtz.com/blog/2014/12/awesome-oilenergy-infographic/
” Markets had been driven by the demand curve over the last decade, but the inelastic supply curve is, at the moment, dominating the price trend. OPECs decision to not cut supplies changed the equation – economists assumed the supply curve is elastic since OPEC can (presumably) raise or cut supply at a moments notice, thus assuring large price changes aren’t possible on the supply side. Turns out that supply is inelastic (large price change had little effect on supply). ”
I agree that it is not pure market supply/demand per se since there was a conscious decision not to cut supply. So can you speculate why supply side said “No more”? I guess I am asking for icing on torte and that is hard to get 🙂
Turns out that supply is inelastic (large price change had little effect on supply).
Are you joking? The large drop in prices is having a dramatic effect on supply. Of course there is a lag time. When the price drops drillers just don’t stop drilling on projects already underway. That capex has mostly already been spent so these projects will be completed.
But projects are already being cancelled, rig counts are already dropping. And they are projected to drop a lot further.
Just wait until the second quarter of 2015 and see what kind of effects the price drop is having on supply.
Hey, supply, demand affects price. But price also affects both demand and supply. High prices drive demand down and supply up, low prices drive supply down and demand up. But the economy is a major player in this game. If the economy is in the doldrums then low prices will have a much less effect on demand. In fact it was very likely the state of the economy that started the drop in prices, even more so than higher supply.
During the great depression everything was dirt cheap but the people simply had very little money, so demand stayed low also.
Hi Ron,
To make things clearer you need to distinguish between shifts of the demand or supply curve and movements along a demand or supply curve. Some are arguing that at $100/b and everyone producing “flat out”, that the supply curve was relatively steep (inelastic). Under those conditions, slower economic growth worldwide led to a shift of the oil demand curve to the left, in order for supply and demand to balance oil prices had to fall as prices fall, the quantity of oil supplied will fall and the quantity of oil demanded will rise (both are movements along the supply and demand curve) until they are equal at the market clearing oil price.
It seems we’re in agreement, but simply discussing short-term versus medium-term.
I commented above saying that late spring/early summer 2015 will be very interesting since not much can be gleaned by the slow winter months as well as the lag effect. These prices combined with a depletion of sweet spots could make the summer of 2015 quite interesting.
In either case traditional elasticity curves don’t fit shale production. Due to how quickly wells can be completed and fast depletion, shale supply has more of a “graduated equilibrium” stairs type graph. Outside a narrow range of prices future production plummets. We may very well get to see this occur in the near future.
The longer the lag time for a project the more the average price over long periods of time matters, as opposed to the current price. That’s a large part of what makes shale oil so precarious. The lag time compared to, say, a deep water or oil sand project is quite short, and is much more easily impacted by temporary price changes that take it outside of its price window.
Hi Brian,
Your analysis may be correct, but oil prices are determined by the World oil market, so I was talking about the World oil supply curve, of which LTO is only a small part, as well as World oil demand.
The Bakken Supply curve in the short term is steep, output will not be affected by changes in price for 3 to 6 months.
Mr. Patterson. Really like this site. Thank you for all of the effort you put into it.
I question how much US and Canadian oil exploration is viable at sub $60 WTI. I suspect almost none, and what is occurring now is due strictly to lag time, or major projects that take years of planning. I note there has been almost no growth recently outside of those two countries at much higher prices. Do you think a shortage is in the cards in the next couple years or so?
Noticed every gas station was busy today. Good weather and Christmas shopping going on. Asked cashier where I always buy gas how busy they were. He said thinks they will sell more gas this weekend than they ever have this time of year. Only cost me $48 to fill up. Early summer was $80+. Don’t know about how much demand will increase but doubt it will fall at $2 gas, which will be here soon.
I think it is accurate to say the oil supply is more or less set in concrete over a period of weeks to a few months-barring war or cartel action.. Supply will not start dropping noticeably for a few more months yet in response to a the current price crash unless OPEC or Russia decides to cut production.
We will know how long the time frame is for oil supply to respond to falling prices due to REAL market forces pretty soon -my guess is within a year at the most. By REAL market forces I mean ” other than by cartel manipulation of supply”.
While the price decline looks likely to have an effect on LTO, it isn’t really clear that conventional won’t pick up the slack, at least for a while.
Without commenting on the long term supply (which may fall off a cliff one fine day) in the short term that might not happen, at least for high margin producers.
Profits are very high for the cheapest conventional producers. I think some may be incline to increase production as a reaction to falling prices in order to make up for lost revenues. Standard market theory says supply decreases when the price falls, but the vast “rent taking” in the oil markets may change the calculations of the producers.
For example the Saudis need $85 oil to balance their budget.
http://www.platts.com/latest-news/oil/dubai/saudi-arabia-needs-85b-brent-to-balance-budget-21992779
They now have three options: Cut spending, increase exports or go into debt.
Ironically the falling oil price is an automatic spending cut for the Saudis, since a lot of their spending is oil subsidies. but I doubt that will be enough.
Maybe they’ll just go into deficit spending. They have a lot of cash, and interest rates are low.
But maybe they think their best bet is to simply increase production, assuming they can.
Hi Illambiquated,
The fact that Saudi Arabia was not producing more oil at higher prices suggests that they may have been at their limit, I doubt their C+C output will ever rise as high as 10 Mb/d in the future. Iraq may increase output in the future, but I think this is several years away due to political turmoil for Iraq to reach 4 Mb/d.
Offshore oil production is likely to decrease in this price environment, so I doubt conventional oil will be able to fill the gap left by LTO declines which will occur at oil prices under $75/b.
I do think the reduced output will lead to higher oil prices and that a higher quantity of oil will be demanded at lower oil prices, which will also tend move oil prices higher (as the market moves along the demand curve.) In addition lower oil prices will lead to greater spending on other goods as the cost to fill up the gas tank goes down.
This in turn spurs greater economic growth and a shift of the oil demand curve to the right as income increases, this also will drive up oil prices. The whole process will take 3 to 9 months before we see oil prices start to move higher.
Involuntary changes in behavior that lowered oil consumption.
The fundamental premise that is wrong is that U.S. oil consumption is lower due to voluntary changes. We chose to use less! Yay!
Oh, I agree that many people in the US are downsizing out of necessity. But whether they live in a smaller house by choice or economics, the result is the same. If they drive less because of choice or economics, the result is the same.
The big debate, I think, is whether people would consume more energy if they could afford to. But if the economy doesn’t raise more incomes, they don’t get that choice anyway.
For most of the US population, incomes are not rising. And many younger people are saddled with college debt that they will be paying off for years.
re: ” and as soon as incomes rise, people will go back to their old spending ways. But what on the horizon is going to make incomes rise?”
Excellent comment and point. It seems like there is a lot of money around because people have a lot of fluff stuff like electronics, nice furniture, etc. The sweatshop-made toys are cheap. But look at the faces of people at the grocery store till. They look sick. A $200 lightly filled cart is the norm. I saw one guy with two huge carts (blended family with 7 kids) and his bill was $1200 freaking dollars. I just wondered where he worked?
Locally, pubs are few and far between with very skimpy hours. When I was in my early twenties we would go to a beer parlour and drink all night on $5.00 and I made $7.00/hr as an apprentice. Cost wasn’t even a consideration. Nowadays, there aren’t even any beer parlours, they have trendy little pubs trying to catch those with a few bucks. And pub numbers are declining and going broke because except for an after-work blitz, they have few patrons to justify staying open. When I was still working (two years ago) I would stop in at a local watering hole for a few pints with my buddies. Two pints and a few wings and tip set me back $25. I thought, “hmmmm, $25/wk….$100/month….$1200/yr, I’ll just buy a case and go home. Screw the hockey pool”. It’s like that all over in BC.
I think the decline has set in and you can price equity and assets re: debt all you want, but if you don’t have the cash in hand you have nothing. “it’s not what you own, it’s what you have paid for”.
regards, Paulo
Saudi Arabian Oil Minister Ali Al-Naimi assures us that “the market will correct itself”. That is hardly reassuring. If I’m not mistaken, the whole intent of three rounds of QE, bank bailouts preceding that and a host of financial tricks since 2008 were specifically intended to prevent the market from correcting itself. The market correcting itself is exactly what central banks and governments have been trying desperately to prevent, but exactly what they never stood a chance of preventing for any more than a temporary period of time. There are real physical and incontrovertible forces that are and have been pushing for a market correction. The longer those forces are pushed forward by desperate temporary measures, the harder those forces fight to snap back to a corrected state. It was only a matter of time. Watching all this unfold and having a decent understanding of what is at stake and where this is going and what the consequences are leaves me feeling a little nervous, and it seems that it has only just begun. The unwind is inevitable. Mother Nature always wins in the end. This certainly looks and feels like that moment has finally arrived.
There is the little bugaboo that there is an issue of slope vs level, flow vs supply.
Meaning, if the magical supply and demand parameters were out of balance, that doesn’t define a price. It would define a price increase or decrease, and said increases or decreases would continue to increase or decrease. The level is not defined by imbalance. The rate of change is.
It’s like pushing the stick to the right in an airplane. The ailerons deflect and as long as they are deflected the aircraft rolls. It doesn’t roll to say 30 degrees and stop. It keeps rolling. That’s what imbalance does.
So . . . this theory of imbalance is a tad more complicated. If you want the aircraft to stop rolling, you neutralize the stick. It won’t return to straight and level unless you imbalance the ailerons in the other direction and then re-neutralize at straight and level.
So, hell, this says we can tune the price to whatever we want.
Many expected the OPEC to continue controlling (high) oil prices by adjusting their production taking the growth of US oil production into account. This time they decided to let other players adjust their production. As you said Watcher, by deciding to do nothing (really they lowered sligthly oil production), they appear to be the root cause of oil fall. If one look to the recent evolution of oil production, only shale oil is the cause of oil crash!
Actually I don’t think supply / demand did it. I am in the dollar appreciation cause camp. Too much coincidence that it did its spike in the same months.
The dollar isn’t THAT strong, though. Unless you’re comparing it to the Rouble – but there you’re not looking at a strong dollar, but a Rouble that is weak compared to just about every other currency…
@Watcher
Do you know how much $ appreciated since June?
Is this correlated with start of the chatter of End of QE around the same time?
The dollar / oil thing doesn’t have to be linear. That’s a copout. It’s also true.
There was a proposal that Yellen in June giving October as the end of QE date started the dollar’s rise, but that simply can’t hold water because QE taper started in January and the rate of taper held essentially constant Jan to June, and projecting it forward would have reached zero right around October. So she said nothing not already known.
The aileron example above just addresses the reality of 1st derivatives resulting from imbalance. As has been mentioned, if Shale really is a huge part of US GDP, we’re looking at death spiral in that Shale’s destruction would smack GDP, which lowers demand and maintains the aileron deflation causing continued price lowering. It’s a very dangerous scenario.
And thus, in the New Normal of zero weight for moral hazard government or the Fed will
Simply
Not
Allow
It
aileron deflection
Would you characterize QE as subsidies for lower and lower EROEI with some serious side effects (market imbalances like we are seeing in shale oil boondoggle) ?
Nah, that’s too esoteric.
QE initially was to avoid Apocalypse. There was no thought of EROEI involved.
The September 2012 QE3 is the most curious one because subsequent economic data did not show any cliff dive, yet Bernanke embarked on a monumentally huge injection of liquidity . . . just weeks before a presidential election — hugely risking Fed independence. He risked destroying the Fed. A GOP win may have dissolved it if that maneuver by him had not secured an Obama victory — assuming it did.
And so . . . why QE3? We don’t know, but odds seem very high there was no discussion of EROEI in the FOMC.
I agree. I think there was a bit of oversupply because demand was a little weaker than expected, but what really started things rolling was the strong dollar, which raised the price of dollar denominated oil outside the US. People weren’t willing to pay that, so the prices fell, decreasing america’s import bill, and further strengthening the dollar, creating a positive feedback loop.
That is one possible explanation anyway.
I also continue to believe that the oil rent is huge — that the price is still higher than the cost for most oil (not for new fracked wells, but elsewhere). I think world markets can bear prices much higher than the cost of producing most oil , which the gradual increases in demand at $100+ demonstrated. On average oil costs a lot less to produce than $100, and the difference is pure rent taking, but the demand side didn’t really react negatively.
As a result there is a certain amount of randomness in the prices, and it is set by the futures market aka speculators. That is why I think the vagaries of the forex markets were able to trigger such a dramatic change in price.
As suggested above, the Fed can essentially drill for oil if it chooses too.
It is astonishing to me that in the same breath that people note that a government bailout for shale could happen, they then continue their thoughts presuming that low oil price can destroy Russia.
Russia has a central bank, too.
I agree with your jist, but want to point out that many people misconceive the goal of QE and all the other financial maneuvering (“tricks”) of central banks and governments.
The goal is/was to prevent a chaotic fail, one where store shelves are empty, the economy goes black market, and the standard unemployment rates get above 20%. The gains in the equity market and real estate are a welcome sideshow or secondary goal compared to the prevention of severe unrest.
I agree that these measures are just an attempt at orderly retreat, from the excesses of population overshoot and resource gluttony I would add.
Chapter 2 comes next.
I semi sign onto that. The Fed was forced into things, but in a profoundly imperfect way because future historians (there won’t be any in a destroyed civilization, but just imagining that there could be any) will look back at 2008 and declare that Bernanke blundered in a society destroying way when he did not save Lehman.
If Lehman had been bailed out, the Apocalypse would not have happened. There would have been no TARP. There would possibly have been no Obama. There would have been no GM bailout. There would have been no BoA or GS or GE bailout. AIG . . . maybe they would have followed Lehman, but Lehman was the central focal point for the swap disintegration. Saving Lehman would have changed everything, and if we imagine that the Fed prevented people dying in the street (which they did), they could have kept people out of the street entirely.
Correct, there doesn’t have to be a linear relationship. Small changes are enough to trigger sudden moves in the market if the fundamentals aren’t very tight.
Paulson
He and Bernanke certainly sold the salvation.
I tend to believe the statistics. Oil demand growth slowed down, supply kept going up at a fast pace. We see an increase in non crude oil supplies. That is, conventional oil (black gold, hydrocarbon found in the liquid phase in the reservoir which has more than three-four carbon atoms) has probably peaked. This is hard to tell because condensate is tracked jointly with black gold (“crude and condensate”), and condensate tends to be blurred with NGLs (butane, propane and ethane).
The natural response to dropping prices is a cut back in activity. And this extends beyond USA shale well drilling activity. This will impact every producer. Therefore I would expect prices to rebound gradually, and keep increasing until we REALLY hit the wall. At that time we will either have something to replace it or we will have increasing wars. And at that point it won’t be the fake “Iraq was invaded for its oil” issue. It’s going to be for real.
“I tend to believe the statistics. Oil demand growth slowed down, supply kept going up at a fast pace. We see an increase in non crude oil supplies. ”
No evidence of this.
Supply rose? Not sure that shows globally. Demand fell? Doesn’t show at all. Jeff and I pounded out the car totals last thread. There is no sign of diminished car totals and they are what burn oil.
Hi Watcher,
Oil is burned in jets, trucks, farm tractors, ships, and used for heating in some places.
Cars do not burn all the oil. Even if it were true that cars burned all the crude plus condensate, you need both the number of cars and the miles that those cars travel. The VMT is not known world wide, you could assume that the VMT per car always remains the same, but I think this is a very questionable assumption.
Car sales numbers by themselves tell you very little about oil demand.
Well, the sum of all those things tell you nothing about demand.
They do tell you something about consumption.
Watcher,
Consumption is demand.
Really?
So if there’s none to be had of something, and you demand to have it, how exactly do you consume it?
Conversely, a hospital patient decides to go on a hunger strike and forbids doctors to feed him intravenously. He has zero demand for sustenance, yet the doctor who is required to treat him prescribes IV feeding and presto, the zero demand dood consumes.
I tend to believe the data. Over the last few years supply did rise, and demand increases did slow down this year. A lot of what shows up in the market isn’t “real oil” but it’s good enough.
I am still trying to get a GOOD handle on the actual effect on REAL INCOME of foreign oil exporters that has resulted from the dollar going up and other currencies going down.
Common sense tells me that if oil goes down ten percent because the dollar is up ten percent then the foreign exporter loses very little if anything- since the only possible use of a dollar in the nitty gritty end is to SPEND IT.
Maybe revenues are down in dollars but so should be the dollar prices of things the exporter wants to buy with dollars that are priced in let us say EUROs or Japanese yen which are down against the dollar.
So some number cruncher please fill me in and thanks in advance.Is the rise of the dollar really hurting exporters that much?
Most Middle Eastern currencies are pegged to the USD, so no currency movement. Renminbi is also nearly pegged to USD, i.e. negligible currency movement compared to oil price swings. Euro is down about 10 % during the course of this year.
And the yen? And the pound during the Scottish episode?
Hi Watcher,
So in those countries (Japan and UK) oil prices would not have fallen as much as in the US. Some of the fall in oil price (in US dollars) was due to the strong dollar, but only about half of the change in oil prices can be explained in that way. The rest is explained by slower oil demand growth. In fact the recent IEA statistics show a fall in total liquids output which suggests lower demand.
Wait a minute, so production now measures consumption? Why measure consumption, then? Or production. You can measure the other and have your result.
And as was pointed out, dollar vs other currency in defining oil price need not be linear.
There is no evidence of a supply/demand change vs March, or April or January or May. A switch was flipped in June, and it corresponds on the calendar precisely with the dollar’s move and lots of coincidences are ignored, every day. Don’t think ignoring this one is special.
and btw, consumption and demand are english words that in the language don’t mean the same thing, particularly.
In this case oil consumed is the same as demand.
Demand grew more slowly than supply and more slowly than expected. Production and consumption tend to be pretty close within the limits of storage.
Storage has limits. Thus production tries to match demand and demand tends to go up when there’s a lot of surplus capacity. The price serves as a feedback mechanism. But inertia and human nature tend to gum up the works.
What about them? A quick look at Oanda reveals that from Jan 2014 to today, the Pound is down less than 5 %, and the Yen about 10 % (with the Yen pretty much stable until about a month ago). No big deal as far as fx movements go.
(Comment refers to Watcher’s post further up, not to the discussion in between)
North Dakota oil production hits a lull
Lynn Helms, director of the North Dakota Mineral Resources Department, said oil prices in North Dakota are down 44 percent since September, far more than ever expected.
“I honestly did not see them this soft,” Helms said in a conference call with reporters. “That is going to have a significant impact.”
Helms, whose agency regulates the oil industry, said he expects the 183 current drilling rigs to be down by 40 to 50 rigs by mid-2015. “That means it will be a month-to-month struggle to see production increases — if they come at all,” Helms said.
Oasis Petroleum, one of the large operators in North Dakota, announced Wednesday that it would drop from 16 drilling rigs to six rigs. On Friday, stock prices for the 10 largest publicly traded oil companies with North Dakota operations were down by an average of 51 percent over three months.
In North Dakota, production from the Bakken and Three Forks shale plays has risen nearly sixfold in the past five years, and the state in October had a record 11,892 oil wells. Production has declined just seven times in five years, usually in the winter when it can be tough to complete wells.
“This is a blip in the long-term scheme of things,” Helms said.
And this is interesting:
New North Dakota regulations to reduce flaring, or wasteful burning, of natural gas at wellheads contributed to the decline in output, Helms said. After drilling wells, operators increasingly are deciding not to immediately complete them.
That step, called hydraulic fracturing, pumps water, chemicals and sand into the shale layer to release the oil. The number of wells in this uncompleted stage rose by 40, to 650 in October as many awaited construction of gas pipelines so they can avoid flaring, Helms said.
So even though the rig count is dropping, and will drop further, completions may pick up when the gas pipeline is completed.
Two things:
1) Political speak in there . . . blip on the long term scheme of things . . . this is optimism. Not evaluation. Who says oil’s price has to rise over the next 5 years? It was north of $100 for several years. Who says what the proper level is? If shale dies, as it likely will over the next few MONTHS (not years) to under 100K bpd, GDP gets smashed too. That doesn’t boost demand (and therefore price). That LOWERS demand, and therefore price. Death spiral is very credible.
2) So holes get drilled and the bulk money paying for sand doesn’t get spent. This says either a full train load of sand is piled at the wellsite, or it’s not being ordered — which would imply a just-in-time inventory perspective for proppant and also says there isn’t going to be much momentum because they apparently don’t have sand ordered when drilling starts. They can stop wells coming online in a very abrupt way.
ooops not implying output is going to 100K bpd over the next few months, implying drilling could go to nearly zero very fast over the next few months, taking output down to less than 100K as the sum of soon-to-be stripper wells.
Ron,
Helms, predicts a drop of 40 to 50 rigs by the mid year. Oasis has/will drop 10 of those. That is 60% of its fleet. Another small company announced they were going back to one rig from 2 1/2, once again a 60% drop. It will be interesting to see how other companies cut back, but by the looks of things, a 50% cutback across the board, will be a lot closer than a 50 rig cutback. Plus, throw in a few bankruptcies, and who knows where we will be.
I do not think we will have to wait long to find out, the quarterly reports are going to make for some sad reading.
There are always a lot of lawyers looking for settlements out of court. When the quarterlies come out, the shareholder lawsuits will begin.
Monumentally difficult to restart shale at a higher price. It will have to be hugely higher.
The Fed could buy the oil yet to be extracted. If it is a total of 10 billion barrels, three of them are sold at this time, seven billion could be bought by the Fed for future extraction and use.
All the Fed has to do is loan the money to the producers that work the Bakken and buy seven billion barrels of future Bakken oil right now.
If the cost is 100 dollars per barrel adjusting for inflation and future price increases, the Fed could print another trillion dollars, include the interest charged, for Bakken producers, a bailout, and own the oil from the get go, sell into the market when prices are high, i.e. when the rest of the world comes looking for more oil and it is there in the Bakken, stored in place. Nationalize the oil via Fed action, bailout producers in one fell swoop, catch the falling knife.
Stored in place Bakken oil can be bought and sold now. It is being done now, so might as well have the Fed do the buying.
December 2020 futures has crude at just under 70.
http://www.cmegroup.com/trading/energy/crude-oil/light-sweet-crude.html
I have spent many an hour trying to decide if I ought to sell something and put the money into oil options to buy. The only trouble is that there is a real chance I won’t make it six more years and a real chance that the option would not be honored even if I did live long enough.
The only possible way I can see oil being at seventy in six years is that the world economy will be in the nursing home.
No government in the world is going to tolerate a massive monetary deflation if it can possibly be prevented because doing so is totally contrary to human nature and the nature of politicians. The printing presses are kept running NOW at a rate that keeps most prices steady to up a little oil being the only real exception.
More pressure will be applied to the printing press gas pedal as needed and zeros are dirt cheap and every one you add is worth ten times as much as the last one.
Runaway printing will not actually CURE any economic problem but it DOES postpone having to deal with some problems for some period of time. You can always take another drink and accomplish two things by doing so – forget your problems for a little while longer and put off the hangover a little while longer.
A good snort is a good painkiller and has enabled many an old farmer to get back out in the field and stay there when he otherwise would be in a chair or bed going broke.
The presses will roll. Oil is just not going to be selling for seventy bucks in 2020 in nominal terms and in terms of todays money it is going to be up substantially barring a miracle on the production front.
There is no way I can know what the true total marginal cost of the last few million barrels being sold these days may be but nobody seems to think deepwater oil for instance can be sold profitably for less than at least eighty bucks.
Where is the oil going to be coming from at seventy bucks?
Depletion and inflation never sleep.
Now it does occur to me that there is no theoretical reason there could not be a revolution in the conservation and in the efficiency of oil use.
There is no good reason to believe it will happen but if we were to go on a wartime footing and really put the maximum possible effort into building electric cars then I suppose we could be building them by the millions easily enough in six years time.
And the cost of doing it might be mostly or entirely offset thru the reduction in demand for oil and a consequently lower price for the stinky stuff.
This would infuriate the people in the business but they are after all only a small fraction of the population and thus easily disregarded at election time – so long as there are no gas lines.
Raising corn for moonshine to burn in cars is a disastrous policy in terms of ecological damages and food prices and scrapped small engines but maybe we ought to double the moonshine output to help lower oil demand. Doing so might save us – as a society- a lot more than it costs us- as a society- in the short run at least.
In the long run we are going to pay a heavy price for burning moonshine.
re: No government in the world is going to tolerate a massive monetary deflation if it can possibly be prevented because doing so is totally contrary to human nature and the nature of politicians.
Already done, Mac, and we are all paying for the tee shirt. The quiver is empty. If they do more bailouts even the most obtuse will catch on the jig is up and begin to economize and prep.
Not true Paulo. Japan is in the the early stages of the biggest currency experiment the world has seen (relative to GDP). They are going to inject as many trillions of new yen into the mix as it takes to keep their boat floating above the bigtime deflation level.
This yen devaluation is the only mechanism left to them to keep from going bankrupt as their debt payments outgrow their budget capacity to pay.
Devaluation of your currency is a form of debt default, and is generally a last resort prior to bankruptcy. The EU badly needs to use the same tactic, excepting Germany who know holds the biggest cards and is holding firm, to the great ire of all the other EU citizens.
Its all manisfestations of population overshoot.
@Hickory
At what point does one accept that the experiment worked and/or didn’t work? The Japan election is tomorrow. The country is in total decline. When will dealing with the emergency take on a new form?
I am simply asking because I cannot believe how Govts. are trying to keep things going as they are.
Life will go on when overshoot and living beyond ones means is seen for what it is.
On Thursday we went to some friends for supper. We had venison, garden veggies, homemade wine, wild mushrooms, etc. There were 7 of us. The dinner was wonderful. I commented that eating dinner with friends and family, (and having a few drinks), is one of life’s greatest pleasures and a real measure of wealth. They live in a beat up trailer as they are still in process of building a house as they have funds and time to get it done. My friend’s wife is from East Germany. She got out after the Wall fell. She was poor in East Germany and has worked very hard with many struggles here in Canada. She commented that with her 2 year supply of wood for heat and a years worth of gathered/harvested food she was as rich and satisfied as one could be.
We all agreed and then had another shot of Jack Daniels.
Our countries should do the same and quit living unrealistically and beyond their means. My country of Canada, too. We have lost our way in this world of consumerism. I hope decline gets us on track and in touch with enduring values.
regards
Hi Paulo,
I surely hope for a gradual transition towards a smaller population, so that many people can find a graceful and comfortable way of life (with dinner, a garden, and friends as you described). I’m in no mood for genocide, mass starvation, warlords and all the rest that comes with a rapid and rocky downsizing.
Best to you.
Paulo ,
I am with you in terms of what is important and meaningful in life.
But slice it or dice it any way you want our species is in over shoot and the only cure for overshoot is die back.
Now as far as inflation and deflation are concerned- they are no more than the two monetary faces of collapse. Collapse or dieback – severe dieback – is pretty well baked into the cake already.
As far as inflation goes I remind people that I used to walk to the nearest country store and buy coke for a nickel. cokes are at least a dollar now. This twenty times inflation in the price of the same good has been brought about partly by accident and partly as deliberate policy.
The printing presses have in effect so far only been used just enough to make sure they are in good working order- the way a mechanic test drives a car after repairing it.
You can still get two ordinary loaves of bread for five bucks in this country. Once the shit is in the fan it may well take a bread bag full of bills to buy a loaf of bread. This sort of inflation is well documented historically.
Inflation is not going to fix our problems but it will delay the day of reckoning to some extent which is why it is always the preferred policy of both people and governments.
The thing to remember is that by halving the value of money a government in effect halves it’s debts as well.
Remember the housing bubble less than a decade ago- the fed provided enough printed money to keep housing prices from deflating in a disastrous way. Just enough.
So long as printing money helps maintain business as usual the govt will print it- in any quantity necessary.
Remember the nickel coke. NEVER FORGET the NICKEL COKE when somebody tells you the money cannot be inflated to any extent the govt chooses to do so.
When I was a young guy farm wages were a buck o h five here. Today I pay eight bucks for help that works half as hard as I did for that buck and a nickel.Plus the welfare dept pays for farm hands medical and dental care and kids school lunches and rental assistance etc etc.
Remember the penny post card (stamp included)
Now we have email that’s free, so paying a penny seems expensive. Heck my daughter sends hundreds of messages a day with WhatsApp.
When my daughter was 12, her friend’s cousin got married to a Vietnamese woman. The friend’s family went to Vietnam for the wedding and a vacation. My daughter skyped with her friend the whole time on my iPad. Clothes are cheap in Vietnam, so the friend bought some really cute shoes for my daughter they found together in a store in Saigon (Ho Chi Minh City).
I was reading a biography of Queen Victoria recently. Luckily for biographers, she and her family wrote huge numbers of letters to each other, most of which survive. Victoria commonly wrote several letters a day to each of her children, mostly short notes, sometimes very emotional. Great material for a biographer.
That volume of correspondence cost a fortune, but Victoria was an Empress, and could afford it. Now there are billions who can. I’d call that deflation.
Rapid downsizing is already happening. You can fit all this stuff in your pocket today, and most of it is almost free.
(Ripped off buzzfeed)
And here’s the point I was trying to make, sorry.
I dunno, I’m in the computer business, and we’ve been living with massive price falls for decades.
http://ns1758.ca/winch/cost-hard-drives-komorowski.jpg
Can’t remember anyone ever stepping in.
Anyway oil isnt exactly cheap even at $50 by historical comparison. Wasn’t it around $20 back in the mid 90s?
OF COURSE certain technologies have gotten cheaper by leaps and bounds over the last few decades.
But the price of just about any service or good that exists in the same basic form as it did fifty years ago is up sharply.Pair of pants roll of toilet paper loaf of bread bag of oranges. House. car. visit to doctor. Lawyer. tuition.
The fact than some things are getting cheaper is no proof whatsoever that inflation does not exist on a massive scale.IT OBVIOUSLY DOES.. and it is obviously related to the supply of money in relation to the supply of goods and services.
There is a simple relationship involved. The more money there is in relation to the supply of goods and services the less valuable the money becomes. Prices go up. Simple as that. Governments deliberately create money ( or establish policies that allow banks to create money which is functionally the same thing) FASTER than the supply of goods and services grows.
Since money is only a concept or a marker or a piece of engraved paper or electrons arranged in some particular order in computer memory these days increasing the supply of it is so ridiculously easy that it is a more or less irresistible temptation. It enables governments to spend money they don’t have to collect in the form of taxes. There is no free lunch however. The collection is merely shifted to each and every person and entity that possesses money which loses purchasing power.
My grand parents ( Daddy’ side ) struggled to put away nickels and dimes and saved what should have been a substantial cash nest egg for their old age. It lost about three quarters of its value ( my best guess) because that value was stolen from them by inflation by the time they had to spend it.
Of course they got it back in spades in the form of old age welfare – social security and medicare – their bennies vastly exceeded what they paid in.
I being a grand child am now saddled with the debt the govt accumulated on their behalf.
The farm with a house and barns and some fencing and producing fruit trees that they bought for a thousand bucks in 1919 iirc is now worth about 200 k holding back the acre around the house. The old barns and trees are gone. The only real improvement has been new fences which are already due for replacement.
I remember the Prez going on tv and solemnly promising the people that bread would never cost a dollar a loaf in America.
Inflation would be much worse if it weren’t for new technologies driving down the cost of producing many goods and services. Oil for instance would be MUCH more expensive than it is if it weren’t for more efficient cars and more efficient drill rigs and more efficient means of finding it. But even with better seismic, better drilling rigs and more efficient automobiles it is still up three times over the last decade or so. And that is after the recent price collapse. Some of that price increase is due to inflation but most of it has been due to the real increasing cost of producing the marginal barrel of oil.
If it were not for money inflation the computer that used to cost ten grand that now cost a couple of hundred would be selling for perhaps one hundred or maybe even less.
If it were not for deliberate inflationary policies the cost of living overall would fall , everything else equal, as businesses grow more efficient and improving technologies allow goods and services to be provided at less cost.
The effects of printing money NEED NOT NECESSARILY BE FELT AND SEEN IN THE FORM OF RISING PRICES..
The inflationary effect of printing money – depending on the AMOUNT printed can be seen and felt as LESS DEFLATION.
The object of a well managed central bank in printing money is to maintain stable to slowly increasing average price levels across the board for all goods and services.
While I am no friend of banksters it is obvious even to me that the Fed has been reasonably successful in this tricky endeavor for the last few years.
This does not mean however that the Fed is an all knowing economic doctor than can cure the cumulative effects of old age – and old age is what our society is afflicted with. I am not talking about old INDIVIDUALS but rather SOCIETAL old age in the sense that our entire way of living based on using up non renewable natural resources is suffering from old age .Our very way of life must die when the irreplaceable resources supporting it are finally used up.
But the Fed IS able to do some things to keep our society functioning and to reduce the aches and pains of it’s decline just as my doctor can HELP me with my own personal medical issues. He can use his bag of tricks to slow my aging process down and make it easier on me but he cannot stop my getting older and one day closer to death each and every day.
In the end if I am in extreme distress he will prescribe some very very powerful pain killers and sedatives for me- things that are in and of themselves very dangerous and quite capable of killing me in and of themselves. In the end starving peasants have always eaten the seed corn. Living till spring with nothing to plant is preferable to starving mid winter.
Burning the furniture is preferable to freezing to death a few days sooner.
In the end when there is nothing else left to do, when there are no other or few other options, and tax collections and borrowing have hit their ultimate limits, the government will still have to pay its bills- the choice is going to be to either print the money or quit issuing the checks.
THE GOVERNMENT IS NOT GOING TO JUST SHUT DOWN AND QUIT PAYING.
It will just print the money as one of the last steps it takes just before everything goes entirely to hell in a hand basket. Depending on how much can be borrowed and collected in taxes compared to how much is spent inflation might be as low as a couple of percent annually to as high as a hundred percent a week.
Failure to print when tshtf would mean arriving in hell a few weeks or months sooner. Maybe years and years sooner.Printing has probably kept us out of deflatianary hell for a long time since.
Printing has kept us out of hell a good while now and if we are lucky and the fed is either lucky or skillful and the cards fall right printing may keep us out of hell for another decade or two yet.
But in the end collapse means taxes cannot be collected and money cannot be borrowed and it follows that MONEY WILL BE PRINTED in ever larger quantities and there WILL BE runaway inflation- unless we are so extremely lucky as to avoid a general economic collapse.
My personal guess for what it is worth is that collapse for the world as a whole is absolutely baked in but that for a few countries such as the US , Canada, etc we just might skinny thru the next century more or less whole – at least in comparison to a place such as Somalia today.
This is because power and resources are not equally distributed and because we have a hogzilla’s share of both in addition to being favorably situated geographically and big enough and diverse enough to maintain an industrial civilization insider the confines of this continent while essentially taking what we want from some people in some places and telling everybody else to get lost.
If somebody has money in airlines they are eventually going to lose it or most of it because peak oil is an inescapable reality – oil will eventually be too expensive to support air travel on today’s massive scale.That will be part of the collapse some people define as deflationary, ”that ” meaning the bankruptcy of the air travel industry.In the meantime oil will be going up in both constant and nominal money barring a miracle replacement or substitute.
Rational people don’t put much faith in technomiracles of any given sort coming to pass within any given time frame – we are all of us glad when they do but rational people have better sense than to DEPEND on them coming to pass like buses or trains running on a fixed schedule.
There is some food for thought here when it comes to long term personal planning.
We can get by without air travel but we can’t get by without farms.We can try to save cash but doing so may well be a disaster comparing to investing it in the right sort of hard concrete good. Some concrete goods will eventually be damned near worthless except maybe as recyclable raw materials.
I was in the process of negotiating the purchase of a large workout but still serviceable ( for a few days at least ) bulldozer from an acquaintance a few years back for three thousand bucks and had I not postponed the deal hoping to get it a couple of hundred cheaper-it would have been mine.
Except for the fact that a scrap metal dealer heard about it and offered him four thousand on the spot. He took it of course.
friend of mine is pointing to deflation tells me “look you can buy hamburger for $1.29!!”
Yeah right, the only problem is that hamburger is not food item anymore but pure poison 🙂
even rat poison in home depot cost more to manufacture then big mac.
if you pick anything healthy and necessary food item it is price inflated by leaps and bounds.
Well yes there is inflation, wouldn’t deny that. I was just saying that oil (like information technology) is not the entire economy by a long shot, and there is little reason to assume governments will intervene to keep the price up.
Mac,
Which resources are you concerned about running out of? I know that you know that we can replace oil. Heck, even airlines will be just fine with $10 per gallon synthetic fuel: they’ll reduce consumption per mile by 50%, and increase prices by 10%, and be just fine (jet fuel is only 1/3 of the cost of travel, so a tripling in the price of oil only double the price of a ticket, and that assumes no increase in efficiency).
I know that you know that we can replace oil.
I know that you think we can replace oil. With what?
airlines will be just fine with $10 per gallon synthetic fuel…
Oh, synthetic fuel. Made from air, or perhaps seawater?
Well, we started to discuss this before.
Oil for passenger travel is nicely replaced by various forms of EVs: hybrids, EREVs, and pure EVs. Roughly 10% of liquid fuel can be replaced with biofuels, which is more than enough to power EREVs.
And yes, synthetic fuel can be produced from seawater with todays technology (actually, yesterday’s tech – this is pretty basic chemistry). Of course, you’ll need an energy source: surplus wind and solar will do nicely. And, of course, it will be more expensive than $80 oil, but that’s ok – we don’t really need that much – perhaps 10-20% of what we use now.
While it is possible to manufacture hydrocarbon fuel out of air, I suspect a more practical solution would be to replace terrestrial air travel with high speed rail.
Rail is good. It works rather better for freight though, then for passengers (Europe chose to not develop rail freight, which left it with a very serious oil consumption problem).
Don’t get me wrong. I love rail, and I use it every day. But it doesn’t really work well for ad hoc point to point travel, or very long distance travel.
EVs handle that.
I forgot to address flying.
Real is great for inter-city travel, less than roughly 500 miles. but flying is really better for anything longer than that.
We’re going to have enough oil to handle aviation for a very long time. By that time, airplane efficiency can be greatly increased, and it won’t really matter if synthetic fuel is $10 a gallon.
Look at how well aviation handled the increase in oil prices from $20-$100. Everyone expected aviation to collapse, and it has instead grown a little.
Unfortunately, EVs (the car kind) can’t hit 400 km/hr (yet). High speed trains can:
http://www.travelchinaguide.com/china-trains/high-speed/
Making them a potential non-fossil fueled alternative to air travel. I guess technically, they’re still EVs.
If part of converting to a non-fossil fuel is traveling less, then having high speed transportation (rail or air) may not be an essential. If people work near jobs, if they don’t need to travel for business, and if they are doing less recreational traveling, the need to go long distances may be greatly reduced.
I have no idea what the future will be in terms of personal travel (as opposed to freight), but I think the world could survive well enough if most people didn’t go very far from home.
I like rail, so that would be fine with me.
Unfortunately very high-speed rail is very expensive – it’s not really an optimal solution. Every time speed doubles, passenger carrying capacity is divided by two. And the cost of infrastructure rises, as high speed requires great precision.
Aviation will. stick around.
Moonshine don’t matter.
Way back in 2005 I did an analysis of biofuel potential for the US that got published in Oil and Gas Journal as a letter. Below is the text. We are growing more corn today but the analysis doesn’t change much. As you will see, biofuel potential is just a drop in the bucket.
Oil and Gas Journal August 1, 2005 Letters Biofuel Potential
As the price of crude oil continues to rise, political leaders and public officials have called for increased reliance on biomass-based fuels, such as ethanol made from corn and biodiesel made from soybeans, as substitutes for petroleum-based fuels. What is the potential contribution of biomass-based fuels to relieving America’s dependence on petroleum (of which 60 percent is now imported from foreign sources)?
To answer this question I calculated the amount of ethanol and biodiesel that could be produced from the 2004 US corn and soybean crops and compared it to our nation’s annual consumption of petroleum. Crop totals are from the USDA, the biofuel potentials of corn and soybeans are from industry sources.
The 2004 US corn crop totaled about 11.7 billion bushels, the largest ever. One bushel of corn yields 2.66 gallons of ethanol, so hypothetically the 2004 crop could be converted into 31.122 billion gallons of ethanol. However, a portion of the energy in the ethanol represents energy invested in growing, harvesting, transporting, fermenting and distilling the corn. According to the corn ethanol industry, the energy yield is 1.67 btus for each btu consumed in production, or a net yield of about 40.1 percent of total ethanol produced. Multiplying the hypothetical 2004 production of corn ethanol by this factor leaves a net yield of 12.48 billion gallons. But ethanol has less energy content than petroleum. One gallon of crude oil contains about 138,100 btus, while a gallon of ethanol contains about 84,100 btus, or about 60.9 percent of petroleum. So on an energy-equivalent basis, 12.48 billion gallons of ethanol would equal about 7.6 billion gallons of petroleum.
Using the same methodology one can calculate the potential contribution of soy-based biodiesel (soybeans constitute about 90% of the total US oilseed crop). The 2004 US soybean crop was 3.15 billion bushels, also an all-time record. One bushel of soybeans yields about 1.4 gallons of biodiesel. The energy yield of biodiesel is about 3.2 btus for each btu consumed in production, or a net of 68.75 percent, a much better rate than ethanol from corn. The energy content of a gallon of biodiesel is much higher, 128,000 btus, about 92.7 percent of petroleum. The 2004 US soybean crop converted to biodiesel would equal about 2.81 billion gallons of petroleum (3.15 billion bushels times 1.4 gallons of biodiesel per bushel is 4.41 billion gallons; adjusted for net yield, 4.41 billion gallons times 68.75 percent is 3.032 billion gallons; in terms of energy equivalency, 3.032 billion gallons of biodiesel would equal 2.81 billion gallons of petroleum).
The entire 2004 US corn and soybean crop, converted to biomass fuels, could replace about 10.41 billion gallons of petroleum (7.6 billion as ethanol and 2.81 billion as biodiesel). Petroleum is measured in 42-gallon barrels; the 10.41 billion gallon biofuel total would be equivalent to 248 million barrels of petroleum. The US consumed about 7.49 billion barrels of petroleum last year, or about 20.5 million barrels a day. This means that the total biofuel potential of the record 2004 US corn and soybean harvests would offset about 12 days of US petroleum consumption, or about 3.3 percent of our total yearly petroleum consumption. Given that most of the US corn and soybean crop is already committed to other uses, this analysis indicates that biomass-based fuels will have a negligible role in reducing US petroleum consumption, which in turn underscores that replacing petroleum in the US economy will be a monumental challenge.
I did a similar analysis looking specifically at aviation biofuel, since Boeing and the US Air Force have been exploring the option (trying to appease the greens?).
I don’t have access to the data currently, but the results were something like this-
One roundtrip Boeing 737 flight cross country would use enough corn ( I used the average yield in Illinois over the past 7 years) to give over 1000 people their caloric needs for one year!
To me, even one such flight would be an environmental and moral tragedy on a grand scale, even if it was heading to Disneyland. The only uses of liquid biofuel that I find reasonable would be for farm machinery and waste cooking oil.
I forgot to add my ” sarc on ” to the comment about making more moonshine to burn in cars. Those who know me as a long term commenter back to TOD days know that I am adamantly opposed to gasohol on several levels.
NEVERTHELESS ethanol made from corn does produce a substantial liquid fuel surplus that pushes down oil prices. A million barrels of moonshine is equivalent in the gas tank to roughly seven hundred thousand barrels of gasoline and that much gasoline means a savings of a substantial amount of oil – how much is hard to say but probably at least a third of that much or 250 k barrels . That adds up to a lot of oil even after deducting what the world wide farmer uses to grow the corn ( the overall energy budget is pathetic but we are discussing oil prices at the moment rather than coal and gas and water power etc) and has a substantial effect – when you add up all the various biofuels.
Good numbers on the price elasticity of oil are impossible to come by so far as I can see but my guess is that if ANYBODY were to cut out two or three million barrels of oil production per day then the price of oil would jump back to ninety bucks or higher more or less immediately.
A small shift in supply marketed results in a huge swing in the price of oil.
But just to make myself clear about farming to feed cars- I am dead sure that if we are once ever well started down that broad smooth highway we will find that it leads down hill like a ski jump straight to the gates of hell.
In case anybody here has never seen a ski jump on tv- once you start down there is NO STOPPING never mind turning around and going back.
Given my choice we would be doing research only on biofuels and keeping the pedal to the metal on conservation and efficiency.
Maybe in fifty or a hundred years we might be few enough and smart enough to use biofuels judiciously – say a couple of gallons of ethanol as a range extender or safety margin in a micro mini bev with a twenty hp ethanol burner under the hood just in case or to make the odd longer trip possible.
Most people don’t realize it but a diesel can be built to run on up to ninety five percent ethanol and will run on it just fine while delivering excellent fuel economy compared to a typical gasoline engine.
A million barrels a day isn’t going to destroy North America at least not in the short order.. But the thought of five or ten million barrels a day leaves me thinking agricultural moonscape. First order disaster. Soil gone . Water gone. Forests gone. Birds and animals gone.
But it may well be true that ten dollars spent subsidizing moon shine saves us a collective twenty bucks on cheaper oil.I don’t actually know but I have not seen an argument to disprove this possibility.
What I do know is that for me the price elasticity of oil is very high. I will pay five bucks or even six bucks for the first five gallons a week for our household use. If it drops to two bucks I will still not use hardly any more at all running our household. I just don”t need any more than that. BUT otoh I am not broke and will not cut my household consumption significantly unless the price goes WAY UP – like to seven or eight bucks a gallon. At that price I will start thinking about combining some trips and making fewer trips overall. But even if gas went to ten bucks I would still buy at least three or four gallons a week until I could buy a cheaper running car.
The world market for gasoline is very much like my own personal market. Up to a certain amount I will pay almost any price. Beyond that amount I might use a little more.
There can be absolutely no doubt that biofuels in total are depressing the price of oil substantially.How much I have no real idea but twenty dollars a barrel would not surprise me at all.
However, the picture changes if we grow sugar cane in a warm climate. I’m used to working outside the USA, and to be honest a buck is a buck.
If I could make ethanol and import it into the USA (without the protectionist tariffs which prevailed the last time I looked into it), I could bring in 1 Mmbpd at $100 per barrel.
That would basically match the entire production of Ethanol in the US. That would be quite an accomplishment.
You shouldn’t reduce the ethanol output by adjusting for the energy input. What matters is the liquid fuel return on liquid fuel invested, and that’s about 5:1.
Also, ethanol has a much higher compression ratio than gasoline – you can get up to 88% as many miles per gallon, not the conventional 60%. You do have to customize the engine.
Think of it this way: the US uses about 135B gallons of gasoline. If we replaced conventional 22MPG vehicles with extended range EVs like the Chevy Volt, which use about 10% as much fuel, we’d only need 14B gallons of ethanol.
That’s very doable.
That should be 15B gallons.
In not at all that long a run somebody is gonna pay a heavy price for that trillion the fed prints to buy the frackers. The printing sure as hell won’t.
And for all the other stuff we aren’t paying for as we shuffle the pile of chips around so carefully counting the ups and downs of this and that when
We know dam well that we HAVE TO LEAVE IT IN THE GROUND
We know we can do without a huge fraction of BAU and “the economy”.
we know as well as all of above that we can do the energy we actually need from wind and solar
————at a price we can very well afford, that being what had gone into the crapola we just quit.
Thanks, folks for the education you are giving me as I read all this here. Unfortunately, it simply piles on yet more evidence that I am living in a madhouse, and that makes me reach for the retch bucket.
Hi Wimbi,
If I let myself get to thinking about all this stuff in too deep a fashion I would have to either pull a Jesus act and give all my stuff away and go out and preach sanity to a world uninterested in hearing about it- or maybe blow out my brains so as to not think about it anymore.
I have made my peace with reality by coming to understand that in the cosmic scheme of things- if indeed the very concept of cosmic scheme means anything- that we are just little bugs doing our little bug thing on the stage of existence and that our part in the never ending story will soon be history just as the dinosaurs are now history- it is useful to think of a species as a whole as a single member of a huge population of life forms consisting of many species- individuals come , individuals go, species come , species go.
Mark Twain wrote about a bug that found itself a perch on top of the Eiffel Tower and being a bug with a mind like that of a man that bug just naturally assumed that the tower was put there for the sole purpose of serving as it’s perch.
Eat, drink, be merry, for tomorrow we die.
Drink a lot if it keeps you from thinking about it too much. Ya gonna die anyway and when you are gone after a few months you will exist only as a memory in the minds of a few friends and relative and in a blink of an eye they will all be dead too.
OTHER creatures have killed off major parts of the biosphere before; the first plants that exhaled oxygen were probably the biggest murderers of all time.
The world nevertheless shortly refilled itself to the brim with new life forms- and when we have been gone a few hundred million years the world will again be chock full of millions and millions of species happily preying on each other.
Having said all this it sure is a sad thing that we are bringing our extinction on ourselves well before our time.
Best Quote of the week,
when we have been gone a few hundred million years the world will again be chock full of millions and millions of species happily preying on each other
————————
Intermission : bankers, lawmakers, walmart shoppers, stockholders, taxpayers, LTO bond daddies, CDS sharks, Prius drivers, did I say bankers? Happily preying on each other in the meantime.
I go with all that, unfortunately, had to give up the booze.
Truth to tell, my rants are half-hearted attempts to do my duty as citizen. Driven by engineer within who always compares what is to what he knows full well could be instead if people would just get out of the way and let him run things right.
Real passion is thermal widgets in shop. Lotsa fun on pyrolyzer and thermocompressor, eagerly awaiting chance at kite power mill.
Who told you WE have to leave OUR oil in the ground? Al Gore?
IPCC says with great emphasis that the ff’s had better mostly stay where there are or WE are cooked.
WE meaning homosap.
Planet does not care one tiny iota who “owned” the oil that put that carbon up it’s nose.
BTW. who is Al Gore?
Al Gor ain’t the John Galt who shut down the world- that is for damned sure.
I have never liked him personally -too wooden , too elitist, too big a hypocrite when it comes to walking the walk instead of just talking the talk- but nevertheless his message is sound.
BUT that doesn’t mean diddly squat.
We hear a hell of a lot of unquestionably sound messages on a daily basis and collectively ignore every last one of them so far as I have noticed.
Might have missed one – if so somebody point it out to me.
It is possible to slowly and gradually change people’s behavior via education aka propaganda when the behavior can be changed on an individual basis one individual at a time. So anti smoking campaigns if well enough funded eventually cut smoking rates for example.
But when we start talking about doing something that requires EVERY body to change his or her behavior in a fundamental way- you can absolutely forget about it.
I understand the consequences of global warming as well as anybody – but get right down to the nitty gritty of giving up oil and coal- giving up my car and giving up my cheap electricity- no way.
Giving up the car is ok for the folks who can afford to live in the chi chi university district where everything is within walking distance and the job is on the bus or subway line. I know , I lived there once myself.
The nearest country store to me used to be a mile but now the nearest one is FOUR miles up and down hill all the way. Steep hills.The nearest supermarket is TWELVE miles in the nearest town. My great uncle Scheafer used to commute that twelve miles ON FOOT in order to put in a day in a sweat shop furniture factory.
But I ain’t the man he was.
I am already burning wood despite my stiff back and arthritic hands and creaky knees in order to save a few bucks. There is nothing much I can do to cut the electric bill that I haven’t done already.
The absolute most I am actually willing to do is pay a little more in taxes to support the rollout of the renewables industries a little sooner.
The average monkey is not going to willingly do any more and probably less.
Hello greenhouse. The nieces and nephews never come to visit anyway. If they did I would give a serious damn.
A few generations back my fore bearers fled Scotland and Ireland. A generation or two hence I guess their descendants can flee this area for Minnesota or Alberta..Maybe even Nova Scotia.
It might not even be necessary. The old apple orchards will be long gone but it may get warm enough here to grow citrus. 😉
OR hot and dry enough to grow cactus. 🙁
I won’t be here to worry about it in any case.
Neither will Al Gore.
Sure, what you say about EV is what many rightly think right now.
My own observations- Wife uses her Leaf just as she did her corolla, doing all the stuff she does every day, about 30-40 miles/day, sometimes a lot more.
If we need to go to the city, I just demand my honda back from granddaughter and we go.
My west coast sons say that EVs are everywhere, and charging stations are popping up, esp at stores who find they pull in that segment of the customers.
All of this cost driven, nothing like ethics or concern for future or algore or such nonsense.
Leaf, so they say, has life cycle cost half corolla’s.
Al Gore is a movie maker.
The IPCC doesnt have personnel who understand much about the oil, gas or coal industries. Nor do they have a handle on basic economics principles. They also lack the engineering know how to understand practical limits for wind and solar power.
The IPCC is like a platypus trying to play professional football. It’s not genetically endowed to play that game.
Ok. Right. So, who do I believe, IPCC with thousands of people all being checked every which way, every step of the way, or you?
And, how I justify to my real smart scientific and engineering buddies, believing you instead of them??
I would believe me. The IPCC has no formal peer review process. Plus, as you expressed, they are only scientists. They aren’t really educated to figure out very complex issues. And I bet most of them can’t find Ghawar on a map.
Climate Change is real, and a serious risk. That’s what scientists in general tell us. Look at the statements of every major professional scientific association: climatologists, physicists, geographers, etc., etc.
Again, even the the American Association of Petroleum Geologists is willing to say that “AAPG supports reducing emissions from fossil fuel use as a worthy goal.”
So if “climate change” is actually real, why do so many scientists in other disciplines mostly view it as a lie???
The real answer is climate scientists, such as they are, get loads and loads of taxpayer money from the insane communist environmentalists in the 0bama administration. If these scientists would ever acknowledge all the real data that disproves “climate change” all that sweet, sweet $$$ from taxpayers like myself would go away. These scientists would be left jobless and penniless.
Thus the climate scientists have determined that, for their sake, the “climate change” lie MUST continue.
But like I said scientists on the outside of the “climate change” scam looking in don’t buy the fantasy that has made many charlatans, from algore, to michael “hide the decline” mann, to imbecilic Marxist clown barry 0bama lots of cash, all extracted from taxpayers.
Let’s face facts here, “climate change” will going to go down in history as the biggest hoax ever perpetrated on the world’s people, all perpetrated in the name of stealing hard–earned money and crushing individual freedoms.
Yup. I was waiting for someone to jump in about climate change. These folks must sit by their computers waiting to comment on any mention of global warming. It must be time consuming to be doing this. And they must be going crazy now with the recent climate meeting.
So if “climate change” is actually real, why do so many scientists in other disciplines mostly view it as a lie???
Yeah, right.
I haven’t seen anything to indicate this.
While I would agree with you that Gore is a charlatan. Or more aptly described by one of his “business associates” as a “sex crazed Poodle”. You are dead wrong on solar power potential. A recent NREL study showed only 7% of an average City’s surface area, can provide 100% of it’s power. And yes, you can run vehicles on solar power as well. Also, “exponential growth” is a hard thing to wrap your head around. A tiny 1%, will become a very large number in the not too distant future with exponential growth. And please don’t tell me that you’re smarter than Kurzweil.
http://www.businessinsider.com/kurzweil-says-free-solar-energy-20-years-2014-9
Well, while I don’t know what crystal ball Kurzweil has been staring into, and while I have no doubt he is quite intelligent enough to manage the said Palantir, I would point to the various easy to forget lessons from history. These would include nuclear (once billed as “too cheap to meter,” which sounds an awful lot like “free solar energy”) and the telegraph crowd (“this will usher in world peace”) and so on and so forth through the always-somehow-less-sunny-than-advertised futures of technooptimism.
But oh no, it’s different this time!
nuclear (once billed as “too cheap to meter,”
I’m not a big fan of nuclear, but we should remember that the nuclear industry never, ever promised that. This is really an urban myth, created by a single out of context quote.
Too cheap to meter nonsense http://www.thisdayinquotes.com/2009/09/too-cheap-to-meter-nuclear-quote-debate.html
Al Gore is the Great Satan that haunts the dreams of Republicans. He’s a retired American politician who Republicans imagine single-handedly masterminded a worldwide conspiracy that will bring about the end of civilization as we know it.
Foaming at the mouth about Al Gore is sort of a Republican shibboleth. He’s the Emmanuel Goldstein of the now predominant anti-science wing of the Grand Old Party.
Character assassination is the most infantile form of argument/discussion. Try to grow up a little, and get some education.
Because “character assassination” is precisely what we’re talking about – using Al Gore as a target is precisely that.
I hate to ruin your day, but you will find I’m too old and too faded to believe in anything. Al Gore is an easy target, so why not kick him around?
why not kick him around?
Because it ruins your credibility with anyone who doesn’t already agree with you.
I was amused and a bit surprised at the above responses to my rhetorical allusion to Al Gore, merely intended to imply that I can think without his help.
Oddly, I was in a three way heated discussion on energy between Gore and Gorbachev in Moscow, Nov. 1990
Gore was very big, smart, quick
and very well informed on energy.
Gorby was small, smart, quick and well-informed about everything.
As for me, I was trying not to stare impolitely at his highly conspicuous forehead birthmark.
Price tag reqd? 175 wells per month X 12 X maybe 9 million per well = about $19 billion for a year’s worth of loans in the Bakken. Call it 4 years and fewer, cheaper wells until recently and the outstanding debt in the Bakken looks like oh, call it $70 billion.
Eagle Ford and other places a bit more? $130 billion + $70 = $200 billion from the Fed should do it. Not gonna be a tril.
All told maybe a third of Lehman Bros.
Good numbers, Now, how much energy from same trivial billion pile put on wind in same place and solar shading the turtles in the SW, now just hiding under those rocks?
Keeping in mind that solar has real low depletion rate.
Pretty sure solar panels aren’t available commercially in the nuclear bomb hardened version.
Oil fields are.
If the bomb is ever used on the grand scale both oil fields and solar panels are history depending on where the bombs fall.
In the case that bombs don’t fall in my neighborhood I would rather bet on panels I can buy and install HERE rather than an oil field ELSEWHERE that might survive- the infrastructure between here and there might not even if the field does.
Any body know if solar panels are subject to emp burnout?
Blast will not get me where I am unless a stray bomb lands here.
Radiation may or may not- depending on the total number of bombs and where they fall.
I suspect the EMP would be more likely to damage the inverters, and charge controllers.
During my days as CEO of small R&D outfit, I was asked if I would guarantee survival of my widget in case of nuclear war.
I told him, no hesitation at all, that I was happy to guarantee ANYTHING to survive a nuclear war.
Gawd!
Ron, thanks again for good information. If I may, I think your good work is a great lead in to Rune Likvern’s recent article and I hope that you can squeeze it in soon.
My work is 80% problem solving so I tend to look first for engineering/practical explanations to oilfield mysteries. I still think that declining 24 hour IP’s may have something to do with intentional pressure maintenance of the well and perhaps to a lesser extent, intentionally restricting flows due to new flaring regulations. I do, however, believe that your IP data is implying declining pressure in sweet spots, well interference, perhaps, increasing GOR, and that lots of newer wells being drilled in the trend are in areas of higher water saturation. I agree with your premise and I think Rune’s work will help folks to understand why we are seeing IP’s go down. I think the further along we go the more your premise will be obvious. I suggested to Rune several days ago that from an engineering standpoint it is a pity the price of oil has done what it has (that’s an understatement!) because it is going to throw a wrench in figuring out what’s going on with Bakken depletion.
A couple of things: I assume that N. Dakota regulations are similar to Texas. In Texas we have 30 days to file the completion reports after testing of the well has commenced. Within that 30 day period the operator will most certainly pick a moment in time, later in the period, after the well has cleaned up and displacement water used during the frac is recovered, to report. Most good wells in over pressured sweet spots of both shale trends, it appears to me, recover very little frac water. 20-30% of total, max. Thereafter, as reporting continues, there is no way to differentiate between frac water and produced water. Its all referred as produced water. Produced water, I believe, is both frac water and interstitial water. You know this, I am sure. There are ways to imbed radioactive isotopes in frac water to know, and I am sure those guys have done that.
And lastly, both linear and/or cross-linked gel systems used in frac’s require polymers that work only in certain water temperatures. There are large water heating services in N. Dakota, I note. In Texas (where we close schools when it gets below 40 degrees) we are, I am told, getting caught up fast on wells waiting on frac’s. Part of the problem in N. Dakota may be they cannot frac in the winter because of cold water and the additional cost of having to heat that water; if he can even stay heated in <20 degree air temperatures. If that speculation is true, it then seems likely we will not see a big reduction in the 650 wells in inventory waiting to get frac'ed until next spring. It then seems very likely they will get caught up very quickly, with not much to do after that, its beginning to look like.
Mike
Mike, does Texas have a sliding extraction tax scale that adjusts with WTI? NoDak slides from 4.5% downward if there are 5 consec months with WTI lower than $52.
Nope. Severance taxes are 4.6% of whatever posting the operator is paid on. Its been that way forever. Gas is 7% but I think there is a “tight” gas deduction that may apply to shale gas and/or gas associated with shale. I don’t know. Everything I own is pretty loose.
By the by, is there an average royalty burden deduction in ND somebody with lots of time on their hands has come up with? In the absence of hard data, I would be astounded if those total burdens were not at least 22-23%. Mineral owners very much have had the upper hand in this shale gig, often demanding and getting quarter royalties, 5000 dollar an acre bonus, and even drilling commitments.
Mike
I saw a quote of 14-18% royalty in the Bakken. The taxes add to that.
Mike, they don’t have to be radioactive isotopes. I have set up tracer programs, and it’s possible to use non radioactive tracers. By the way, we also use tracers we install in pills stuck on the outside of the casing string. The water tracer signals tell you where the water is coming back from. But that’s used for optimization.
Hello everybody. Here are my updated graphs. First production profile per year. I have started to use first production month instead of completion month. It should give slightly more accurate data. The last data point for 2014 continue to follow the 2012 curve. February was a bad month and the last data point contains only data for January and February. So that´s why it´s lower.
Here is the same graph as above but here I have used sales (runs) for months that are confidential. I think the sales number is a bit lower than production for the first month or so. Maybe some of the oil is stored instead. But look how much nicer 2009 is. Apparantly many of the best wells in 2009 and parts of 2010 were made confidential.
Hi FreddyW,
In the data I have seen the confidential wells do not have formation information. Did you assume all confidential wells were Bakken wells? Or did you eliminate confidential wells from counties which have no Bakken wells? Or possibly some other method.
Hi Dennis,
I use this page to find out which wells are Bakken wells:
https://www.dmr.nd.gov/oilgas/bakkenwells.asp
Unfortunately, they are only added there after they are no longer confidential. So the wells in 2014 which are still confidential have been excluded from the data. I will be able to include them later though when they are no longer confidential.
And here is the water cut profile graph. 2014 water cut for first month after production start is up one percentage compared to the September graph.
Here is the one month after production start graph. There was a discussion about choking to keep the oil to gas ratio higher. So I added gas production in the graph also. Does anyone know if choking is used during the whole lifetime of a well? Or was it just in the beginning?
As you can see, water cut continues to increase. You can also see that gas production is increasing over time.
Finally one month production for Mountrail. Gas production seems more random here. So I think the reason for increased gas production for the whole Bakken is because they drill more wells in areas with more gas content over time.
Water cut recovered but is still high. Perhaps Oasis gave up on the northern part of Mountrail. Oil production is historically in the lower part of the production range. But it´s hard to tell if it´s just normal variations because of the noisy data. My guess is that it is actually lower. The increased water cut should have some effect.
Hi FreddyW,
Thanks. Great stuff.
Freddy, thanks for all this. This last one is the most interesting to me. As a reservoir depletes pressure declines and when bubble point is reached GOR goes up. My apologies to people smarter than me. So, increasing gas could be further evidence of depletion. Pressure management is important in producing wells; there are a lot of reasons to believe its pretty much been balls to the wall on this shale stuff up there in the Bakken and nobody, until recently, has been managing pressure. In sweet spots, Elvis may of already left the building. I am speculating, however.
Might you know, does ND require associated gas to be metered even if it is flared? If not, an increase in gas might simply be due to flaring restrictions, I don’t know. I am leaning toward higher GOR.
Mike
Hi Mike,
If you look at the reports here;
https://www.dmr.nd.gov/oilgas/mprindex.asp
you can see that gas sales are often much lower than gas production. So looks like all gas production is reported.
Regulatory agencies usually require all flared gas to be reported. I don’t know about North Dakota, but in other locations the royalty owners have a need and right to know what’s going on.
GOR does have to increase over time. In a tight reservoir the areas near the wellbores or fractures will be below bubble point even if the average pressure is above it. Thus is why you may see a slight increase in GOR?
If they manage to deplete the heck out of those reservoirs then GOR will start to drop slightly. But the well usually waters out before GOR starts to drop.
I don´t know much about choking. But I had a theory that perhaps to make the wells look better, the companies use less choking for wells that are not so good. This will increase initial oil production, but increase water and gas production even more. From what I understood from the discussions here, this will however have a negative impact on EUR. The first graph could support that theory. But the Mountrail graph does not. So maybe the increase in gas production for all counties is because they drill more wells in areas with higher gas content. On the other hand, oil production actually seems to decrease for Mountrail as water production increases. At least lately. So maybe they don´t feel a need to use less choking for Monutrail wells. They are good enough. I don´t know….
Freddy, do you have an excel backup for your data. it is terrific and i would love to get my hadns on it.
The data is in different sheets and in my program. Tell me what data you are interested in and I´ll see what I can do. You can mail me at nightbat99 at hotmail.
Do we make anything of 2014’s graph falling below all other years by 9 months out and under 2013 by 6 months out?
Hi Watcher,
The well profile may have changed, but it is too early to tell if the tail will be below the 2009 well or just follow the path of the 2009 well. Mike, ManBearPig, Doug Leighton, or Fernando could make much more informed guesses than me.
Hi Watcher. As I wrote in the first post, February was a bad month and only January and February are included in the last data point. So that´s why that one is so low. January was a good month, but not good enough to even out February. The next best months so far are June and July. They are not inlcuded in month 5 and later. So month 5 and later should get higher when the data for those month comes in.
It should be the best months so far are July, June and May. They are not yet included in month 6 and later for 2014.
Plot the natural log of rate versus cumulative oil, and compare well populations. That may work.
In D. Hughes’ recent report, Drilling Deeper, he presents a chart on P43 entitled “Average decline profile for horizontal tight oil wells in the Bakken play. Decline profile is based on all horizontal tight oil wells drilled since 2009.”
As I posted earlier, it shows average first month production to be 548 b/d. Can someone explain why the first month production on the above chart, at approximately 400 b/d, is so different and significantly lower?
Possibly calendar month versus first 30.4 days well life. When I was young and had to massage a large well test data set I would include the first day’s date in the logic flow, to allow me to set them on an apples and apples basis. Thus I used the well tests and their actual dates to do the hyperbolic fit. Well test data has to be massaged for actual hours in production. We usually see a discrepancy between the field data and metered sales, so the correction factor has to be included. When one gets really precise it may make a difference. As I pointed out in a previous post, plotting rate versus cumulative does provide a different perspective. Sometimes it helps.
Hi Ovi,
Fernando has this right. The first month of production for the average well is only 15 to 16 days. I believe that FreddyW takes monthly output and divides by the number of days in the average month, so for month 1 the output for 30 days of output would be about 2 times the number shown in FreddyW’s chart.
Note that when trying to model the field output by using an average well profile and the number of wells added each month, the actual monthly output for wells in the first month will only be about half of what Hughes shows in his chart. Below I give monthly output for the average Bakken well from 2008-2014 from month 1 to 54 in barrels per month:
8,504
11,234
8,944
8,000
7,286
6,674
6,155
5,670
5,340
5,030
4,705
4,466
4,271
4,040
3,890
3,717
3,575
3,421
3,321
3,191
3,064
2,999
2,929
2,869
2,791
2,700
2,628
2,610
2,526
2,487
2,399
2,391
2,320
2,294
2,246
2,195
2,168
2,156
2,093
2,062
2,028
1,961
1,947
1,932
1,917
1,874
1,851
1,841
1,815
1,769
1,757
1,723
1,723
1,666
Data from Enno Peters through August 2015 gathered from the NDIC
Data through Aug 2014 not Aug 2015
Note that using simple exponential decline of 12% per year from the last data point gets us to 8 b/d (abandonment level based on Mike’s analysis) at 19.5 years and roughly 320 kb for estimated ultimate recovery (EUR).
Well would be at 197 kb at 5 years and 153 kb at 3 years, 123 kb at 2 years, and 82 kb at 1 year. Oil at the refinery gate would need to be $92/b for simple payback in 3 years (assuming a well cost of $8 million), net revenue would be about $52/b, transport cost $12/b, other costs $8/b, taxes and royalties at 26.5% of wellhead revenue. It is not clear that drilling new wells makes much money at a Brent price of $60/b.
Concerning oil conditioning.
The new reg is 13.7 psi for vapor pressure. This is 1 psi lower than the national standard of 14.7.
Helms said in several googleable articles that most wells already have equipment to perform this restriction and those very few that do not have to buy it. The regulation won’t be imposed til Feb.
But above in the Director’s Cut he leans on it as one of his excuses for a negative month. So . . . what can this mean?
I’m not familiar with the set up in North Dakota, but in general the stabilization of a líght crude requires the removal of light hydrocarbons. In a well regulated system the light hydrocarbons are sent by pipeline to a gas plant. I get the impression that North Dakota regulations are closer to North African or what prevailed around the world 50 years ago. I would call it rather primitive and wasteful. They would have been much better off slowing down development and enforcing a decent set of gas flaring and other regulations.
Slowing down was never possible when it is all borrowed money.
Slowing down was a matter to be decided by the sovereign state of North Dakota. All they had to do was limit flaring on a per well basis, and require that a well’s gas production be marketed, otherwise they would pay a fine. It’s done elsewhere, and it works fine. I get the impression that North Dakota state authorities were a bit amateurish.
I ran into this site the other day
http://oilandgas.ohiodnr.gov/production
which has well by well production data in excel.
Rgds
WP
132 month retail nominal gasoline prices, United States…
http://www.gasbuddy.com/gb_retail_price_chart.aspx
U.S. gasoline priced from 1972 and on normalized to 2014 dollars.
http://zfacts.com/gas-price-history-graph
Actually, if you further adjust for the average miles per gallon of the US fleet of passenger autos from 1972 until today, the cost of gasoline per mile driven is much lower today than in 1972 for the average US consumer.
Got a source for that? One that considers the number of light trucks used as passenger vehicles?
-Lloyd
I’m not convinced on the day 1 numbers. There certainly is a trend with them, but how do we know that these were not all hold for production wells as opposed to infill wells? Do we know the vintage of these wells at all?
Also, we don’t know if these numbers are pre-lift installation or post lift-installation as far as I can tell.
What artificial lift system do they use? I thought these were flowing wells, choked back, producing around 1000 GOR from a slightly over pressured formation.
The Bakken wells are definitely using artificial lift. If you look at the slides from Continental’s analyst day, they had a whole section on various forms of lift they are using.
Ok. So if they use artificial lift then why do I hear talk about chokes? Or are we discussing what happens after the well stops flowing?
There were definitely slides in CLR’s briefings on lift technology, so you have a very good point about that vs choke.
Ive seen rod pumps and rotoflex. I have yet to see any ESPs, but that does not mean that they don’t exist.
Got it. Sometimes it’s necessary to put a well on artificial lift AND on choke. I used to do it when I was young, to provide back pressure inside the tubing to open gas lift valves.
These wells seem to produce at 1000+ SCF per barrel GOR, their water cut gets over 50 %, so it appears the pressure drops, and they benefit from a lift system. But lifting a horizontal well is a bit complicated, it gets even more complicated if the well is drilled without regard for the lifting system requirements. I bet they are learning a lot as time goes by. Chuckle.
Ron,
Not that it matters but how does EIA have countries producing Negative barrels of oil?
I saw Kenya, Sri Lanka and bunch of others. Are they stealing oil from the rest of the world and putting it INTO the ground?
You’ve got me. I never noticed that before. But it is only in “Total Oil Supply”. No negative numbers are shown in C+C or even “Crude Oil, NGPL and Other Liquids”. And the only difference in “Total Oil Supply” and that last category is “Refinery Process Gain”. So I guess they have a refinery in these places that shows negative production and they have losses instead of gain. They could do that by importing all their oil and using some of it for heat in their refineries. That would mean instead of “Refinery Process Gain” they would have “Refinery Process Losses”.
I am not joking, I seriously think that is where the EIA gets those numbers.
That is likely correct. There was some indication of that in Louisiana, using oil rather than nat gas for heat in refineries. They produced enough not to go negative, but the refineries dragged them down.
Thanks Ron. Loved your work on TOD and here as well.
Could you me a link to their kenya page? I worked in Kenya many years ago, and I may be able to contact somebody who works there.
Some conversation concerning how to render economical that which is not.
1) If the price is too low, what do you do? A bailout. Various forms. The easiest is the Fed buying HY bond securitized packages.
2) But there are steps before that for all Central Banks. There is, of course, the jawbone. Super Mario Draghi has been jawboning the purchase of sovereign bonds of constituent EU countries for 3 years now and that has indeed sufficed to take Italian borrowing costs from about 9% to 2%. Just the threat from Mario that he’ll come in and buy those bonds strikes terror into the hearts of all shorters of Italian bonds and they flee, which drives the price of the bond up (and its yield down). — And thus, a step before the Fed buying that HY paper would be just the most oblique of mentions of the possibility. Presto, up goes the the HY bond price (and down goes the yield), and if the market believes the jawbone, they’ll lend to the deadbeats as long as the deadbeats want to borrow because they presume the Fed will backstop them.
This fails only when the Fed doesn’t actually do it. The game of chicken elevates to a national sport, and you might be able to buy time with it. Then if price rises (after #3 below) the Fed can say “we never bailed out shale”.
3) We can use government action to raise the price of oil. Nothing so crass as issuing a decree to NYMEX. Much more simple. Bomb someone in the Middle East and rattle the hell out of some relevant sabers.
Naturally someone will ask “why didn’t the Fed jawbone the price of Mortgage Backed Securities in order to get the market for such engaged?”
Answer: Desperate urgency. If GDP influence from the shale industry is indeed huge and the evisceration gets clear quickly, the jawbone step may be jumped over for HY paper, too.
Isn’t it a bit contradictory to simultaneously claim that (1) a bailout of 200 bn USD, i.e. less than 2% of US GDP will suffice to take care of the shale oil industry’s outstanding loans and (2) that the shale industry has a huge influence on US GDP?
Seems to me that while the shale industry may have a large impact on ND and Texan GDP, it’s far less significant for the US economy overall.
The industry sure has a share of sissies nowadays. In 1986 we got decimated, I saw body parts flying around and nobody discussed a bailout. If the problem is caused by bankers who put their money into shale oil at a naive interest rate, they should take their lumps. That ought to teach them a lesson not to thread in a business they don’t know anything about.
Yes it is. and since the price of oil has fallen so far, America’s oil import bill has fallen anyway. That will be as big a GDP shot in the arm* as the LTO business was. So even if LTO disappears completely, it will just be a ripple on the surface, not a net loss to the economy.
*Remember GDP means gross domestic product. Increasing net exports either by exporting more or importing less increases GDP. In 2013 the US imported about 30bn barrels of oil, $300bn at $100. At $60 that would be $180bn, making the GDP $120bn larger. That is comparable in size to the LTO business.
In 2013 the US imported about 30bn barrels of oil, $300bn at $100. At $60 that would be $180bn, making the GDP $120bn larger.
According to the EIA the US imported 2,821,480,000 barrels of oil in 2013.
30,000,000,000 x 100 is not 300 billion, it is 3,000,000,000,000 or 3 trillion.
Must be about 3 billion barrels since 20 million per day is 7.3 billion.
Woops a zero slipped in.
I was looking at the same chart. 3 bn barrels times $100 dollars/barrel is $300bn dollars. 3 bn times $60 is $180 bn.
However the decline in 120 bn oil imports is offset by the decline of approx. 200 bn in revenues from US energy production (10 mill bpd including natgas) which exceeds the benefits of lower imports. The shale industry has completely turned upside down the framework for US industrial policy. A high oil price is now more beneficial for the US industry than a low oil price. In my view policy makers have already realized this after the recent decline of the high yield market, which comes on top of the damage from the oil price decline. FRO (Frontline, a large oil carrier) – is my indicator for the direction of the oil price – went up by 66% last week, which indicates already an impressive turnaround of the oil price within the next two months.
That $200B revenue is a cost to consumers. Every dollar that is lost to producers is a savings to consumers.
Exactly. Some precision is required to sort this.
The fall in revenues for domestic oil (which is mostly rent taking in the case of conventional oil and gas) is offset by a win for consumers, so it is more or less a zero sum game.
The damage to the shale industry, which is actually much closer to the economic edge, will be a real loss to American GDP, because it means a fall in production volume and (presumably) an increase in imports. But this damage is more or less offset by the fall in import prices, because lower prices for imports increase net exports. It increases American GDP by reducing American contributions to the rent taking of foreign oil producers.
HL,
Lots of crude is being shipped to China right now as they build their reserves. That may be a big part of that increase.
My guess.
Valid point at first glance. At second glance, the Fed acts to save banks. If they have swap exposure to HY paper, that can trump even GDP as Fed inducement.
And $200 B would be the accumulated HY debt. As has been discussed, the GDP influence extends to the guys who inspect oil carrying railcars and declare they won’t blow up. They get funded by the flow. Ditto the refinery. Not just the 200B.
Sure the supply chain gets part of the cake but that money comes out of the drillers’ revenue — it’s a cost. GDP is a measure of income. To calculate the drillers’ contribution to GDP, you subtract their costs from their revenues. That money then goes to the suppliers, but their costs get subtracted out and passed along as well.
Ya, I’m just rebutting the point that 200B isn’t enough to obliterate GDP.
The railcar guys funded by driller flow . . . they buy burgers at BK. Money multpliers and velocity and all that claptrap. Buy enough burgers and BK borrows money to build another BK blah blah.
Some insight on the Bakken and how Slawson Exploration, the ‘ultimate explorer’ does it:
http://www.petroleumnews.com/pntruncate/598322162.shtml
Some Thoughts on Net Export Math Vs. Net Cash Flow Math
As I have periodically noted, given flat to increasing oil consumption in a net oil exporting country, and given an ongoing production decline, the resulting net export decline rate will exceed the production decline rate and the net export decline rate will accelerate with time. We actually see something similar for the net cash flow from producing properties.
Let’s arbitrarily assume that we have five properties, each generating a net cash flow of $One Million per month, after direct Lease Operating Expenses (LOE), and not counting General & Administrative (G&A) costs. Let’s assume that LOE percentages range from 10% to 50%, so the gross cash flow would vary for each property, but the net cash flow, after LOE, would be the same.
Let’s then assume that gross cash flow at the wellhead drops by 50% for all five properties, and let’s then look at the resulting decline in net cash flow for each property.
Again, we are assuming that the initial condition is that each property generates a net million dollar per month.
LOE = 50% of Gross, and gross declines by 50%, net declines by 100% (goes to zero)
LOE = 40% of Gross, and gross declines by 50%, net declines by 83%
LOE = 30% of Gross, and gross declines by 50%, net declines by 71%
LOE = 20% of Gross, and gross declines by 50%, net declines by 63%
LOE = 10% of Gross, and gross declines by 50%, net declines by 56%
One can see how a 50% decline in gross cash flow really hammers higher cost older properties, e.g., the North Sea and the North Slope of Alaska, and this is without taking into account G&A costs. Here is how Euan Mearns described the North Sea employment situation: “Here in Aberdeen a massacre is in progress.”
Of course, a projected lower price profile hammers the discounted Net Present Value (NPV) and EUR for all types of producing properties, especially high decline rate tight/shale plays and higher cost older properties.
In any case, it seems to me that the Saudis are targeting not only high cost US tight/shale producers, but also higher cost older properties, like the North Sea. One also wonders about the older, higher cost Western Siberia properties in Russia.
Interesting and appropriate breakdown Jeff: from what I’ve heard elsewhere, massacre, or even crucifixion, are certainly apt metaphors for both North Slope and North Sea these days. Perhaps Mexico should be added to the massacre manifest as well?
As you know (though others may not) taxes on revenues of state oil company Pemex provide about a third of all the tax revenues collected by the Mexican government. So, besides declining production, low oil prices correspond to a double whammy.
Meanwhile, in Alaska, oil revenue is expected to drop from $4.7 billion in the last fiscal year to $2 billion this year and $1.6 billion in the fiscal year that starts next July. This translates to a 58% revenue drop from the last fiscal year to this year.
I am not a Pentagon worshiping guy but I am a hard core darwinist and tend to take what I hear from the Pentagon very seriously indeed- except that I take what the generals have to say about needing more money with a generous helping of salt.
The generals have Mexico pegged at being at very high risk of collapse- one of the three highest risk countries in the world if I remember correctly. It has been a while since I checked.
A casualty of the “war on drugs”.
It is truly an Alice in Wonderland World when the Saudis are responsible for a World Wide glut in supply when they fail to cut back production, while there is another country that is increasing production at unprecedented rates! This is jingoism and nearly insane economic ideology run riot.
The question is, what’s realistic and feasible regarding production cutbacks–the world’s largest net oil exporter, whose exports are controlled by one entity (Saudi Aramco), or thousands of individual operators in a net oil importing country, the US? Seems like Door #1 is the more realistic choice.
During the 2008 oil price decline, according to the EIA Saudi Aramco cut their total petroleum liquids production (+ other liquids) by about 1.2 mbpd (from July to December, 2008), which is a pattern that Saudi Aramco does not appear to be currently emulating.
In any case, I am beginning to think that the Saudi’s primary target is high cost legacy production, e.g., the North Sea. Once these wells are plugged and abandoned, they won’t be coming back, while the undrilled shale play resources will still be there.
I think it is easier to trim companies (regardless of how many them) then countries (what Aramco or Statoil represents).
The core concept. Can shale restart?
If $70 is breakeven on the way down, it simply, utterly, unequivocally won’t be breakeven on the way up. Things are going to happen. The mountain is going to get steeper going back up than coming down. The evisceration is going to lead to ugly things and NoDak will have to pass legislation to prevent those things next time — so higher surety bonds next time. Maybe unionized labor next time guaranteeing 90 days notice. We may even get some regulation of the high yield space. Obliteration is the sort of thing that causes regime changes. NoDak may have a Democrat state legislature next election and voila, all sorts of anti oil industry rules get into place raising that breakeven price.
It is way past credible envisioning $20 or $30 more in breakeven price on the way back up than it currently is on the way down. The Peak would get more profound and the wars accelerate. haha and they could be blamed on a Dem state legislature. How cool is that?
Some days I think Watcher has his MBA from an elite university and somedays I think he is just a well informed Joe Sixpack.
His opinion of my reasoning may well be lower than mine of his- which varies wildly depending on what he says from day to day.
If the ND tight oil industry goes bankrupt – which does appear to be a very real possibility at the moment- it WILL come back once oil prices are high enough to justify the comeback.
Now if the honest to Jesus all in average cost of ND oil is seventy bucks in todays money then when the price of oil gets back above seventy bucks in CONSTANT MONEY compared to today then the ND tight oil industry will start put out new green shoots and take off again.
The reasons are not hard to understand. Here are a few of them.
First of all sunk investments in seismic and other research cannot be recovered but neither are they permanently lost. The data will be there.
Sunk investments in roads water sewer pipelines power lines disposal wells existing wells storage facilities housing jails and new construction of all sorts from a service station to a minimall will still exist. Refurbishment is not even remotely as expensive as new construction.
Sunk investment in land leases and equipment leasing and that sort of investment will simply be wiped out.
The real costs of production will be known and a good deal more will be known to outsiders as well as insiders because bankruptcy lawyers are persistent sobs who get paid according to their results at least in part.The transcripts will have all or nearly all the real data and they are public records available for purchase for peanuts in relation to the info that will be in them.
Land leases will have to be rebid and the new operators will know the score and not bid so high as last time around. Royalties will be renogiated and they will be lower.The state will lower tax rates to help the industry get back on its feet regardless of which party controls the state.
Everybody’s wages and rental rates will be lowered substantially because when work is short you lower your rates in order to get work and customers.
I have friends in Louisa Va that rent houses that they intentionally make sure are empty at the time of scheduled shutdowns at North Anna.
The workers who are there for a month will pay four or five times the normal going rent for that one month ya see. And they don”t really care about the carpet or the paint. So long as the stove and fridge and heat or air and the bathroom are functional the only questions asked are how far to the plant gates and how much for the month paid by the week in advance with whopping big deposit of course.
Rents in ND near the oil fields will not recover until the workforce is rehired on the grand scale after an industry bankruptcy..A four or five thousand a month house currently shared by a bunch of buddies will rent for five hundred again the way it did ten years ago- assuming it wasn’t sitting empty ten years ago and rotting down.
Dedicated machinery such as drill rigs will sell for peanuts since there is little work for them anywhere else. The first people back in will be able to buy rigs for little or nothing compared to the cost of just leasing them in recent years.
This is an extreme example but I bought my big backhoe at the bottom of the last crash a few years back for the nominal rental value of it for one year a week at a time. This machine at that time was pretty much good to go for at least three or four years with a little luck with only routine maintenance and maybe a couple of not outrageous repairs.It will still be in use twenty five or thirty years from now given that I only use it a day now and then.
IF business picks up nice and strong I could rent it for a year for what I paid for it and get it back worth seventy five percent of the value of it the first day of that year.
One of my sisters bought a perfectly good house for twenty five grand during the last bust. She could sell it now for close to a hundred less than a decade later.
Aggressive business men understand this sort of dynamic to the tip ends of their fingers and toes and will get back into ND with a vengeance after a fire sale- as soon as oil prices start back up.
There will be SOME fire sales. I doubt the entire industry will go on the auction block.
Some of that is good justification for arguing no hysteresis in upward price vs downward price defining breakeven.
Some . . . hmmm. Okay yes, they already performed the seismic imagery and that’s stored so they don’t have to pay for it again. But that defined startup cost initially, not present breakeven. It doesn’t have to be redone NOW during drilling so that cost isn’t in NOW breakeven. So no advantage there.
NoDak will want it to get going again for revs? Yup. But they, like everyone, will want to adjust their risk next time. Higher surety bonds. No escaping it. They will want cleanup costs covered by someone other than NoDak citizens.
Disposal wells already drilled? Hmmm. I don’t know how it works, but given that there is quite a debate underway concerning the source of water in watercut numbers being seen, it does seem possible that the disposal wells are going to fill their pores with water already down there, if there is time for that to happen. So . . . gotta redrill. No advantage there.
Lower lease costs? Original conversation: “Howdy, Mr Mineral Rights Owner. I’m CLR. I’d like to buy leases to drill on your land. Now understand that this moment we don’t know there’s any oil there. We just think there is potential. Therefore the price we’re offering is this.” Restart conversation: “Howdy, Mr Mineral Rights Owner. I used to work for CLR but they went Chapter 11 so I work with a new company now and we’d like to drill on your land. Here’s our opening offer.”
“Yeah? Get off my land. I got a better offer for a lease this morning because people KNOW there is oil there now. Up your offer, and I’ll be reasonable about this, I’ll give you 30 whole minutes to decide, good cell coverage here, make your phone calls.”
Opinions make horse races. I have stated mine. You have stated yours.
The oil man coming back will know a hell of a lot more than his predecessor and he will be well aware that he is going to have to post bigger bonds and pay more interest and all that sort of thing.
He will take that into account and after Mr Farmer who always made his living gnawing his fingernails wondering what wheat would sell for runs off a couple or three oil men who understand that if they are not to go broke themselves they will have to work smarter and cheaper- the way it will work is at some point pretty soon the farmer will realize nobody is going to pay the old historical lease rate.
Now of course SOME landowners may be able to hold out until the price of oil is north of a hundred bucks again and get top dollar for their mineral rights again.
(But your original argument was that the industry will not or may not recover at all. I catch a whiff of contradictory thinking here.If oil prices go above a hundred again and stay there which seems very likely to me – but not in the near term of course- then there is no doubt in my mind at all that some people will make some money in tight oil.Part of what they NET will be money they do NOT pay out in excessively high land leases.)
So he can go back to raising wheat or sitting in his rocker or whatever or he can sell his lease rights for what somebody will pay.
Two years ago we got the highest price ever for our apple crop. This year we got half as much. We sold it for what we could get because we have no other possible use for them.
. Ya can’t buy groceries or put the wife in a new car with oil in the ground that is priced out of reach of an oil man.The next oil man is going to be a lot more conservative that the last one – very much in part because of the fact that whoever loans him money is going to be keeping a MUCH closer eye on his books.
If he can’t show a better budget than the guys who went broke nobody will loan him any money next time around.
“Aggressive business men ……. will get back into ND with a vengeance after a fire sale- as soon as oil prices start back up. And where does the money come from? Investors lost money, are burned, and probably very hesitant to invest in a ponzi scheme that revealed itself. Only after a time when people forgot the lesson learned and the oil prize is very high, some risk takers may come back.
Is there no way to shut down a deep water oil field for a few years short of actually plugging the wells?
I see that there has been no need to consider this question up until now – given that this is the first time prices have collapsed and appear to stay in the dumps for a while since the North Sea fields were developed.
Maybe there are emerging technologies or techniques that will enable mothballing rather than plugging deep water wells.I haven’t heard about anything along this line but it seems that whoever can do it -if it can be done- stands to make some serious profits..
Mac, “Is there no way to shut down a deep water oil field for a few years short of plugging the wells?”According to my niece (Bergen based Petroleum Engineer) that is happening right now in Norway but I don’t know about the “for a few years” part. She had said: until at least next summer so perhaps idling wells for multi-year intervals may not be practical. Probably someone else knows. Nikki (Nicole) isn’t always that quick answering my e-mail but will ask her. Why she puts her boyfriend ahead of me is a mystery!
Actually I listed (named) the Norwegian platforms being idled a few posts back — if you care.
I saw that comment and thanks. Even though I know almost nothing about the industry in respect to hands on management I have known all along that platforms are idled occasionally for various reasons mostly due to major maintenance work but also due to storms and icebergs and threat of war once in while.
The question is how long the wells can be idled without extraordinary expense or it becoming NECESSARY to do something irreversible such as plugging them.
Thanks again.
My guess is that oil will be going up again within a year for what it is worth.Maybe those platforms will be operational again within that time frame.
I guess the API of the crude must be a consideration. I have read that Russian Siberian oil can’t be shut because it will “freeze”. I guess you could pump a high crude api down the well so that the heavier stuff stays hot enough to flow
Doug,
Those you listed were (deep water) exploration rigs.
Producing installations, different story andt some of these will struggle with a sustained lower oil price.
Thanks for that clarification Rune.
As her about irreparably damaging fields.
Though that may be considered obscene.
It depends. A North Sea platform can’t be shut down that fast. There are labour and abandonment costs to be considered. In some cases it’s worthwhile to produce at a loss for years to postpone abandonment. I was there when we were choosing platform concepts for a couple of North Sea platforms, and I felt (and now I know) the methodology we used to weigh concepts was wrong. So now the abandonment costs can hit like a kick in the teeth.
http://www.nytimes.com/2014/12/12/business/energy-environment/solar-rises-in-malaysia-during-trade-wars-over-panels.html?_r=0
This is a sobering statistic given that the entire world output is only about fifty gigawatts.
Given the capacity factor of nuke and the capacity factor of solar farm the entire world production is only equivalent to about half a dozen nukes.
But there is some comfort to be taken in the (so far at least) exponential growth of production from year to year.Installed capacity can double pretty quick.
I think you’re looking at stats from a couple of years ago. Installed capacity today is closer to 200 GW. With a doubling of capacity every 2 years. Battery EV sales have been doubling every year.
http://en.wikipedia.org/wiki/Growth_of_photovoltaics
I wonder if the Saudi’s aren’t looking at those numbers, and figure they better sell their oil now on the cheap, while they still have a market for it.
According to the chart just above it is 2014 data.
I was referring to the chart which is about the quantity of panels manufactured every year rather than cumulative panels manufactured over the years.
If this years total output of panels is only fifty gigawatts and installed capacity is two hundred I doubt the industry can scale up fast enough to double installed capacity within two years.
It might be possible to double the quantity of NEWLY MANUFACTURED PANELS within two years but even that seems doubtful to me.
Doubling times generally increase pretty fast as industries scale up beyond a certain size even though actual output of the product can still be growing very fast.
I have high hopes that renewables get to be cheap enough that there is an investment boom in renewables based on actual dollars and cents costs without subsidies within the next few years – hopefully within a decade.
John, there is a difference between INSTALLED capacity and ANNUAL INSTALLATION.
According to BP, as of the end of 2013, total installed PV capacity was 140 GW. The annual installation during 2013 was 38 GW.
Solar panel annual production corresponds to annual installation but not all solar panels produced during a calender year are installed in the same year.
Hi PE,
BP leaves a lot of non commercial solar out of its figures, specially in the US, but possibly elsewhere. We could probably use the total PV that is manufactured and assume that most of it will be installed to get a ballpark estimate, BP does a fairly good job with oil and gas, renewables data may not be very good.
Thanks Dennis,
But BP’s PV installations actually have been higher than EIA’s total numbers for solar, tides, and waves.
I also find that BP’s numbers seem to the same as or similar to what is claimed by the solar industry.
I wouldn’t worry about solar power if I were Saudi Arabia. Solar power penetration has two limiting factors: a country’s economy can only subsidize an economic parasite if it’s small, and a grid can’t work with large solar and wind real contribution.
Yes, but at some cost point, the parasite is no longer a parasite. As evidenced by an investment bank downgrade of utility stocks.
http://www.businessinsider.com/barclays-downgrades-utilities-on-solar-threat-2014-5
Although there isn’t much fuel oil generated electricity in the US, it’s still a substantial number worldwide.
An even greater worry may be the electric car sales.
http://cleantechnica.com/2013/09/30/electric-vehicles-speeding-toward-7-global-sales-2020/
I wouldn’t trust bankers to judge the actual or future performance of power grids. A lot of what we see is the drag of government regulations by really dumb politicians and their mentally minuscule bureaucrats.
As reality sinks in they will react. It may take a couple of years with blowouts, or large companies selling off their power plants. But the engineering and economics basics are like the law of gravity.
It looks like the Saudi’s reality includes solar power.
http://www.pv-magazine.com/news/details/beitrag/solar-power-key-for-saudi-future–says-energy-chief_100016969/#axzz3M1I6TCrP
Except neither of those is realistic.
Solar is rapidly reaching grid parity, and fossil fuel is not essential to a stable grid.
$40 oil?
http://www.bloomberg.com/news/2014-12-14/u-a-e-says-opec-won-t-change-output-even-if-price-drops-to-40.html
“Our expectation in OPEC is that after 2020, the oil industry in the U.S. will decline” due to the nation’s low reserves, he said. The U.S. won’t become self-sufficient in oil and will continue to depend on Middle Eastern supply, El-Badri said. ”
I rather think it is going to be a lot sooner than that.
The headline is way more powerful than that quote. ZH is all over it and Venezuela is having a coronary.
I read Venezuela’s production is down. And Maduro is having hissy fits. He spends a lot of time on TV screaming against us imperialism.
I doubt cutting production is really an option for them. The Arab Gulf dictatorships staved off the Arab Spring with massive injections of oil money. They remember what happened in Libya. If that cash runs out all hell could break loose.
And keep in mind they don’t really know if prices will fall that low or not. Nobody does.
If you fear an Arab Spring and you don’t have oil revenue to pay for social spending, you run a deficit. Big deal.
This meme of fiscal breakeven has never held water.
Yup, Andy.
El-Badri is practically fooling around with the competitors: “You think $60 (last week El Badri comment) is high enough, then we will give you $40 (today’s comment)”
OPEC is doing what Wallmart is doing every day. “Everyday low prices ” 🙂
And we know what happened with mom & pop shops when Wallmart arrives in your town.
I will get roasted by the people who hate Walmart without a doubt but the facts as I see them are these.
Mom and Pop stores never paid their help any better than Walmart.
They never paid insurance etc at all in most cases to the best of my knowledge.
They had less selection by a mile and generally charged a lot more for what they did have.
They stayed open much shorter hours- as a matter of fact the hours they habitually kept made it hard to even get into them if you worked eighthish to fiveish as often as not.
The vaunted personal service was not on average any better than big box stores these days.
I have attended the funerals of numerous drunks and wife beaters and world class deadbeats enough times to know that the family and friends and preacher never tells the truth about the deceased.The people bemoaning the demise of the mom and pop store are mostly just flapping their jaws or feeling sorry for themselves because they used to make good money running a mom and pop but can’t anymore.
And as far as stores like walmart are concerned – it is true they pay peanuts but so do just about all other stores with very few exceptions.
And I personally don’t know of ANY store that pays well where poor people can afford to shop.
Wages in retail service work suck for a very simple reason. The supply of potential workers willing to work for minimum wage vastly exceeds the number of openings in the retail industry.
All the peeing and moaning in the world is not going to fix this problem.
Raising the minimum wage will help the people who actually have minimum wage jobs but it will also mean the stores figure out ways to get rid of more workers.
When I worked as a kid in school in a fast food place it took two or three times as long to clean the floors as it does now- because benches and tables are NOW permanently mounted and so designed that you can sweep and mop without moving them.
Go in a cutting edge fast food place these days and you will place your order on a touch screen.
I would gladly pay a kid with no skills but a working brain five bucks to follow me around and hand me tools and hold one end of a board and just generally be useful to me while learning something but that is against the law now so the kid does without the skills and the five bucks and I just do the work myself since the average kid has decided he will never get his hands dirty these days or any grease on his clothes or pick up anything heavier than a burger and fries.
With that sort of attitude a helper is actually an impediment on a farm or in a garage or on a construction site.
A kid gets a hundred and eighty hours more or less instruction in trade work in a vocational school over the course of a year in one class at a cost to the public of a couple of thousand bucks.
I can teach a kid three or four times as much in a month at forty hours a week while putting some money in his pocket at no expense to the public.
But the thing is that in order to really teach I have to quit working five or ten minutes myself once or twice an hour.
So when I MUST have help I just pay whatever I have to pay to the kids Daddy.This is cheaper for me.
The Climate has Changed: Exploring the Investment Potential of Fossil Free Portfolios
This report was co-authored by Dustyn Lanz, Gavin McLaughlin, and Deb Abbey
2014 Responsible Investment Association, riacanada.ca
Excerpt from page 26.
A fossil fund ought to do great now, when prices are low and the uN Lima climate talks had such a weak ending resolution. Al Gore and Ban Ki
Moon must be feeling stressed now that temperature is surely going to exceed the 1.2 degrees C above today’s temperature limit they wanted to impose.
The beauty of Republican propaganda is that is reduces complex problems into hatefuls tirades against individuals.
Please explain why you think my statement is “propaganda” and “hateful”. I’m interested in improving my ability to feel empathy with alien cultures.
Who is Ban Ki Moon?
He’s the UN General secretary. I wrote about his moving speech in Lima in my blog, so I tend to use his name. He’s one of those guys I like to kick around.
First, you can avoid name-calling, like referring to people you disagree as aliens.
2nd, avoid using right-wing talking points, like suggesting that Al Gore wants to “impose” limits.
I don’t live in the USA anymore, so your culture is becoming alien to me. Second, Al Gore and Ban Ki Moon do want to impose limits. This was clear from the Lima talks agenda and subsequent comments. Those talks failed miserably, so they have been jawing on the internet the last couple of days. Their intent is clear. And ban Ki was aiming at cash. What I wrote as “moving cash from A to B”. He’s a wise guy.
“Impose” is a loaded word. It suggests coercion.
If you recognize that Climate Change is a real risk, then you recognize that carbon emissions are very costly. Accounting for real costs is essential to a properly functioning economy/world. If anybody is “imposing” something, it’s the laws of physics.
So, do you agree that Climate Change is a real risk?
I don’t think you’re a propagandist, but rather a victim of propaganda — brainwashed.
I recommend you review your own posts. I mean this in the most friendly way possible.
You post plenty of edifying things about oil that I much appreciate, but as soon as climate science or renewable energy is mentioned you turn nasty and start launching personal attacks on various politicians who have little or nothing to do with the topic at hand. That nastiness is your tell, as the poker players put it. Probably spent too much time listening to AM radio.
I’m a climate science expert. You don’t get it, do you?
No. I have to admit – I don’t believe that.
In what journals of Climatology have you published?
For Fred M if he’s out there.
RISING SEA LEVELS COULD MAKE FLORIDA RESIDENTS ‘CLIMATE REFUGEES’
https://ca.news.yahoo.com/rising-sea-levels-could-florida-100000163.html
They will just retreat to the Florida Alps.
Even at 365 feet high, it will help, as the sandbar we call Florida, becomes a good wreck snorkeling site.
The article quotes a “Professor Wankless”, who happens to be likely to be wrong. Sea level is more likely to rise around 60 cm by the end of the century (if we take the iPCC as a reliable source). A 60 cm sea level rise is perfectly fine for Canadians. We sell them inland houses on former swampland. Those houses won’t last 50 years. After they get demolished the new developer can fill the property with 150 cm of fill. That ought to do it.
So, do you disagree that Climate Change is a very important risk?
Heck, even the American Association of Petroleum Geologists is willing to say that “AAPG supports reducing emissions from fossil fuel use as a worthy goal.”
I support reducing emissions from fossil fuels. We are gonna have to anyway, so might as well do it in an organized fashion.
I think the risk posed by other issues/factors is a lot more important than “climate change”. I studied climatology and the engineering and economics associated with global warming because I had a personal interest in understanding the problem in depth. So frankly I’m somewhat amused by the defensive tone I get out of you alls comments.
That’s funny. I’ve done the same thing with energy issues, and I’ve come to the conclusion that Climate Change is far more important than Peak Oil.
The fact that you use the term “Global Warming” tells me that you’ve been immersed in the writings of non-scientists about this topic. The “anti” tribe uses that phrase, while climate scientists don’t.
Tks, Doug, I’m down in Brazil at the moment in a severely drought stricken region but I’m highly aware of sea level rise in South Florida.
Cheers!
Fred
P.S.
Anthropogenic Climate Change is a hoax and it only serves to enrich a few unscrupulous climate scientists…
Preliminary rounds are underway in NZ and Australia. Oil down 20 cents at $57.40. Dollar flat to slightly strong.
I see another 2% off. To WTI $56.65 at the moment.
It is going to bend, until something breaks!
Of course the solution to low prices is; ta-da, low prices.
Side effect; volatility.
As low and as fast as the price has dropped, and continues to, we should expect the flip side to occur once enough production decline/depletion has occurred.
I’m kind of intrigued as to when the price starts to rise again and and how high it goes. Most we can do is sit back and watch the drama unfold. Might be a while for the exciting stuff to play out, it’ll be something worth watching for.
http://www.reuters.com/article/2014/12/12/us-markets-oil-contango-analysis-idUSKBN0JQ0J620141212
So far as I can tell there is simply not enough storage capacity available at tank farms or anywhere else to substantially affect oil markets. The thirty five million barrels of storage mentioned in Cushing is only enough to run the country a three days or so.
But since oil comes in and goes out constantly the tank farm capacity seems to be more than adequate to manage day to day and seasonal supply fluctuations ok- with enough capacity left over that some oil can be profitably put into physical storage for a guaranteed profitable sale a few months down the road if the con tango spread gets just a little bigger.
I have no idea how many spare tankers are floating around someplace that can be used to store oil- but my guess is that all of them put together aren’t enough to store more than a day or twos world wide consumption.My impression was that most of the older ones were scrapped when demand for tankers was low due to so many new ones being delivered that the tanker market was glutted -at the same time that scrap metal hit record or near record highs.
The key point of this article is that when oil starts going into physical storage for later sale this is a good indication the market has bottomed out.According to the author the current price versus the future price a few months down the road is ALMOST low enough to go for it.
If you put it another way, it becomes almost trivial: If enough people expect oil prices to rise again in the future, futures prices will exceed spot prices. If people’s expectations are correct, then this is what will actually happen. Of course they may also turn out to be wrong. But then, nearly everybody on this site seems to agree that the oil price will rebound sooner or later. Question is just, when and how much…
Looks like sooner, rather than later.
Future prices are in fact higher than spot prices already. Just not quite high enough to make it profitable to buy and store physical oil.
According to the Reuters article, the required spread to make it attractive is 30c per month. Latest Brent futures curve goes up about 8 $ for the next 18 months, that’s roughly 45c per month. If you can net 8 $ per barrel, it sure sounds attractive to store crude and sell at the forward price, assuming you have ample storage facilities available…
Or you can buy incomplete unfracked horizontal wells from producers in dire straits. What’s the deal in North Dakota, are these wells treated as separate leases?
The largest oil tankers have a capacity of 3 million barrels and they seem to be only four in the world currently in service.
TI-class_supertanker
World total oil tanker capacity should be around 6 billion barrels. But the storage can only be done in spare tankers and I guess there are not many of them.
An excerpt from a recent analysis by Steven Kopits:
I agree with Steven about a “Crash and burn” scenario, and note that the trillions of dollars spent globally on upstream capex since 2005 have only kept us on a post-2005 “Undulating plateau” in actual crude oil production (45 and lower API gravity crude oil), while we have (so far) seen a continued increase in global natural gas production and associated liquids, condensate and natural gas liquids (NGL).
Note that Texas only accounted for 3% of global Crude + Condensate (C+C) production in 2013, but the Texas RRC shows that just the 2005 to 2013 increase in Texas condensate production would account for one-eighth of the 2005 to 2013 increase in global C+C production. (And of course, when the EIA talks about “Crude oil,” they are talking about C+C.)
Good analysis. I keep reading too much information blending liquids. This site sure has people who understand the issues much better than any other I’ve seen.
Steven Kopits has some comments, following this Econbrowser post, that Watcher might find interesting, about the “Lower Demand” thesis:
http://econbrowser.com/archives/2014/12/oil-prices-as-an-indicator-of-global-economic-conditions
Went through it.
Multivariate regression has always been at the mercy of cause vs effect and possible non included causes. And applause for him knowing that. He mentions the dollar and offers “the dollar strength is due to economic weakness, too” — presumably non US weakness.
Good, he regressed copper. Bad, he didn’t regress gold. Why? Because gold doesn’t care about economic weakness. It does care about the dollar and it cratered in the same time period — but one can hide behind “the dollar is weak also because of economic slowdown”. How convenient.
Very shaky rationale(s). It’s approaching the investigation with a hypothesis pre-enshrined in worship.
Since 2009 there has been an avalanche of contradictory economic metrics. Spectacular rises in SUV/truck/large car sales vs single family house sales going sideways along the post 2009 crash bottom. Real income grinding down. Unemployment rate also down. Job total increase vs none in law-neutral tax withholding.
That array of contradictions being noted, Europe is in economic freefall — but no more so since June than pre June. Nothing changed. China’s slowdown hasn’t shown in the car buying, so why is it presumed there is a slowdown? Because some rumors say so?
When you have a theory, like China slowdown, if even one variable fails to confirm, if even one experiment shoots the theory down, then it is not a failed theory. Just like any other hypothesis testing.
not = now
Watcher, I’d guess you know that coal prices have cratered since a 2010-ish high? About 50% drop but the high was a spike I suppose.
Under political attack, and replaced by nat gas. It WOULD be interesting to know exactly what they did since June, during which perhaps there was no natgas replacement event.
And another thing: He’s using data from 2007 to 2014 for his regression analysis. But nobody is denying that the crisis of 2008/09 led to a collapse in worldwide demand for pretty much everything, i.e. of course at the time there was a huge correlation between the lower interest rates and the lower copper price and the oil price. But this does not imply that it’s necessarily the same thing this time round: Correlation is not causation. Interest rates can be down because the oil price lowers inflation expectation, and the copper price can be down because the Chinese are building fewer houses, yet still driving more cars. As for the dollar, it’s only natural that a higher value of the dollar is negatively correlated to the oil price, as the rest of the world needs to pay for oil in dollars, and oil therefore becomes more expensive as the dollar appreciates. Always so many possible ways to look at things…
Hell, if interest rates were to be supportive evidence, you’d have to say consumption is down since the mid 80s, because so are interest rates.
Watcher: I’m curious about the “one variable fails” notion. In the analyses I’ve done, using an alpha value of p<=0.05, we'd expect one spurious "finding" for every twenty variables included in the model or checked independently (and that's why, if the problem allows, we use some "multiple comparisons" technique, e.g., Bonferroni method).
Would that apply in the situation you're discussing? That is, one variable failing to confirm as hypothesized does NOT mean a failed theory if enough other variables do confirm?
Several years ago I flew down to Mexico sitting next to a guy who was into training artificial intelligences to predict market moves. This guy was feeding everything he could find into that machine. So I suggested he look into the number of foreign visitors going to Disney World. He seemed to think it was an excellent idea. I guess you could say he had what Saddam would have called the mother of all multi variate analyses.
Most of the world should probably envy Japan her supposed demographic problems.
https://uk.finance.yahoo.com/news/japan-problem-isnt-young-women-112153147.html
I am not much concerned at this moment with the social issues regarding women in Japan but rather in the long term prospects of the people living there in a world already well into ecological and economic overshoot.
I have yet to see an article in the mainstream press that mentions the true situation in respect to national wealth and prosperity in such a country over the longer term.
It is true that the old folks are going to die-AND they are going to die off pretty fast starting now.
This is going to put a hell of a tax burden on the young people who must pay for their old age care . Nobody disputes this.
But on the other hand nobody ever mentions that the younger people in Japan are going to inherit a country chock a block overflowing with built and paid for infrastructure that will with some maintenance last indefinitely. When the old folks die the housing crunch for instance will melt away like snow in spring sun and the price of houses will fall to whatever level the young folks can afford. Houses will probably get to be very cheap indeed in twenty years time in Japan.
This sort of thing hardly matters for now given that population is still growing most places but it matters a great deal if as I suspect birth rates continue to fall and FALL FASTER than even the more optimistic demographers expect.
Birth control is dirt cheap if it is provided as a public good rather than as a means of the medical establishment getting even richer- and even then it is pretty cheap – only a few hundred bucks a year for an exam and the meds- peanuts compared to the cost of a child.
We seem to be hung up on the idea that women will not reduce their birth rates until THEY ARE EDUCATED and EMPOWERED by education.
There is no doubt a lot of truth in this argument but I suspect it in reality will be bypassed by women in a fashion similar to the fashion in which the telephone industry skipped the land line phase in poor countries and leapfrogged directly to cell phones.
Women who can watch tv and just barely read who have internet access – which is getting to be dirt cheap and will be almost free in most places within a few more years- can see for themselves what having only one or two or NO kids means- less slavery better health no man telling them what to do enough money for a second pair of shoes and a second dress in the case of the truly poor.Food enough for herself.
Women are at least as smart as men and imo on average smarter. They will figure this out- once they see the tv shows- and find ways to have fewer kids even in places controlled by neanderthal men.
If I were a billionaire and inclined to do good for humanity I would finance the invention of a one time birth control pill and have it airdropped with good clear graphic labeling all over the third world so that a woman who found one in her backyard or garden or the field where she works could just swallow it and know she would never have another baby..
The side effects might be serious but unless they were TRULY horrible they would be less troublesome than lifelong poverty and watching her kids either starve or grow up stunted and retarded with no hope of a decent future.
I would go for a one time permanent male pill too but getting men to take it would require some subterfuge or bribery on a substantial scale.
The fall of Japanese house prices is not such a benefit as described. Reality is houses in the last 60 years were not built to last. When you buy a house that constantly depreciates in value there is less interest in maintaining it. What is actually happening in Japan is that young people are inheriting older derelict houses that have no resale value.
Ya don’t sell a house you can live in if it won’t bring good money and rent is sky high. You live in it and quit paying the sky high rent.
The very point is that houses will be CHEAP- as in cheap enough you can afford to work on them as needed and live in them. Houses and apartments are so expensive now in Japan that people with thousands of dollars worth of electronic toys and good jobs are living in what would be considered a closet in other places.
On cheap houses. Big die-off does it too. Survivors will be living in infinite wealth embodied in all the empty- unused stuff lying around. Sure, they don’t know how to fix it, but will quickly find out how to use it, maybe for some entirely different purpose.
Living examples of this in lots of places right now.
Yes, I know, depends on timing of die-off, before or after ruining the world for good and all.
NORENCO (Norwegian Energy Company) is in trouble owing to low oil prices. This company, which holds stakes in a several UK, Norwegian and Danish fields, has reported it needs to convert all of its outstanding bond debt as it was burning through cash and cannot pay interest or service its debt. My impression is escalating Huntington Field costs are a large part of the problem. Huntington Oil Field is located in central North Sea, UK.
Hi all,
Scenario with new wells added falling from 200 new wells/month to 110 new wells/month by June 2015. Real Oil prices rise from $67/b in mid 2015 by 1.2% annually. New well EUR decrease starts in August 2016 and reaches its maximum annual rate of decrease of 3.8% 7 months later. ERR through Dec 2040 is 7 Gb, this is a low price scenario, I expect real oil prices will rise more quickly so that this would be the minimum output expected (unless oil prices remain under $67/barrel for many months.) Real oil Price should be read from right vertical axis.
See
FYI signif surge in oil price last night just after Europe opened, up to $58.xx. A Libyan shut in rumor was floated. (Note the UAE has been bombing Libya for months).
Rumor didn’t hold much water. Oil now $56.22.
“Bombing Libya for months” is a slight exaggeration, unless you’re saying the press isn’t telling us the whole truth: Two bombing raids, both in August, i.e. ages ago. Implying that UAE wants to drive up the oil price by bombing Libya is a bit lame, IMHO.
Mildly agree I’m lame on this. But, it was late August that the story broke, and was alternately denied and confirmed, and the Libyan ambassador didn’t think it was the UAE. As for not telling the whole story, I don’t think it’s covered up, but odds are not bad that it isn’t thought worth mentioning when it happens. When did we last hear about rebels and Tripoli’s airport?
Hey watcher, do you have a thesis you have articulated as to what all you think is going on?
I take it you think that dollar strength triggered a commodity collapse, that went beyond the straight translation impact, but I am not sure I understand what you are getting at besides
Mostly I am constructing a further Apocalypse mechanism.
Supply and demand stuff has always been weak, but it’s so deeply embedded in presumptions of “law” that it’s hard to dislodge.
Again, aircraft flying. You move the stick to the right. The ailerons deflect and the airplane begins to roll. That’s imbalance of laminar fluid flow over the wings. The camber of one wing is increase and it decreases in the other. So the airplane rolls.
But it doesn’t just stop rolling at some point determined by how far to the right or left you moved the stick. It will keep rolling until you neutralize stick/camber. Maybe you neutralize at 20 degrees roll. Maybe 45 degrees roll. But only when the stick neutralizes. You can’t get back to zero degrees roll unless you reverse the stick to the other direction.
If you had a supply/demand imbalance, the price doesn’t just go to some new level appropriate to that level of imbalance. It will keep rising or lowering until the imbalance is neutralized.
Well, we’re pretty sure oil output is going to fall from this price crater. So there is a presumption of neutralization and maybe the stick will move past neutral and the roll will try to return to 0 degrees ($100), to be magically neutralized there.
But. A huge GDP influence from shale (and even conventional) could smash demand as well as production. We thus lose force on the stick that might try to create imbalance in the other direction.
That would be a death spiral, lowered demand lowering price further, destroying even more industry. And the Fed, in its wisdom, has leveraged the whole process to amplify it.
Oh and further concerning the “magic” nature of this whole supposed supply/demand process . . . .
One of the other commenters above somewhere makes the excellent point that there ain’t much above ground storage. If you have supply/demand imbalance such that supply outstrips supply, where can you put it?
You can’t. There’s no place. And thus . . . it ain’t a law.
sigh outstrips demand
You are losing it Watcher.
If supply is outrunning demand then the price will be falling- and it is. And if the amount of oil being sold to end users – after it is processed and shipped of course- is less than the amount being produced inventories start piling up and backing up even as prices are falling.
Demand and supply are in APPROXIMATE BALANCE with the price at any given time. If demand is stronger than supply the price starts creeping up and inventories start shrinking and ( hopefully or not depending on your pov) the oil field owners start shipping more.
If supply stronger than demand then prices are falling and or inventories are growing.
Pretty soon the retailers cut back on deliveries and the wholesalers cut back their orders from refiners and refiners cut back on deliveries from oil field owners.
Demand, supply, and price engage in a never ending three cornered dance around a central balancing point like bugs going around a light. Given that it takes a few weeks or months for oil to move from oil field to pipeline to tanker to refinery to tank farm to retailer or end user the process is sort of slow and ponderous like elephants dancing.
I f falling prices don’t encourage enough ADDITIONAL consumption with supply holding steady then inventories WILL BUILD to the limits of storage and the producers WILL NECESSARILY start shipping LESS oil.
They DO NOT HAVE TO HAVE STORAGE FACILITIES. They can just leave it in the ground.
You don’t have to put it anywhere at all . You just leave it where it is.
Supply and demand can be manipulated to some extent it is true. Easy credit stimulates demand by encouraging people to go into debt. High taxes on producers discourage production it is true.
But supply and demand are about as close to physical laws as anything involving human behavior.
I cannot think of a single case when supply and demand don’t rule- although this might be a copout given that demand can be LEGISLATED as for instance by passing a law you MUST have smoke detectors.
Supply can also be legislated to some extent by requiring the provision of certain services or goods…such as ” compliance cars” in California.
Or supply can be eliminated by taxing it excessively or outlawing it.
But this is still supply and demand -just supply and demand arising from different sources.
What happened to cause the drop in oil prices?
How Low Can Oil Go?
So what happened? At the most basic level, it’s a simple supply-and-demand story. Europe’s continued troubles and a slowdown in the Chinese economy muted the demand for oil. Meanwhile, the U.S. shale-oil boom and a rebound of drilling in Libya boosted supply. “Libya’s ramping up of production caught people genuinely off guard,” Steven Kopits, the managing director of Princeton Energy Advisors, told me. “That’s the kind of thing that’s hard to predict unless you have really good intelligence assets on the ground.” The result was that the market was producing many more barrels of oil a day than were consumed. As oil was dumped on the market, prices inevitably fell.
That’s it in a nutshell folks. That is the whole story of the crash in oil prices.
Really?
Except Libya output over this period of months (from your charts) is at no time even equal to 2013, when oil was north of $100. And btw, ditto 2012. There’s been GDP growth since 2012, yes? So Libya has been facing more demand as it pumps less.
So the price went up . . . .
Hmmm, and Libya output per your charts Oct to Nov is down a ton.
The price is, too.
I do think some bombing of Libyan ports would do the trick, tho. Who would complain?
Yes Really! And Libyan production, June to October was up 655,000 barrels per day, though they were down 249,000 barrels in November. 2013 hasn’t a damn thing to do with it, it’s what is happening at the moment that matters. GDP growth? Yes there has been GDP growth in the US but we are talking about the world. Too many people look at what’s happening in the US and think that they are looking at the world.
Watcher why do you have to micro-analyze everything? I found nothing in Kopits’ statement to argue with. Here is the thrust of his statement:
Europe’s continued troubles and a slowdown in the Chinese economy muted the demand for oil. Meanwhile, the U.S. shale-oil boom and a rebound of drilling in Libya boosted supply.
That happened! That was enough. And you brought up GDP growth in 2012 and 2013? Where? WTF?
China logs 7% GDP pretty much yearly. They are buying 24 million cars this year. What slowdown? Europe has been a basket case for years. Nothing special about June for their basket caseism.
If you see supply demand imbalance, where was it in 2013 when production was higher than now? Or 2012? With lower GDP, aka consumption. This alleged imbalance would have been more profound then. But . . . no price decline then.
The theory, or law, is weak.
If you see supply demand imbalance, where was it in 2013 when production was higher than now? Or 2012?
Now I understand why you question the price collapse. You have no idea what oil production was in 2012 or 2013. You think it was higher then than now.
Yes it was a supply-demand imbalance that caused the price collapse. How do I know that? I know that because there is nothing else that can possibly cause a long term price change. (Long term is anything longer than a week or so.)
I suppose you think it was speculators that is causing it. I say is causing because whatever caused it is still happening else the price would rebound to it’s previous supply-demand level.
But I would just love to hear what you think is causing this crude oil price decline.
Nope was just talking about Libya, which was . . . all WE were talking about. haha Though as soon as I hit return and read that I KNEW the word production without Libya in front of it would let you do that. Oh well. hahah
My little aileron analogy above does describe the first derivative reate of change of imbalance thing, but at this point we’re looking at logistical market mechanisms like stop hunting that is dictating things even more than the dollar’s influence. As opposed to Supply/Demand.
Neutralizing the stick in the cockpit right about here for a year or two would condemn the shale industry to death.
So Ron,
Is it fair to say that if 1 million barrels of supply drops out, the price goes back to $100.00?
I.e. am I being too simplistic by suggesting this?
If one million barrels per day dropped out there is little doubt that the price would increase, just how much I haven’t a clue. But….
The primary reason the price dropped was a drop in demand, not an increase in supply. Demand dropped because the price was higher than people could afford to pay. Therefore it is unlikely that oil would go that high if only 1 million barrels dropped off supply.
btw if there’s an imbalance of 250K bpd since June, that adds up to 40 million barrels. Where is it?
Francisco Blanch from BOA commodities research, has been quoted as saying that a 1 % drop in oil production, would require a 10% price increase, in order to quash that much demand.
China logs 7% GDP pretty much yearly. They are buying 24 million cars this year. What slowdown?
If you really believe that China continues to grow it’s economy at 7% per year and that it will continue to do so well into the future, than I have this really nice bridge in Brooklyn NY, that I’d like to sell you!
The theory, or law, is weak.
Nope, what’s weak is your grasp of the consequences of the exponential function! There is no way in hell that China can continue to double its economy every decade without self destructing and taking the rest of the planet down with it.
BTW I’m down in Brazil at the moment and I went to see with my own eyes the empty reservoir system on which 20 plus million Paulistas depend for their drinking water.
This is a very tiny interconnected planet we all live on!
May I suggest you go read: 40 years ‘Limits to Growth’
http://www.clubofrome.org/?p=326
Cheers!
Tim Morgan wrote a good paper on energy a few years ago, as a finance writer. I believe it was entitled “Perfect Storm”. Original, I know! lol
He now has a blog, and has offered an opinion about the present situation. His perspective might be described as thermodynamic analysis. I believe he makes some good points.
http://surplusenergyeconomics.wordpress.com/2014/12/15/42-the-petroleum-switchback/
http://finance.yahoo.com/echarts?s=HYG+Interactive#
This is fairly grim stuff and points a bit more pointedly each day at bailout.
This is the ETF (exchange traded fund) of High Yield bonds. An index of sorts of such. It’s cratering. Look at the graph since Nov. This bespeaks default fears, not to mention swap fears.
BTW, the carnage goes on. $55.40.
Equity carnage as well. I can understand that Russia is imploding. But why UK, Eurozone, Thailand? Today apparently everyone is worried about “lack of demand” again…
Bullard jawboned equities in mid October. It was good for 15%. End of Year declines are a huge threat to pension funds. The FOMC meets tomorrow and Wed so there will be something in the language for algorithms to feast on.
Old hands digging in:
http://www.bloomberg.com/news/2014-12-15/oil-bust-veterans-brace-while-shale-boom-newbies-swagger.html
Nemesis may well be winging its way to a Mr John Ollech…..
“Can we double again next year or are we only going to grow 60 percent?” asks a nonchalant John Ollech, president and chief executive officer of B&G Oilfield Services, which monitors and maintains oil wells and pipelines.
Housed in a warehouse-type building about the size of an airplane hangar, B&G has roughly doubled in size each of the last two years since being acquired in 2012 by private equity firm One Eighty Capital LLC.
“It’s still all good. We’re not contemplating any doom and gloom,” says Ollech, whose biggest worry is finding enough skilled and reliable workers. None of his employees have asked him about the effects of oil’s fall, but he brought it up anyway at a recent safety meeting. He told his staff that they can’t control crude prices and that they only need to worry about doing their jobs well. ”
haha
You can’t control oil prices. But you can control whether you endure -20 degrees just so you can be fired in mid January. Or there’s shorting your company’s stock. Or violence.
There are lotsa options other than just doing your job well.
The last time I had to consider layoffs I got the staff together, told them things would work well. Everybody had to work as hard as possible, the hardest workers would be kept, but those hard workers who had to be let go would be getting my recommendations to get work anywhere else they mentioned. I also told them if anybody wanted to leave before we had the cut to let me know, so I could help them with a nice layoff package, and then they could transition into their new jobs. Believe it or not the speech worked real good. It was really painless.
““Can we double again next year or are we only going to grow 60 percent?” asks a nonchalant John Ollech,”
the guy is just following standard script .
grow 100% or 60% or whatever %…it’s kind like “we are running out of land” in 2007 at the top of RE.
or the old forgotten one from Dot com “Build it and they will come” LOL
Dude, those guys are into well and flowline maintenance. He may have to cut his prices 10 %. But he’s going to get more experienced hands (because he isn’t growing). Overall his profits should be fine if he knows the business. O&M isn’t drlling and completion.
in 1-2 years there would be nothing to maintain. shale oil is boondoggle.
What we see is a tragedy in the making. From a distance it is very interesting to look at. In a couple of years, when another writers takes the John Steinbeck route again, he has a chapter to write about this boom-bust cycle. And that’s it.
Good Day
Just a few photos I posted to the site, its interesting to be here in ND and watch this play out.
Their is a whole lot of pain underway.
http://bakkenboomorbust.com/bakkenboomgonebustphotos
Good story in the Star Tribune.
http://www.startribune.com/business/285687401.html
“Helms, whose agency regulates the oil industry, said he expects the 183 current drilling rigs to be down by 40 to 50 rigs by mid-2015. “That means it will be a month-to-month struggle to see production increases — if they come at all,” Helms said.”
The sentiment of most folks here seem to think that things will really pick up after the holidays,
now what holiday or what year that will be is beyond me. Those who understand reality see this already
slamming on the brakes, spoke with senior railroad engineer who stated oil shipments have and or are slowing down, spoke to truck owner operator who hauls sand for fracking who stated the last three weeks have been the slowest he has ever had up here, was pulling out to go home to Nebraska. Made the round on Saturday to Williston, Watford City, Newtown. Seemed really dead to slow for traffic and traffic at local stores. Noticed several apartment projects in Watford City with no work being done on a day when it was 40 some degree’s out. Bakken oil closed on Plain’s bulletin today at $39.69. Down some 50 dollars for the year.
Interesting comment, thanks. What does “Bakken oil closed on Plain’s bulletin today at $39.69.” mean exactly?
The price of Bakken sweet is -16 wrt WTI. Substantial discount. You can see it quoted in the Director’s Cut, too.
This is the most interesting part of the comment:
spoke to truck owner operator who hauls sand for fracking who stated the last three weeks have been the slowest he has ever had up here, was pulling out to go home to Nebraska.
I posted several days ago that frac’ing likely slows to a crawl in the winter of ND because of cold water and the inability for gel polymers to work properly. For this fella, there is no sand to haul this time of year so he went home for Christmas. That is all it means.
Watcher you need to drop what you are doing (its OK, take your computer with you if you have to) and go straight to a clinic and get a shot for those ha ha’s you’ve got. You need to get that cured, pronto. The ha ha’s can turn in to the everything-is-bad-and-getting-worse cynical’s, then you’ve got a real problem. People with advanced stages of the cynical’s do nothing but blog all day long.
Hard working men and women in the oilfield are very, very worried right now. Christmas might not be too good for them. They don’t want to go running home to mama because its cold in N. Dakota, nor do they think if they might get fired in January, they may as well quit now. Who thinks like that when they have a family to take care of !?!! They don’t know how to “short” their own company, and they were not lied to about oil prices or job security. They need to work.
Show some compassion. And go get that stuff looked at as soon as possible.
Mike
What’s the stock symbol for Compassion. Does it have good earnings prospects? Do they do share buybacks?
btw why weren’t those jobs automated away?
spoke to truck owner operator who hauls sand for fracking who stated the last three weeks have been the slowest he has ever had up here, was pulling out to go home to Nebraska.
Does this mean that fracking is slowing down? Drilling seems to be holding up pretty good but wells waiting to be fracked increased by 40 in October, from 610 to 650. This just don’t seem to make a lot of sense.
I won’t claim it does make sense, but it is the frack step that costs big money, beyond just sand cost and frack pump rental. It means you are committed to everything else.
And Mike has said money gets paid up front for things. If the HY people have already closed the money spigot, there is none for the fracking step. The rig may have been pre-committed, but sand would be just-in-time inventory stuff. Prepaid. And if not, no sand.
Why frack the well and produce the flush production below $40? Why not wait and see if things on price turn around, maybe wait till spring when conditions aren’t so harsh? Assume there is nothing which prohibits this.
On the other hand, if you are hedged wouldn’t think one would wait?
They ain’t hedged. If they were hedged, they’d be celebrating the crash. If you’re hedged thoroughly, you’re a commodities trader, not an oil company.
Lotsa lying going on.
It might make sense if the drilling rig contracts are longer term than the sand hauling contracts. I think someone was claiming in the last thread that drilling can’t just stop for contractual reasons.
Plain’s Is a Oil Broker Buyer, they issue a daily bulletin on what they are paying for oil in any given region, based on gravity and sweet or sour, Lynn Helms uses Flint hills for his daily oil prices.
I beleive Plains to be the largest in the USA, I know in 2013 they has a standing order for 55 million bbls in the Bakken. Their is also the Bridger Group, they do not publish a bulletin.
Flint Hills was offering $37.75 for sweet bakken oil.
http://www.paalp.com/fw/main/default.asp?DocID=1363
http://www.fhr.com/refining/bulletins.aspx
Excellent, thanks again. This will be useful to all of us in the future, or rather, to those of us who didn’t already know this of course.
It does and doesn’t make alot of sense, maybe it comes down to beggars and choosers, the frack guy begging to frack your well and the driller you hired and or leased with, you have no choice but to finish that contract.
I have noticed in the past two months that drill rigs I have been watching have stayed on drill location alot longer then usual, even in single well pad applications. Helms has stated in his rhetoric that alot of these drill rig leases don’t expire until 2015 and first quarter of 2015. I also have had the experience where a E&P had fracked a well and came back to produce it sometime later and it was a horror story, no pressure left in the well. Actually several wells. I have not seen any drill rigs stacked, but I doubt they would put them where the motoring public would see them. Pretty difficult to hide all those water trailers. The legislature meets next month, and they are in for a shock. Electrocution type shock.
“I also have had the experience where a E&P had fracked a well and came back to produce it sometime later and it was a horror story, no pressure left in the well. Actually several wells.”
That’s worthy of flashing lights and sirens. Heads up, guys. The pressure leaks away from the wellbore over time, even if oil don’t flow. Now THAT is significant. That’s lifting expense.
Hm. Explain no pressure left in the well. Before I tell you how I don’t think that is possible I’d like to hear your explanation on how this happens, maybe there is some outside influence you did not mention.
Why is it too expensive to drill for oil in the Bakken but not too expensive to spend three or four trillion dollars on military skirmishes in Iraq and Afghanistan? Sorry to ask.
Something stinks to high heaven and it ain’t a dead skunk in the middle of the road.
Oh for God’s sake, get real. The money spent on drilling is spent by drillers and oil companies and the money spent in Iraq and Afghanistan is spent by the government. You are not just talking apples an orange, you are talking apples an horse turds.
I would have thought that you were aware of those facts.
Maybe it is a conflation, so be it. I’m comparing apples to road apples, one apple is worth the effort, the other is a pile of excrement.
You make a good point Ron…
What better purposes could we have spent that money on?
http://www.huffingtonpost.com/2008/10/27/what-we-could-have-spent_n_138410.html
I looked for a bit to see if I could find out how much the U.S has spent on the ‘war on terror’ since September 11, 2001…I dunno..maybe between $1.5T and $3.0T?
I will leave it as an exercise to the readers to try to figure out what better purposes this money could have been used for. The article I linked was a very weal attempt to show other things the $$$ could have been used for…
Money is money, resources are resources…how we use them is our choice…we make our choices as a society and them have to live with the consequences.
“I posted several days ago that frac’ing likely slows to a crawl in the winter of ND because of cold water and the inability for gel polymers to work properly. For this fella, there is no sand to haul this time of year so he went home for Christmas. That is all it means.”
In response to this statement, the water has to and is heated during the frack, it was my experience it was somewhere in the 90 degree’s when fracking, it has not been that cold here. Roads are good, western part of the state has little to no snow cover. Water is always cold coming out of the ground, it has to be heated for fracking no matter what time of the year it is. Heating trucks are on sight to heat it, big heating truck’s.
Trailers with roper pumps, you would antifreeze the pump after loading and unloading. Vac trailers, they like to freeze the valve during the transit. Portable trailers they like to freeze the valves.
When the fracker and the water handler and the trucking company coordinate it all goes pretty good in the winter time.
This guy has some great photos of fracking in hell in the winter.
http://livefromthebakken.com/
From that link:
“This operator said he used 18,000 gallons of recycled oil to heat the water for one well.”
Gotta mean just recirculated what came up, using its temp to heat water. The oil wasn’t burned in that amount to heat water. Hmm.
A BTU is the amount of energy reqd to raise one pound of water 1 degree F. Threeish million gallons, 8 pounds per gallon, 24 million pounds. Gotta raise it what, call it 40 degs? Maybe more but we’ll start with that. 960 million BTUs.
5.6 million BTUs per barrel of oil. 18000 gallons is 428 barrels, if you burn ’em. 428 X 5.6 million is 2.4 billion BTUs — so ya, those 18000 gallons are just circulated to extract their heat coming up and use it to heat the water. They weren’t burning 428 barrels of oil just to heat water.
Wait that’s complete crap. This is recycled oil. Not from the well bore because it’s not flowing yet . . . unless they get it from the vertical bore pre frack?
How can that make sense? 18000 gallons of oil to heat water? How?
I’m in Bakken as an MWD hand too new and unconnected to say much. Know several hands who pre-emptively left in preparation for the bust, know many people are tense and expecting a slowdown but most seem to be way overly optimistic that it won’t hit 2009 levels. Believe i overhead CLR is going to be at 6 rigs next year. I think most telling though is that Lynn Helms says he thinks it’ll be done to 40–50 rigs next year http://www.startribune.com/business/285687401.html
As for me i’m under no illusion i’ll be working in the fields after the start of the year, go my backup lined up.
Must be bogus info. I do know there are a couple of power plants nearby in Beluah that sell heated freshwater using waste heat as an energy source. Not certain how much of the field gets their heated frac water that way though.
FWIW: Waste\recycled Oil is usually from spent used motor oil, Hydrolic oil or cutting oil using for machining metal. Spent oil is not fit for refining or reuse for lubrication because its containmated. Its typically burned as a heat source.
http://en.wikipedia.org/wiki/Waste_oil
Thanks for the info. It takes at least that water temp for cross linking; it must add a lot to costs to heat the water and keep it heated when it is zero degrees outside, which I assume you will have plenty of over the next 3 months. Frac water does not typically need to be heated in Texas as it comes out of big retention ponds, not straight out of the ground. The primary groundwater source is 120 degrees BHT down here and sits in the 100 degree sun most of the year.
Speculating about this and that up in the Bakken is like a Super Mario game for some folks around here. Whatever you can say to keep it real would be great. I for one will listen and learn.
Mike
Tfark45. Thank you for the on site information you provide. I wish there was more info on what the mood is in the Bakken. Or maybe I’m just not looking in the right places.
Shallow, I just finished my last well for 2014 and had some EF service people out to do this and do that, a big cementer, for one. Down here in Texas it is bleak looking; lots of guys already getting told about rigs stacking. Having people call me looking for work, believe it or not. That has not happened in a long time. I think after the first of the year the ca ca is going to hit the windmill.
Mike
Some layoffs already here in our little corner too. No shale here and not a lot of debt but higher LOE. Guys in field here who didn’t follow price much now looking at it daily or more, or refuse to at all, bad luck. Most pretty worried here. Made it through 2008-2009 unscathed. Concerned more like 1986 or 1998, will last longer. No drilling at all now after most active summer in 30+ years.
I’m in Bakken as an MWD hand too new and unconnected to say much. Know several hands who pre-emptively left in preparation for the bust, know many people are tense and expecting a slowdown but most seem to be way overly optimistic that it won’t hit 2009 levels. Believe i overhead CLR is going to be at 6 rigs next year. I think most telling though is that Lynn Helms says he thinks it’ll be done to 40–50 rigs next year http://www.startribune.com/business/285687401.html
As for me i’m under no illusion i’ll be working in the fields after the start of the year, go my backup lined up.
Hey thank you, I try and look at the reality, and numbers of the play’s and all that goes with it. To gauge the mood, that is highly biased by hype. Everyone believes this will go on for 40 year’s. Even Helm’s is still hyping 63000 well’s. Minus the 11892 in production is 51108 to drill out. that is $511080000000 – a half trillion without interest or inflation.
http://bakkenboomorbust.com/
Hey, thank you Mike. It is a different world here in the cold month’s. Their are some good men and women who work in this industry. Working with crude oil, that’s a different story, it’s usually warm and or hot.
Most e&p’s live fracked where the water was being tucked in as they pumped. Using a small amount of portable trailer’s. I think that’s why Power Fuel’s has all those trailer’s in his yard.
He bet on a different process.
Interesting story published today about that company.
http://seekingalpha.com/article/2754785-nuverra-bonds-say-broke-stock-clinging-to-hope
These are sad stories from that company. Cost these men their lives.
http://www.eenews.net/stories/1060009722
http://bismarcktribune.com/news/state-and-regional/oilfield-worker-killed-near-williston/article_52c4f8be-ebae-11e0-9aae-001cc4c002e0.html
Way to many lives being lost in the bakken, they said tonight 20 deaths alone in one month in McKenzie county on highway 85, all occurring at the same few intersections.
T, same down here in the EF, 1-2 vacuum truck drivers a week on one highway between Dilley and Carrizo Springs. I drove it the other day, its a major highway totally destroyed by oilfield traffic. Its like driving your pickup on the open sea, down in a trough you can’t see the truck coming at you until you crest the peak, then down again. Rig safety has gotten really better, however. Safety this and safety that, its good. Every now and then some hand will have a brain fart but that’s the oilfield. I got a buddy who is a drilling consultant for one of the big 4 and he called the other day to say they had their first accident in 7 months when a floor hand slipped on a peanut butter sandwich in the dog house and broke his arm, hee hee.
You guys are tough up there. My hard hat is off to you. I feel bad for everyone up there right now; things are looking pretty skinny going forward. I hate that.
Stay with us here. Thanks.
Mike
Read this a while back and I seem to find myself often thinking about the one that there was no longer room for.
What the endangered Great Bear Rainforest has to teach us
Wolves, salmon and bears can teach us about self-sacrifice and ecology
Nancy Macdonald, McCleans, November 15, 2014
Wolves are followers of Ayn Rand? Cool (or not as the case may be)!
Who knew?
Wolves are followers of Ayn Rand?
Not really, they just have an innate grasp of resources limits and population dynamics and are really followers of Charles Darwin >;-)
http://seekingalpha.com/news/2179645-canadian-heavy-oil-drops-below-us-40-as-output-surges
Investor/commentator RS055 Echo’s this post comments/summarizes realities Oil Sands vs Shale. !!
”
The shale guys – drill wells with an economic useful life of about 2 years. They are on a treadmill, Red Queen style. If they are truly financed on a perwell, 2 year basis , I suppose it would be OK – but they dont. They have created longer term financing that relies on continuous access to the debt markets to refinance old debt. The business model is not robust to shocks – of the kind we are living through. Unfortunately US shale has been about the only growing source of supply in the world. Most other sources are in decline.
So – if a large swath of this unstable shale business model is upended by this shock – we are talking about 4mm bbls/day of supply that is at risk.
is it just a coincidence. or is shale oil the ill-begotten child of Mr. Bernanke’s mad-scientist experiment? “
And by the same logic, if supply drops off, then the prices will increase until the shale producers are profitable again. The oil will be sitting there waiting for them, just like the 1.8 trillion barrels in Canada’s tar sands.
This is true. However, I think there’s a bit less turbulence financially speaking in the oilsands. The construction crews still get the topsy turvy world, but once a mine is up and running, I don’t think they shut those things down for anything. Projects do get put on hold pending better financials (that happens all the time) but there’s still billions upon billions of dollars of projects lined up to get done (at one point in the last 5 – 10 years, 250 billion dollars worth of projects. Some put on hold, some put back on the burner, and now a bunch will be put on hold again, but they will probably go ahead as long as long term (i.e. 20 – 30 year money) can be sourced to fund these things).
It seems like shale oil might dry up and blow away in 2 years. That probably won’t happen to the oilsands (at least not all of the oilsands anyways). But I’m quite open to being proven very very wrong on this point.
That said, I’m quite sure that these oil production levels won’t survive these low prices for long. Some producers on the private side will simply go out of business and that will eventually kill off the excess production. How many such businesses need to go, I have no idea. Hell, maybe Venezuala will go under instead.
Really, if we wanted to fix this without economic pain, we’d pull out of Iraq and let ISIS run amok, let Libya fall into total chaos and otherwise let the security situation threaten or destroy supply and sit back and reap the riches. I guess since we’re not doing that (we being the West), I guess we strangely seem to care about something other than money. Imagine that!
John B wrote:
“And by the same logic, if supply drops off, then the prices will increase until the shale producers are profitable again. The oil will be sitting there waiting for them, just like the 1.8 trillion barrels in Canada’s tar sands.”
Not necessarily. Lots of investors invested heavily in the shale boom. When they loose their shirts they will be extremely reluctant to jump back in. Without investors to finance shale drilling, the oil is likely to sit there indefinitely.
FWIW: Bubbles are typically once in a generation shot. It takes the previous generations to die off and the people to forget the folly before the next group jumps back in. Unless the gov’t starts nationalizing the Oil industry, Shale drilling is probably a one-shot deal.
Perhaps if there is some sort of crisis soon, ie Israel attacks Iran this Winter and causes Oil prices to spike back, then Shale drilling will get a temporarily extension. That said, the Red Queen will eventually kill it for good.
OT: An colleague of mine invested heavily in the Shale drillers against my recommendations. Now he’s panicking trying to sell it all. He reminds me of the Duke Brothers in the Movie “Trading Places” Mortimer: Sell, Sell, Sell… Turn those machines back on!