The North Dakota Industrial Commission has released the Bakken and North Dakota monthly production numbers for December 2014. There was a bit of a surprise as Bakken and all North Dakota production was up just over 39,000 barres per day.
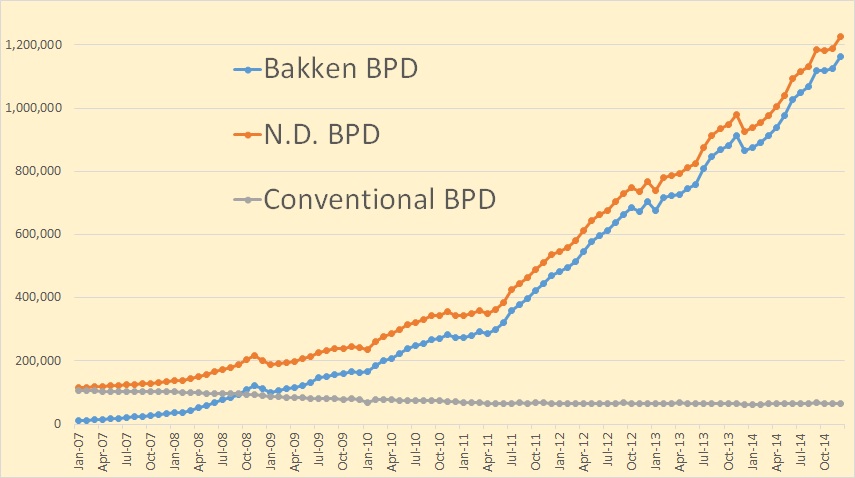
Since Bakken production was up at almost the exact same amount as the rest of North Dakota, (Bakken up 39,080 kbd vs. 39,086 bpd for ND), suggest that all the wells being brought on line are Bakken and Three Forks rather than conventional wells.
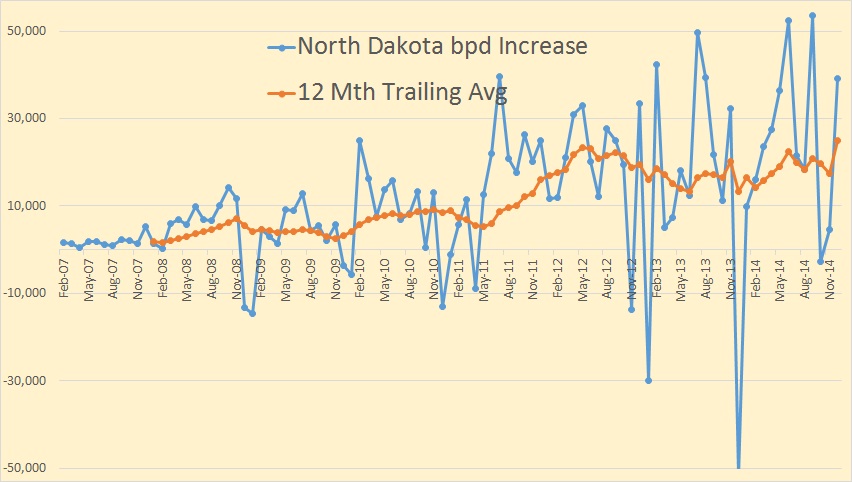
The North Dakota change per month, 12 month trailing average reached a new high in December of 25,006 barrels per day. That means North Dakota oil production was up an average of 25 thousand barrels per day every month in 2014.
From the Director’s Cut:
Nov Oil 35,647,735 barrels = 1,188,258 barrels/day
Dec Oil 38,047,667 barrels = 1,227,344 barrels/day (preliminary)(NEW all-time high)
1,163,352 barrels per day or 95% from Bakken and Three Forks
63,992 barrels per day or 5% from legacy conventional pools
Nov Producing Wells = 11,951
Dec Producing Wells = 12,124 (preliminary)(NEW all-time high)
8,826 wells or 73% are now unconventional Bakken – Three forks wells
3,298 wells or 27% produce from legacy conventional pools
Nov Sweet Crude Price = $60.61/barrel
Dec Sweet Crude Price = $40.74/barrel
Jan Sweet Crude Price = $31.41/barrel
Today Sweet Crude Price = $34.50/barrel (lowest since February 2009) (all-time high was $136.29 7/3/2008)
Nov rig count 188
Dec rig count 181
Jan rig count 160
Today’s rig count is 137 (lowest since July 2010)(all-time high was 218 on 5/29/2012)
The statewide rig count is down 37% from the high and in the five most active counties rig count is down as follows:
Divide -62% (high was 3/2013)
Dunn -45% (high was 6/2012)
McKenzie -28% (high was 1/2014)
Mountrail -41% (high was 6/2011)
Williams -40% (high was 10/2014)
The drilling rig count dropped 7 from November to December, 21 more from December to January, and has since fallen 23 more from January to today. The number of well completions increased from 48(final) in November to 173(preliminary) in December. Oilprice is by far the biggest driver behind the slow-down, with operators reporting postponed completion work to avoid high initial oil production at very low prices and to achieve NDIC gas capture goals. There were no major precipitation events, only 3 days with wind speeds in excess of 35 mph (too high for completion work), and 2 days with temperatures below -10F.
Completions outpaced drilling in December. At the end of December there were an estimated 750 wells1 waiting on completion services, a decrease of 25.
Rig count in the Williston Basin has fallen rapidly. Utilization rate for rigs capable of 20,000+ feet is about 70%, and for shallow well rigs (7,000 feet or less) less than 50%.
The North Dakota rig count stands today at 137 with the next location listed as “to be stacked” number at 7. Of course many of those listed as “Undetermined” are likely to be stacked as well.
Helms did not mention the number of wells completed, only that they outnumbered drilling by 25. However the number of wells producing in the Bakken increased by 209 while the total number of North Dakota wells increased by only 166. This means that at least 43 conventional wells had to be shut down.
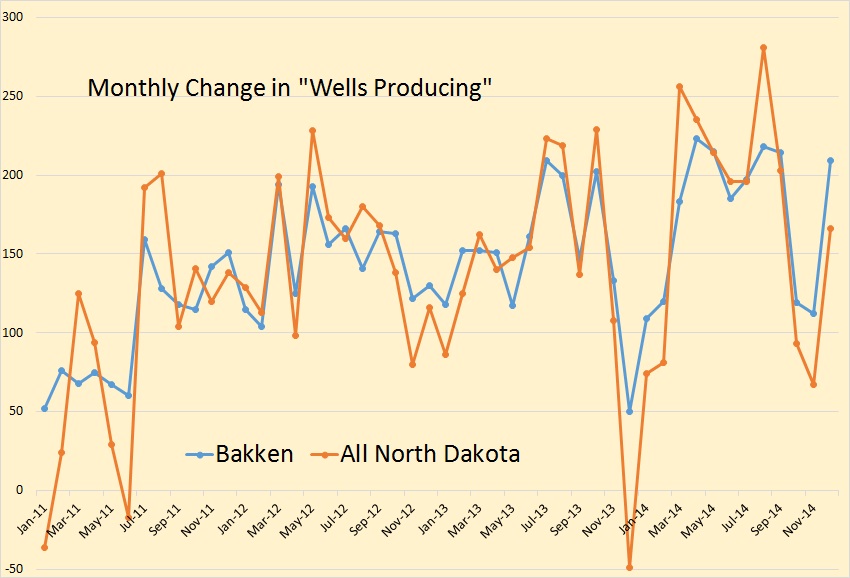
An increase in 209 wells producing in the Bakken is a near all time high. With 750 wells awaiting completion it now all depends on fracking crews.
On another subject, I found the following chart interesting. The Data is from the EIA and is the average for all the US.
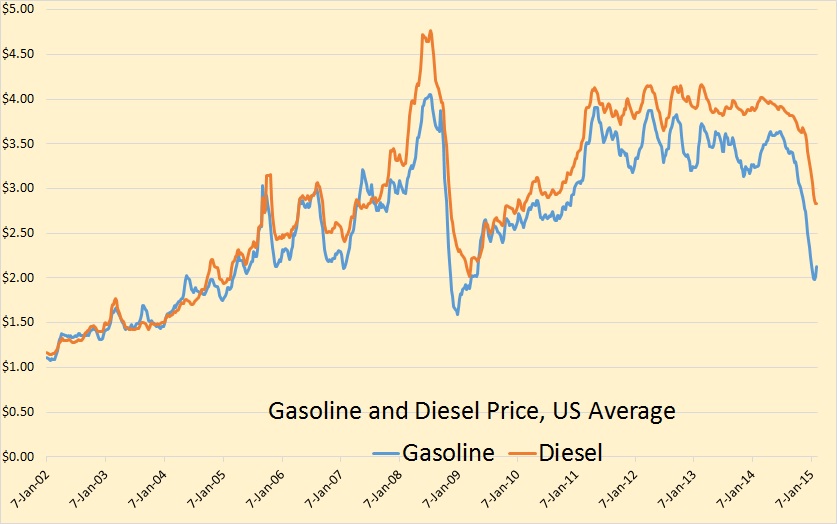
Why is diesel prices outpacing gasoline prices?
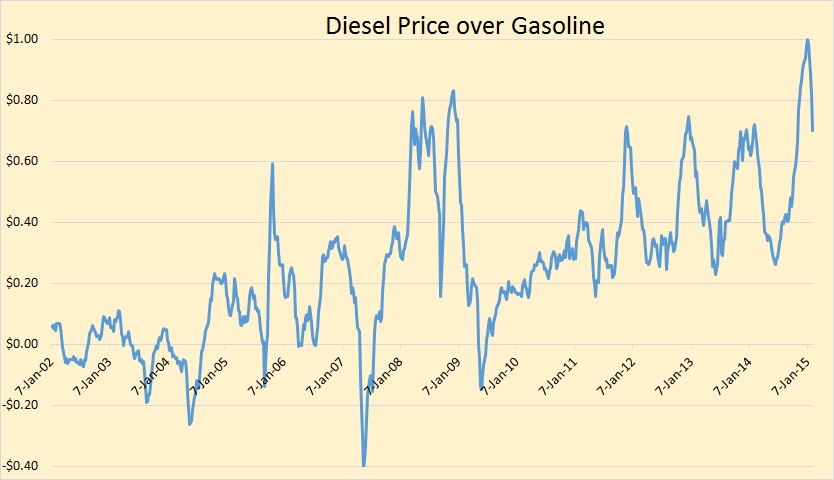
Beginning in 2004 diesel prices started outpacing gasoline prices. As late as June 2009 there was a short period where gasoline prices were higher than diesel but then diesel prices started to climb and has been well above gasoline prices for over 5 years now. Why? Is is because of more demand or is it because there is less diesel in the lighter crudes being produced in the US?
And one last point on another subject. About a couple of weeks or so ago there was a guest essay by Tom Giesen attached to one of my posts. It was on the problems of fracking. One commenter who goes by the handle “Clueless” asked me if I was a member of that cult. I replied with a somewhat ambiguous answer that I now wish I could change. I would change it because I wuz wrong! Now I neither a friend nor foe of fracking, but the process should stand or fall on its own merits an the public should not be mislead by a lies an half truths.
Several months ago I watched the documentary Gasland and was highly impressed. But a couple of days ago I was browsing Netflix documentaries and came upon a documentary called “Fracknation”. It was a critical examination of “Gasland”. I was shocked! Gasland was so full of lies and half truths it is alarming. For instance those flaming water faucets. It turns out that they have been doing that for ever since running water in those places. And it does it in places where there is no gas frcking for many miles. It is just methane in the same area as the water table.
Josh Fox, the producer of Gasland, said a shale well can be fracked up to 18 times. and each frack takes 1 to 7 million gallons of water. Then he stated there are 450,000 fracked gas wells in the US so 7 million barrels times 18 fracks comes to about 40 trillion gallons of water. Obviously he was confused between “fracked stages” and “fracked wells”. And apparently someone informed him of his stupid error because that segment has been removed from the Youtube version but still remains in the Netflix version.
Fracknation is not available on Youtube but is on Netflix. Another expose’a of Gasland, that can be found on Youtube is Truthland. It is a shorter video, 35 minutes. It is good but not quite as good as Fracknation. Here is a short video of how Fracknation got started: FrackNation the documentary that exposes Joshua Fox as a liar?
_________________________________________________________
Note: If you would like to receive an email notice when I publish a new post, then email me at DarwinianOne@gmail.com
Ron, What are the chances that both those movies are sensationalized and not very factual? The real risks and benefits of fracking are what they are. Folks in the rest of the world know that producing energy might create a little pollution. Some of the folks in this country just aren’t used to it.
Donn, Fracknation and Truthland are not documentaries trying to make a case for fracking. They both are to examine the case made by Gasland. Either the facts are as Gasland stated or they are not.
Example. The flaming faucets. Either the gas was coming from natural sources and was there long before the fracked wells or it was not, meaning it was coming from ruptures in the well casing.
The flaming faucets are there so one is truth and one is a lie. They both cannot be a lie.
Even though I believe Giesen was wrong, I was out of line asking you if you were a member of a cult. Sorry.
And I was wrong in giving you such a silly and ambiguous answer. Sorry.
Heard on radio rig count drop was big again. However, appears Bakken rig losses may be slowing and that most rig losses are in Permian Basin?
Hi Ron,
If you count up the number of Bakken wells that started producing in Nov 2014 and assume 95% of the confidential wells that started producing in Nov are also Bakken wells (Helms has been saying for 12 months that 95% of drilling targets the Bakken Three Forks), then there were about 174 wells completed in November. I think Helms estimate is incorrect for well completions in November.
Also there may have been a few non-Bakken/Three Forks wells brought online, but additional output from those wells may have just balanced the decline in the legacy wells.
Even with the falling number of rigs, with 750 wells waiting on completion it will take a long time until the new wells per month falls below 130, even if only 75 new wells are drilled per month it would be 13 months before the backlog of wells waiting on completion was down to zero. At 130 new wells per month output will be relatively flat, with maybe a little decline in output (5 kb/d or less). The model below assumes new wells per month decrease by 8 per month until May and by 3 in June to reach 130 new wells per month and then remain at that level until Jan 2017.
I noticed that the model is falling behind the data for May 2014 to Dec 2014 so I tweaked the average well profile from April to Dec 2014 with an increase of 2.5% each month to attempt to get a better match with NDIC output data. If the average well profile in fact increased through Dec 2014 and we assume the well profile is unchanged from Jan 2015 to Jan 2017, then only 120 new wells per month is enough to keep output from falling by more than 8 kb/d (output falls a little and then rises). New wells per month decrease by 7 or 8 wells per month from Jan 2015 to July 2015. Chart below.
Hi Ron,
I misspoke on the average new well EUR from Jan 2015 to Jan 2017.
Earlier I said it was fixed, in fact in both models EUR decreases from June 2015 at a gradually increasing rate of decrease reaching a maximum annual rate of decrease in June 2016 at 7.5% per year. Chart below is the EUR(kb) of the average new well over time for the model above, with annual rate of decrease of new well EUR on right axis.
Dennis, I am posting my reply below in order to get a wider format for my graph.
FWIW: I suspect one key issue with fracking is what drillers do with the contaminated effluent. I believe most of the it is is dumped to the ground water, since hauling it off site for proper disposal is expensive. It would be far easier and cheaper to drill a ground water well and dump the effluent. This would contaminate wells used for drinking water. and perhaps some natgas is also injected (mixed in with the effluent) that would cause flaming faucets (at least for a short period until the drillers stop discharging effluent into the ground water).
I recall reading about a town in Texas where most of the inhabitants left because of ground water contaimination and the smell, and people were getting sick. I recall reading, and I believe you also commeted about Frackers dumping contaminated filters in barns and abandon buildings (to avoid disposal costs). The cost of hauling and disposing effluent would be much more expensive.
I also recall reading that in California, Frackers were legally dumping effluent in to the ground water (used by local residents for drinking). I am sure some one got a kick back on that agreement.
Is there a state in the USA where salt water disposal is allowed as you describe in your guess? I’ve never heard of anything like it, but since there are 50 states….
Regarding natural gas injection with flow back water, that’s also an interesting guess. How do they get the water full of gas from the producing well to the disposal well? By pipeline?
No, I think they just drill a disposal well on site, near the Oil/Gas Well and pump it in. No need for any pipeline. They already have the drill rig on site. its barely cost them anything to drill a shall well to dispose of the effluent waste on site.
That said there are probably drillers that do truck it offsite for disposal, but in a effort to save time and money, I believe many cheat and illegally dispose of the effluent waste, causing ground water contaimination.
No, they simply cannot drill a shallow well and pump waste into it. They would go to jail if they get caught doing it. Most of the companies do have their own salt water and waste water disposal well. But they have to be drilled into an assigned disposal layer that is usually sandstone or some other porous rock. It must be well below the level of the water table.
You can tell which wells are disposal well. Their permits are in the 90,000 numbers. Like this one at the very bottom of the active drilling rig list at: Drilling Rig List
CANELSON 43 LIBERTY RES MNGMT CO STOMPING HORSE SERVICE WELL 2 NWNW 21-158N-95W WIL 90326 33105903260000 2/11/2015 Undetermined
This isn’t really related directly to this topic, but I just saw this and thought I would post it here.
Here’s how a $50 drop in oil prices affects every country in the world
http://www.businessinsider.com/global-impact-of-50-oil-price-fall-2015-2?utm_content=buffer5e3b0&utm_medium=social&utm_source=facebook.com&utm_campaign=buffer
The idea that cheaper oil is good for importing countries is not quite so simple.
I will use South Korea as an example of an importing country.
Government revenues actually declined in 2014 because of a lower tax intake.
Partly because of lower fuel prices at the pump, but also because all 3 of the big oil refiners made huge operating losses, i.e. no tax on profits.
The waiver text about wells completed/producing is back.
Another big weekly drop in the Baker Hughes Rig Count.
The first week in October the oil rig count was 1609. It now stands ag 1056 for a drop of 553. That is just a tad over one third.
The Baker Hughes count for North Dakota is 123 down 9.
The ND.gov list is 137, as per the director cut.
Included in this ND.gov list is 10 wells from 2014
4 of these 2014 wells are from EOG. By all accounts EOG are one on the gun drilling companies. So why would they be taking so long to drill their wells?
Also Continental have been MIRU on ELIAS 1-21H for the last 2 weeks from memory. I only noticed it as it is down to be stacked. I believe some of the oil companies, EOG being one of them, are just not updating there results to the ND govt!
PS There are actually 8 wells going to stack as per the ND.gov page. One note is a little cryptic, “Johnsons corner Nabors yard”. I doubt they will be drilling in there own back yard, but you never know, smiles.
I have put an updated stacked graph here:
http://crudeoilpeak.info/us-drilling-rig-count
Also international rigs
http://crudeoilpeak.info/international-drilling-rig-count
Thank for the international rig count post. Interesting all areas dropping since October 2014 except middle east. Would be interested in why middle east is up.
Saudi taking advantage of cheap rig rates to do more infill drilling? Perhaps in anticipation of a drop off in shale growth?
Maybe they are chasing there own Red Queen?
Well, the minute you drill an oil well you’re getting on a red queen treadmill, it’s just that the shale treadmill is set a lot higher than for conventional.
Anyway I guess the Saudis will have known what their announcement in September would have done to the oil price, so they’d have done a cost benefit analysis. Probably cheaper drilling was a benefit.
https://www.dmr.nd.gov/oilgas/stats/historicalbakkenoilstats.pdf
If there were 192 wells in the Bakken in 2000 and now there are 8944, you are going to have more oil pumped from the ground. 45 times the number of Bakken TF wells than in January of 2000, 14 years time.
You will need more personnel, a larger workforce.
A permanent workforce that does oil hauling, well servicing, road maintenance, railroad employees, translates to more car sales, more housing, more schools, all to pump the 1.2 million barrels per day. Much more economic activity than in previous years prior to the development of the Bakken.
If there are 1 billion barrels of oil pumped every 900 days and there are 18 billion left to go, 18×900=16,200 days of oil production remaining at 1.2 million barrels per day.
16,200/360=45 years of time to extract the oil.
If it all dries up and blows away, that will be too bad.
Doesn’t look like that is going to happen anytime soon, but it could.
8944 Bakken TF wells are going to produce oil for more than a couple of years.
It all should withstand the test of time. A look back into the history of the production of oil in the Williston Basin should be a forecast for the future, with the added bonus of more oil.
BNSF hauls about 10,000 600 barrel carloads each week. About 1400 cars each day, 14 trains of 100 carloads.
Warren knows he’ll never be able to haul 1.2 million barrels of oil each day unless there are more oil tanker cars, more train engines and more train crews.
A pipeline is going to be better. Just build a new pipeline that follows the rail line, a lot of the preparation is done already, right of ways, easements etc. It will be less hassle.
A BNSF oil pipeline sounds good too. It’ll free up track space, less wear and tear on the system, more oil in the BNSF pipeline. Build it all the way to the New York harbor and have the piped Bakken oil shipped to Saudi Arabia when they begin to import oil like is projected. They’ll be wanting (strike that) NEEDING Bakken oil too someday.
Time is on the side of the Bakken.
Hi Ronald,
About a billion barrels have been pumped from the Bakken/Three Forks so far, there will only be about 10 Gb of oil recovered so 9 Gb to go if oil prices get back to $100/b by say 2018.
There are limits to how fast the oil can come out of the ground and how many new wells can be drilled per month. A gentle decline in new wells per month to 120 new wells per month and then staying at that level for many years would lead to a peak of about 1200 kb/d until about 2020 with a gentle decline until 2036.
Chart below with 120 new well per month scenario out to 40,000 wells in Jan 2036.
Hi Ron
The previous post you mention with the guest post is not coming up: ‘US Production and Imports, and a Guest Essay’ at http://peakoilbarrel.com/guest-post/ It gives a not found error. Any reason?
Pete, I don’t know what the problem is. I click on the link you posted and get the post with no error. But you can also just click on “home” on this post and scroll down. It will be the fourth post down.
Try this link, I think it will work.
http://peakoilbarrel.com/guest-post-2/
Thanks Ron, another good post by the way. (Very strange about the link. I get the same error message on my work and home computer, in different parts of London, on all browsers, and first got it from the home page. I wanted to refer to the stats in the article. Anyway, never mind, unless your cache still keeps it somehow.)
But I any case, I think you are too hasty to damn yourself, and say you were wrong about Gasland, and take a neutral position on fracking.
I’m not at all convinced by Chesapeake Energy’s attempt to discredit Gasland in Truthland. It’s what the oil companies do best.
So, lets say maybe some tap water in the region could be set aflame before fracking arrived. (Hmmm, is this good water?) But is it good if your tap water didn’t set on fire, was perfectly safe, and now does set on flame, as a result of fracking nearby? With god knows what contaminants in it? Suddenly the expose of gasland looks like it might be misleading itself.
So I soon found this which made me suspicious: “Shelly Depue, the protagonist in Truthland, forgot to mention that Williams Petroleum is under investigation for numerous violations at the wells on her property including faulting casing that has allowed gas to bubble up for over a year. And her neighbors have contaminated water.”
Makes me wonder if Shelly was paid for Truthland – not that she shouldn’t get paid, but that it might influence her memory. Links easy to find by googling ‘truthland video fracking’
Pete,
FYI I get the same “Not Found” message.
Ron may have deleted the post.
No I have never deleted a post. I deleted one comment about two weeks ago but it was not one of the regulars here.
Try this link. I changed the title. I think there was a conflict.
http://peakoilbarrel.com/guest-post-2/
Pete, are you familiar with well construction practices? The geology in the area where that specific tap was set on fire? The history of the region? Had there been any wells or mining activity in the area in the previous 150 years?
Some of us know that side of the business very well, we could approach this as a forensic study. For example, what are the pathways you would propose to get natural gas from a tight fractured reservoir to a fresh water aquifer?
Josh Fox’s “The Sky is Pink” .
http://topdocumentaryfilms.com/sky-pink/
“Gasland was so full of lies and half truths it is alarming. ”
Glad you finally got that straightened out, Ron.
Now all you have to do is apply the same detective work to Peak Oil.
What I read here is absolutely no different than what I saw and heard on “Gasland”.
Errr, just point out the lies and half truths I have posted Carl. I will see what I can do. What have I posted that you disagree with… and why. The why is very important.
Ron, and to whom else it might concern…… I don’t actually have an Internet connection at home, let alone much else usual stuff such as TV, stereo, video, playstation, radio, or even newspapers or magazines. So, I happily walk a four mile round trip through wonderful farming country and very clean nature to access the Internet for free at the local library, instead. Therefore, I am often offline for days at a time.
I don’t have the time or inclination right now to quibble over specific words said by someone, somewhere, sometime at this site. But, I do access it once in awhile just too keep track of what’s going on. As, I have put in way over 1000 hours studying the PO phenomenon, I don’t think anyone here should take my words so lightly. In case you don’t know, I am the one who challenged the entire team of editors at TOD to a public debate on PO on their terms, at their website, but they wisely declined after reviewing my comments. Not too many months later, as most would know, TOD closed due to a falling interest in PO, which was exactly correlated with a rising (Internet) interest in fracking. This was not a mere coincidence.
But, in general, PO predictions have been repeatedly proven wrong, not only by other people, but simply by time itself, year in, and year out just like clock work. At some point one just might come to the conclusion that Chicken Little is just always saying, that surely the wolf is at the door this time. It always seems to be this time, but never last time. I think a good question to ask yourselves is whether the next coming of PO will actually occur before, or after the second coming of Jesus? So how about we talk about religion, belief, first and second comings and such instead, because that is all that PO has proven itself to be so far.
The fact remains, that all predictions are by definition only statements about a future, that cannot be determined by ordinary human means. They require a leap of faith that I am simply not capable of, yet am honest enough to humbly admit. I simply do not believe in belief, nor do I have any faith in faith. Yet all of you apparently do, and quite adamately so. I only operate from a basis of first hand knowledge and experience.
In regards to PO, the issue now is primarily shale oil, and perhaps secondarily, oil sands oil. Contrary to popular belief, world oil consumption is still (slightly) increasing, while world (especially US and Canada) production is still increasing. There is no glut at present, and there has not been one recently, but there is a stubborn over supply of oil on the market right now even with WTI oil priced around $50. How much is difficult to know, but it’s probably about 25-50 million barrels in floating storage (idled ships) and about one million more a day piling up for about as long as the eye can see. There is no sign of any change coming. The only production cuts that I know of is several hundred thousand bpd from Libya due to rebel activities.
Sorry, but try as hard as you like, the future coming of PO is not heralded by such low oil prices, and for so long. You have all been very carefully explaining for years on end, how ever higher oil prices mark the coming of PO. The present period simply marks the ultimate demise of all PO theory, because everything even left about PO theory just got shot to shit. Hubbert’s peak was scheduled to be surpassed in late 2015. Now it’s more likely to occur in 2016, or possibly all the way to 2017. It is expected that the US will be producing about 12,500,000 bpd before too long. What are you all going to do, not if, but WHEN Hubbert’s peak is surpassed?
The fact is that the root cause of all differences of opinion between us is based solely upon this group’s general ignorance of US shale oil geology and extraction methods, when all such knowledge is readily available to the general public at company websites. Don’t worry, I know why you don’t bother to access this generally correct information. It is because you do not BELIEVE it, and you do not have the FAITH, that they are telling you the truth. Your lack of faith, and your lack of belief, still keep you located squarely in the lap of religion, not science. What you don’t seem to get is the fact that these oil companies all enjoy the default position. Therefore, they must be considered to be innocent of all (your) charges against them, until the opposite is PROVEN. But, it is exactly this, that you cannot do. So, you choose to simply disbelieve them instead, which consequently proves, that PO is only a belief (dis-belief) system, which specifically means that it is a religion.
Perhaps an educational video from my favorite atheist, Qualia Soup, would help explain things. http://youtu.be/5wV_REEdvxo
But peak oil HAS occurred in many places or companies wouldn’t be looking for other places to drill.
Shale and tar sands are only of interest because the cheaper fields are declining and other cheap fields haven’t been found.
Boomer II,
To start with,…”It ain’t over until it’s over.” Get it? I think you need to be able to distinguish between a TEMPORARY peak, and some kind of final peak. The final peak is well known to anyone who is even remotely aware of what PO actually is. It really is quite simple. It starts to occur when about half of the OOIP of the area concerned is reached. I think you know the rest. But, if the total OOIP of any given area is unknown, (“X”) then it is obvious that NO ONE knows what half of “X” actually is, or when in the world this might occur. That is why Hubbert got it wrong. He never figured out what “X” actually was, and nor has anyone else before or since, so you might as well drop the whole charade, because that is all it is.
So, don’t bother feeding me any line of BS about any country on this planet that has reached PO, because YOU, spelled Y-O-U, don’t know. Besides that fact, it doesn’t even matter anyway, as long as other countries haven’t reached their peaks. This is not exactly rocket science, but you don’t seem to be able to even see the main difference between your ass and your elbow. Your complete ignorance of the mere basics of PO is absolutely astounding to me!
Shale and tar sands are only of interest because they are actually cheaper to develop than many other conventional sources. One of the main reasons why, is that their locations and geographical extent are generally known. Therefore there are no finding costs. Economically viable means of production (mostly at $100 oil) are very well known, and very well proven. That is why they are being (over) produced.
Do you happen to have contact to any mainstream media? Because, I’m seriously wondering what planet you actually live on.
So, don’t bother feeding me any line of BS about any country on this planet that has reached PO, because YOU, spelled Y-O-U, don’t know. Besides that fact, it doesn’t even matter anyway, as long as other countries haven’t reached their peaks. This is not exactly rocket science, but you don’t seem to be able to even see the main difference between your ass and your elbow. Your complete ignorance of the mere basics of PO is absolutely astounding to me!
I’m going to let others here respond because they know more about oil than I do. You are posting in a peak oil forum.
You’ll be someone’s dinner.
Boomer II,
You are correct that there are many people at this site, who know more about PO than you do. I just happen to be one of them. There really and truly are MANY others. In such a situation, the obvious course of action for you would be to simply ask enough questions until you gain enough correct answers, that you will be one of the many here who do know, what they are actually talking about.
Ask questions? That is precisely how most of us have gotten the answers, that you apparently still lack. The first step to gain knowledge is always the admittance of ignorance. Without that, no knowledge will ever be gained.
It is YOU, spelled Y-O-U, that needs to be reminded, that YOU are posting in a PO forum, not me!
Nobody, I repeat, NOBODY at this forum has the ability to eat me for dinner. You don’t even have a clue about who you are really up against here, or why. And, don’t expect anyone at this forum to fight YOUR battles for YOU, especially when you keep choosing the loosing side of every argument. Besides, it is well known, that the duty of another is always full of danger. Caveat Lector.
I will share this with you, though. It was a comment posted in this forum in response to a young man (age 27) who thinks we need to go out and find more oil.
I’m a professional of around your age working in the oil exploration business. This last decade has been the single busiest decade for oil and gas exploration ever. The oil companies have been throwing mountains of cash into upstream spending, increasing at a rate of about 10% a year. We’re looking deeper underground, further offshore, under giant subsurface salt domes and we’re even down to trying to crack up source rocks to squeeze out the oil. And what do we have to show for this superhuman effort? Around a 4% increase in oil production over a 10 year period, and a whole lot of surveys which didn’t find a great deal. Most of the money we were throwing into the system merely went to holding off decline, but that’s coming to an end now because the oil majors simply can’t afford to do it any more.
So while you might be right that we need many more oil and gas discoveries, it’s extremely likely that it ain’t what we’re gonna get. We’re going to get to live through some very intersting times, my man, and no mistake.
Don’t know why the above was posted, but last time I checked world oil production was still going up, and the present oil price is still getting held down because of over production. Apparently, $40-$55 WTI oil has not been low enough, long enough to discourage US, and by extension world overproduction. Looks like we will all just have to continue living with an over abundance of oil at rock bottom prices. It seems like oil certainly is rather cheap and easy to find and produce these days. Apparently, historical production data does not tell lies, but people still do.
“Gasland was so full of lies and half truths it is alarming. ”
Glad you finally got that straightened out, Ron.
Now all you have to do is apply the same detective work to Peak Oil.
What I read here is absolutely no different than what I saw and heard on “Gasland”.
So, Gasland (a film about fracking, not peak oil) plays fast and loose with the facts, and that proves that peak oil theory is false?
Wow. That is an amazing leap of logic. How do you justify it?
Futilitist,
FYI ….. I have also spent thousands of hours studying all aspects of Liberalism, which is what both PO and “Gasland” and a multitude of other issues are actually all about, when you get down to the nitty gritty. The patterns of deception and outright propaganda tactics are unfortunately exactly the same for all the well known Liberal causes. Instead of asking me to justify my claims, why don’t you simply do as I have done? Why not start viewing PO in the same light as Gasland, and see what you come up with?
According to the original “RED QUEEN” article, also posted at this site, the Bakken is not supposed to be producing more than 650,000 bpd (mid figure). The EIA expects the Bakken to be producing at exactly DOUBLE that by March, 2015, or 1,300,000 bpd. The incorrectness of this Red Queen article has yet to be confirmed at this website. I recently read an otherwise good article on oil production, that unfortunately referred to this aspect as being very real right now, or quite soon. Methinks, this website should start aligning itself with what is known to be true, rather than what is known to be false. I am indeed curious as to why so many seem to disagree with my suggestion. Perhaps, you know why?
spent thousands of hours studying all aspects of Liberalism
In other words, you listen to Rush Limbaugh and think you are learning something.
No, it means that I actually have never listened to Rush Limbaugh at all. I do not live in the US. The official/unofficial “American spokesmen for the case against Liberalism are Bill Whittle ( Tea Party) and Thomas Sowell (Economist and Historian, plus student of Milton Friedman (also an Economist. Why don’t you study the words of these men and educate yourself properly. To even speak of Rush Limbaugh suggests a very profound ignorance of the many fallacies of Liberalism. I know for sure that I am communicating with a first class loser. You just proved it. Here are some very short sample videos for your much needed education on the fallacies of Liberalism. I do hope you can tolerate the color of Thomas Sowell’s skin. Most Liberals cannot. http://youtu.be/XzT21b-BMQk
http://youtu.be/FAA_So0d01w http://youtu.be/za6tV1oLQbI
Carl, if you do return to read this I would love to read something specific. For example, do you think the ultimate reserves are higher? Or do you propose an oil source in an exotic location or type of rock we don’t know about? What’s your secret sauce?
So far our Carl Martins tend to comment only once or twice before disappearing. I think most of the comments made by this sort of character are made seriously though.
There really are tens of millions of people who believe there is always going to be plenty of oil because somebody told them so…… That somebody being a mouth piece for business as usual.
When you ask them a serious question they suddenly realize they are in water way over their heads as a rule if they are both serious and intelligent and don’t come back.
There are countless business as usual mouth pieces possessed of ENORMOUS status and wealth and even moral and intellectual authority that contribute on a regular basis to the ” Peak Oil is a Myth ” meme.
Harvard University for instance. I am sure Harvard must have at least a couple of professors who understand basic geology at the freshman level it was taught to me at a ” Cow College ” back in the Dark Ages but I have yet notice that one of them has had anything to say publicly about that recent paper by Mageuri or Magoo or whatever his name was that is never mentioned in the MSM without throwing in the word HARVARD in every other line at a minimum.
Then everybody’s favorite whipping dog our federal government says oil production will continue to increase for another generation at least. Everybody calls on the feds when they want an authoritative source to back up an argument even if they are a dyed in the wool Tea Partier or a Green Peace executive.
Add in the fact that most people learned almost nothing outside their narrow specialty in university- assuming they went – and that hardly anybody learns anything outside his specialty after leaving university – and it comes as no surprise that the Peak Oil band is about as big as a gnat or fly buzzing around the fifteen hundred pound business as usual oil cow.
But we soldier on, in my case mostly because I have nothing more entertaining to do except work and after a half a century of that it I finally realized that W O R K is a four letter word. 😉
Fernando,
I do not relate to the term reserves particularly well, ultimate or not at all. But, I do know that worldwide merely the known amounts of shale oil in place at present, (OOIP) is about 30% more than the total amount of oil we have so far extracted. That said, I am primarily only focused on US shale O&G production. As Hubbert, himself, once said, what first happens in the US, tends to happen later in the rest of the world. This website has not yet acknowledged the primary cause of the present day low price world oil situation. It is because of the US shale oil revolution. It is therefore a stand off between Saudi Arabia and Saudi America, as to which country has the right to call itself Saudi. So far, American shale oil is winning hands down. Just curious, do you happen to have any idea why?
OFM,
Publicly traded oil companies provide interested parties with all relevant information regarding their respective land positions, reserves and resources, present rate of production, and guidance regarding their future plans for production, sometimes several years out. Besides that, they often supply various bits of information about competitors, and the shale plays they are involved in. Much geological information is also made available, but a basic understanding of geology must be present to understand much of it.
Most companies that I know of, which is quite a few, have given out information suggesting that they have years, if not decades, of future drilling sites. This was with $100 oil. There are obviously far less places right now, but technology keeps improving. You only need to study this information to understand what is likely to happen in the near future. No PO in sight.
But no one, I repeat, no one, expects oil prices to remain this low more than a year or so at most. Personally, I don’t expect them to get back to $100 anytime soon, but that is only my opinion. Much of my money is still heavily invested in US shale oil production, because I have studied all the relevant facts. I am not at all interested in fiction. Most of my time is spent studying ignorance and delusion. That is why I am here. For your enjoyment and education…….
http://youtu.be/d2afuTvUzBQ
I haven’t been as pessimistic as some of you, because I think the human race will find a way to survive, even if at very reduced numbers and at a much more constrained lifestyle.
But I have to say, when I see comments like this, I can see where some of you are coming from. People are capable of being in denial until their world falls apart. And even then, I suppose, they can come up with reasons why everything fell apart rather than the actual reason: It wasn’t that oil ran out, it was that God is punishing gays, or Communists are stopping the world from finding oil.
Most companies that I know of, which is quite a few, have given out information suggesting that they have years, if not decades, of future drilling sites.
Sorry if this was posted already. It’s getting a bit more difficult to keep up here. Lot’s of comments.
Luis de Sousa piece wrt debt financing/tight oil.
http://attheedgeoftime.blogspot.co.uk/2015/02/shale-sub-prime-and-ides-of-march.html
This will lead to some interesting times! From your link
As more information emerges, the moment of truth is slowly becoming visible. Petroleum companies must submit their 2014 asset reports to creditors until the end of March. Based on petroleum prices of late December,
It will be acquisition time for the big boys.
Every real country boy learns early that one of the first and most fundamental rules of trade is that you sell to somebody in a hurry to buy and buy from somebody in a hurry to sell.
Keeping this simple rule in mind has enabled me to enjoy a lot of luxuries I could not have afforded otherwise as well as enabling me to avoid a lot of hard work.
Dennis, I agree the backlog of wells awaiting fracking will keep production high for six months or so. I have no idea how many wells are coming on line each month when even Lynn Helms either don’t know or is extremely confused by the matter.
I still believe that production will start to drop in June or July. But the number of producing wells added each month has increased by about 20 per month over the last 12 months. That is one reason we have seen an average of 25,000 barrels per day increase in production monthly.
Hi Ron,
When Enno sends me new data, I will forward it. Just sort out the Bakken wells and then sort by dtae and you can count up the wells, but count 95% of the confidential wells as Bakken wells also.
Data in your inbox
Ron – you should be aware that the make of Fraknation (one Mr McAleer) does seem to have his own agenda, as does his wife who makes films with him:
Thus one of his other films is entitled: Not Evil Just Wrong (from wiki):
Not Evil Just Wrong is a film McElhinney and McAleer directed and produced to challenge Al Gore’s An Inconvenient Truth. It suggests that the evidence for human-caused global warming is inconclusive, and that the impact of suggested legislation for mitigating climate change would be much more harmful to humans than beneficial.[12] The movie was filmed in 2008, and was screened at the International Documentary Film Festival Amsterdam[13] and at the Right Online conference in 2009.[14]
His wife (wiki): McElhinney is a popular speaker at conservative conferences. Her most recent appearance was at Right Online in Las Vegas, hosted by Americans for Prosperity, where she spoke out in reaction to Van Jones—who had made an appearance at Netroots Nation.[32] She spoke at both the 2009, 2010, and 2012 Conservative Political Action Conferences. In 2009, a U.S. poll identified McElhinney and her husband, Phelim McAleer, as the most popular conservative speakers after broadcaster Rush Limbaugh and columnist Ann Coulter.[33]
And more about his climate change denialism:
”In October 2010, film director James Cameron donated $1 million to oppose California’s Prop 23, which would have overturned AB 32—California’s climate change legislation.[42] In response to this donation, McElhinney and McAleer made a short film; it alleged that passage of AB 32 would increase Californians’ energy costs, and suggested that Cameron, who’d been quoted as saying, “we are going to have to live with less,” lives a more energy-extravagant life than most Americans.[43] The Independent said that this attack advertisement was “tapping a rich rhetorical vein”, but ignores Cameron’s distributor, 20th Century Fox, which buys carbon offsets.[44][45]”
http://en.wikipedia.org/wiki/Ann_McElhinney_and_Phelim_McAleer
It would be hard not to conclude that the makers of the film that attacks Gasland are not just paid shills of the fossil fuel industry………..
I agree Andy. I’ve just posted a quick comment in my thread above on Chesapeake Energy’s Truthland which I also find suspicious on a number of accounts. It should probably go here.
oh boy Ron, another Pandora’s box. Good on you for trying to figure it out.
might as well try to watch GASLand II.
anyway…..
Affirming Gasland
A de-debunking document in response to specious and misleading
gas industry claims against the film.
http://1trickpony.cachefly.net/gas/pdf/Affirming_Gasland_Sept_2010.pdf
http://thinkprogress.org/climate/2013/06/09/2126271/phelim-mcaleer-fracknation-tobacco-playbook-josh-fox-gasland/
Ezrydermike, if a person wants to be one who is believed then they should refrain from lying. But if you are caught in just one lie, especially if it is a really big whopper of which your whole case is built around, then you are not a person I would believe on anything.
The flaming faucets was one really big whopper of a lie. And it is obvious Josh Fox knew it was a lie. But he choose to tell that lie anyway. That’s all I need to know about Josh Fox.
FrackNation the documentary that exposes Joshua Fox as a liar?
My apologies, up thread I described this guy in Fracknation as a Brit. No he is an Irishman.
I understand the point you are making about lying.
I haven’t seen Gasland II, Fracknation or Truthland. It’s been a while since I saw Gasland. I guess I’ll be watching them this weekend.
Josh Fox does seem to address some of this in the Affirming Gasland link.
Well said, Ron.
Andy, I am aware of the fact that the McElhinneys are both right wing raving nut cases that think all environmentalist are evil lunatics. And they think peak oil advocates are just nuts. However to its credit I saw nothing in the documentary “Fracknation” that would even hint at any at any anti environmentalism. The entire documentary was devoted to exposing the misleading claims of Gasland and nothing else.
If there was a hidden agenda in the film it was well hidden because I did not see it.
You only have to view this lecture by Ann McElhinney to know she is an absolute nut case.
“Lessons from the Debate over Fracking”
I found that she has no idea what an environmentalist really is and puts them all in one basket. Actually environmentalist disagree among each other almost as much as they disagree with the right wing nut house.
But neither of the McElhinneys were in the film. It was narrated by a soft spoken Brit who, like Joe Friday, just wanted the facts mam, nothing but the facts.
So, lets say maybe some tap water in the region could be set aflame before fracking arrived. (Hmmm, is this good water?) But is it good if your tap water didn’t set on fire, was perfectly safe, and now does set on flame, as a result of fracking nearby? With god knows what contaminants in it? Suddenly the expose of gasland looks like it might be misleading itself.
Pete, gas seeps are very common all in many places in the US. Methane in the water does not hurt it, to my knowledge anyway. Well just as long as you don’t smoke in the shower.
However the claim that the gas came from the fracked wells is more than a little absurd. The gas wells are a mile or two below the water table and no frack would reach that high. And the well casing is steel, reinforced with concrete then steel again. No gas can escape.
But some of the water did contain a lot of iron and sulfur, which had nothing to do with the fracking either. But watch “Truthland”, it will explain a lot and is only about 34 minutes long.
Truthland: Dispatches from the Real Gasland – Full Movie [HD]
The best way for frack supporters to prove their industry is safe is to test water and air before, during, and after. The industry has often been secretive, which gives rise to suspicions that they have been hiding something.
I agree. And remember methane is an odorless gas so you need gas detection instruments. It’s produced during decomposition of manure and accumulates around manure storage areas; not a big deal around farms. Although maybe Mac can provide input on that. Exploding barns?
And methane seeps are common worldwide on all scales. The reasonable approach, as you suggest, is baseline tests before drilling and monitoring afterward.
Boomer, Mr. Leighton, Several companies operating in the Marcellus have already, in a proactive mode, been taking well water samples from nearby wells before any drilling/fracturing occurs so as to have a baseline showing no damage has taken place and thus, they cannot be sued for less than perfect water content.
Somewhat less than surprisingly, there are a fair number of residential wells found to already contain relatively high contents of items such as sulpher, iron, radon, and, yes, sitting atop some of the largest coal and nat gas formations in the world, methane.
Oh Ouch Wow!!
So far as I have ever heard only one barn has ever for sure exploded as a result of of methane build up inside it. This one was a dairy barn in Germany and judging by a picture of it the Germans built it better and tighter than some of my neighbors houses.
Farm buildings are ordinarily sturdy but not at all that airtight and so any dangerous gas build up inside generally has to come from a fast leak from a storage tank or supply line. If a barn explodes you can safely bet somebody was up to something dangerous inside such as working on a gasoline engine or making meth.
Silo’s used to store grain are subject to dust explosions.
I guess a barn could suffer a dust explosion but it seems VERY unlikely. Too much ventilation not enough work going on to fill the air with dust and probably too much humidity most of the time.
A silage silo- a tightly constructed structure used to store and ferment chopped green forage- can theoretically explode. This involves improper management equivalent to driving the wrong way down a one way road. I have never heard of an actual case but then there is no reason I would have unless it were nearby.
Silos with forage are usually low oxygen high environments and falling into one may result in suffocation. It happens at least a couple of times every year someplace in the US.
If there is methane enough to burn there should not be oxygen enough to support a fire.And the fermentation is supposed to be to to CO2.
I have a theory: these Germans have hermetically sealed roofs, put a bunch of cattle in the barn for several weeks, feed them hops and hay, the cows fart like crazy, the warm methane rises, and an explosive concentration is reached as a 17 year old farm hand goes up a ladder holding a candle and a Playboy magazine.
Okay, Fernando … and all readers in the “You Can’t Make This Up” mode, last year, Argentinian scientists developed harnesses for cows that captured their farts. Yes, these so-called ‘fartpacks’ were developed to prevent the release of climate changing methane caused by cattle flatulence. Y’all can google that .
Quick aside/followup Fernando, to our recent exchange regarding 32-well pads … Encana still holds the record, I believe, for most wells drilled from a single pad. In a box canyon in the Piceance formation in northwest Colorado, they drilled 52 directional wells from a 4 1/2 acre pad in 2011. Picture is on the web somewhere from a local paper (Greeley Tribune?). Impressive engineering.
Amazing. They must have been on rough terrain. We seldom drill more than 50 wells from offshore platforms. And that’s very expensive real estate.
Doug, While I generally lurk here a connent is in order. In S.E. Pa. where I an from a large steer feeding operation with a liquid manure system underneath the feedlot began to lose a few head here and there. Long story short…a very large and heavy “manhole”cover was moved by gas pressure enough that the missing cattle were found in the open tank!
I watched Truth land but did not find it convincing. I think that some way or another, contaminated water gets out into the environment. Even if fracking only disturbs the rock formations outside the well casing and results over many months, due to high pressure, in methane seepage into the water table where there was none or very little previously, and some outage spills from the site, or as a result of disposal methods, and mixes with the water, in my view the overall message, symbolised by the flaming tap water, is probably correct.
Pete, I cannot vouch for anyone’s disposal methods. In fact companies in the Bakken have been caught disposing radioactive filters in unauthorized dumps. But the idea that the gas, due to fracking, seeps up a couple of miles through hard rock, to the water table is just a little absurd.
Not even Josh Fox was dumb enough to make that claim. I don’t think anyway. I thought they were claiming that the well casing leaked in the area of the water table. But if he is claiming that the gas does migrate two upward to the water table, then I have even less respect for his opinions than I did earlier… if that is possible.
Ron Wrote:
“However the claim that the gas came from the fracked wells is more than a little absurd. The gas wells are a mile or two below the water table and no frack would reach that high. And the well casing is steel, reinforced with concrete then steel again. No gas can escape.”
What happens to the effluent after fracking is completed?
http://www.nbcbayarea.com/investigations/Waste-Water-from-Oil-Fracking-Injected-into-Clean-Aquifers-282733051.html
Tech, that is a different subject altogether. Why would you quote me about how gas may or may not get into the water table then answer it with a statement about dumping fracking fluids?
Example, statement:
Bird dogs cannot fly.
Reply:
But pigs love to wallow in mud.
Ron Wrote:
“Tech, that is a different subject altogether. Why would you quote me about how gas may or may not get into the water table then answer it with a statement about dumping fracking fluids?”
I don’t think you’ve connected the dots. The drillers are disposing their waste into the ground water using shall wells, which causes some NatGas to be pumped into the ground water with the effluent. When they drain the well (oil or Natgas) of effluent, its also going to include Nat Gas too. Do you follow now?
You must be joking. No, they simply cannot pump their waste water into a shallow well they drill near the drilling site. There are disposal wells and they are very deep into an assigned disposal layer of sandstone. Check the last rig listed here.
Drilling Rig List
That is a disposal well, that is where they pump the salt water produced with the oil. There is no gas in the water they pump there.Why would there be gas in it? The oil is separated from the water and I assure you any gas would be separated also.
CANELSON 43 LIBERTY RES MNGMT CO STOMPING HORSE SERVICE WELL 2 NWNW 21-158N-95W WIL 90326 33105903260000 2/11/2015 Undetermined
“You must be joking. No, they simply cannot pump their waste water into a shallow well they drill near the drilling site. There are disposal wells and they are very deep into an assigned disposal layer of sandstone. Check the last rig listed here.”
You are correct, its illegal, but it they were doing it, it would explain how the ground water is getting contaminated, would it not? Unfortunately not everyone in the world is honest and follows the rules.
No, it explains nothing. A company would not openly commit such a crime. The CEO would go to jail, the driller would go to jail. No one would take such a chance.
But the ground water is not being contaminated by fracking. And the idea that gas could be injected back into the ground with water is really weird to put it mildly. I mean that a stretch even the anti fracking activist would not dare take.
Look at the web site below. They list over a dozen instances where the groundwater has been tested by various state and federal agencies. Not one single case of groundwater contamination was found.
How Anti-Fracking Activists Deny Science: Water Contamination
State Review of Oil and Natural Gas Environmental Regulations, Inc. (STRONGER): “Although an estimated 80,000 wells have been fractured in Ohio, state agencies have not identified a single instance where groundwater has been contaminated by hydraulic fracturing operations.” (January 2011)
Ron Wrote:
“No, it explains nothing. A company would not openly commit such a crime. The CEO would go to jail, the driller would go to jail. No one would take such a chance.”
Of course the would not openly do this. But crimes are committed all the time. I am giving a reasonable hypothesis of how ground water could get contaminated. Its plain silly to assume that drillers and service companies will never commit crimes.
Ron Wrote:
“Look at the web site below. They list over a dozen instances where the groundwater has been tested by various state and federal agencies.”
Here is a news source of confirmed ground water contamination:
http://www.usatoday.com/story/money/business/2014/01/05/some-states-confirm-water-pollution-from-drilling/4328859/
“Pennsylvania has confirmed at least 106 water-well contamination cases since 2005, out of more than 5,000 new wells. There were five confirmed cases of water-well contamination in the first nine months of 2012, 18 in all of 2011 and 29 in 2010.”
You asked how would the Natgas get injected into the ground water, Simple: They don’t bother hooking up the equipment to seperate the gas from the water. They literally connect the drain pipe into the shallow well pushing both effluents and Natgas (in suspension) into the shallow well. Most of its effluent waste but there will be some NatGas present too, or perhaps condense (still under high pressure) that boil off when the pressure drops.
I am sure we will see this practice come to light in a year or two, and people will go to jail.
Here’s a quote from the article you linked:
“Experts and regulators agree that investigating complaints of water-well contamination is particularly difficult, in part because some regions also have natural methane gas pollution or other problems unrelated to drilling. A 2011 Penn State study found that about 40% of water wells tested prior to gas drilling failed at least one federal drinking water standard. Pennsylvania is one of only a few states that don’t have private water-well construction standards.”
Some states just need improved standards and regulations.
I find the use of the term “climate denial” to be pretty weird. I’ve never met anybody who “denies the climate”.
To understand Gasland’s merits one has to approach it from a knowledge based point of view. I remember seeing it, laughing about it, and thinking it was a lot of BS. But I’m prepared to sit down to discuss it and see if there’s any merit to anything it mentions.
I find the use of the term “climate denial” to be pretty weird.
FYI, In ordinary parlance it usually is considered shorthand for “climate science denial”! To be even more specific it is generally used to describe the denial of climate science by individuals who self label as skeptics, but have no climate science credentials to speak of, yet feel they are nonetheless qualified to deny the results of the peer reviewed science done by actual climate scientists based purely on beliefs and mostly ideological grounds . They do not accept, that, CO2 added to the atmosphere as a result of humans burning fossil fuels is causing profound changes in climate stability.
I read peer reviewed papers all the time, and some of them are nonsense. Are you familiar with the process? Peer review doesn’t mean the text is that good. Peer review can range from absolute uselessness to very helpful hints. Some peer reviewers also like to bless dumb papers, because they have a “I dont pee in your soup if you don’t pee in my soup” attitude.
As for your use of “climate denier”, it sure sounds very inaccurate.
Whatever, Fernando.
The point I would like to make is that if I’m diagnosed with heart disease I’m going to pay attention to what my cardiologist and his colleagues have to say and until my plumber gets his MD and has spent a decade or two working as a cardiologist, I really don’t care how many medical books he has read, his opinion about heart disease ain’t worth squat.
The point is that in this world people can disagree, and such words are considered an insult.
Check this out
“The Tragedy of the Risk-Perception Commons: Culture Conflict, Rationality Conflict, and Climate Change”
http://papers.ssrn.com/sol3/papers.cfm?abstract_id=1871503
“The individual level, which is characterized by citizens’ effective use of their knowledge and reasoning capacities to form risk perceptions that express their cultural commitments”
In other words, people are following their cultural leaders, and rationalizing on the way.
People don’t use a label like “climate denier” when trying to persuade someone – it’s a shorthand for talking about someone who’s following their cultural leaders rather than their best thinking.
Or they use “climate denier” when they follow THEIR cultural leaders. The paper does show the amount of knowledge in both extremist groups is roughly similar, the “skeptics” appear to be slightly more knowledgeable, and the degree of extremism increases with the amount of education. This is why I always try to point out that name calling and patronizing attitudes are better avoided. In this particular case I think there are quite a few people cranking things up on purpose for their own polical reasons.
Yeah, both sides have a fair amount of herd-following.
Yet, even though both sides have their share of subjectivity, there is an objective reality, and it happens to be on the side of the people who feel that Climate Change is a serious problem. I’m not sure exactly what historical accident put Republicans in the camp of the Fossil Fuel industry, and Democrats in the camp of the scientific community, but that’s where they are.
Pretty much only in the conservative political corner of the US, and only in small odd corners of the scientific community do we still find disagreement. A tiny amount of scientific disagreement isn’t surprising – we have to keep in mind that it still possible to find a tiny number of biologists, and a significant number of non-biology scientists, who don’t believe in evolution…
Here, for instance, are the physicists: “The American Physical Society “strives to be the leading voice for physics and an authoritative source of physics information for the advancement of physics and the benefit of humanity”.
Their current statement about Climate Change is as follows:
“The evidence is incontrovertible: Global warming is occurring. If no mitigating actions are taken, significant disruptions in the Earth’s physical and ecological systems, social systems, security and human health are likely to occur. We must reduce emissions of greenhouse gases beginning now.”
That’s a strong statement.
See http://www.aps.org/policy/statements/07_1.cfm
Even the society for Petroleum Geologists is on record as agreeing. What more do we need?
I think running out of fossil fuels and overpopulation are more critical. I’m also worried about governments violating human rights, and the way useless wars are being started.
I agree those are all serious problems.
But, we have better and cheaper substitutes for oil, and we don’t for our biosphere.
“I’m also worried about governments violating human rights…” ~ Fernando Leanme
But that’s what they do as part of their very existence. When you see governments and their use of force (upholding so-called-private corporate property [laws] for example) through the eyes of anarchism/simple ethics, all superficial concerns, say in the news, about this or that government’s transgression all fall away when you get that governments are really just pimps. It’s pimped-out neofeudalism/neoserfdom.
What part of undemocracy do you not understand?
“It is just as difficult and dangerous to try to free a people that wants to remain servile as it is to enslave a people that wants to remain free.” ~ Niccolò Macchiavelli
“It seems that the claim I and many others have made for years, that the ‘War on Terror’ is a gigantic fraud used to instill fear and further the creation of an unconstitutional surveillance state in America is absolutely true. The ‘terrorists’ they have declared war on are the American people themselves.” ~ Michael Krieger
The governments are the biggest terrorists; have the monopoly on terrorism, not just force.
“The most dangerous man, to any government, is the man who is able to think things out for himself… Almost inevitably he comes to the conclusion that the government he lives under is dishonest, insane and intolerable…”
~ H.L. Mencken
”I’m not sure exactly what historical accident put Republicans in the camp of the Fossil Fuel industry, and Democrats in the camp of the scientific community, but that’s where they are.”
It is a simple as simple can be – SO SIMPLE that most people refuse to believe it.
We are tribal or pack animals and our neocortex is on our boss. We are members of the tribe first last and foremost with only a very few exceptions.
The MODERN liberal wing of American politics – which overlaps mostly but by no means entirely with the Democratic party these days – is pushing an agenda that pisses of social conservatives to the nth degree.
So part of the answer is that many things the Democrats want is are things to be resisted and fought agains because there really is a CULTURAL WAR being actively fought. If the liberals want it then conservatives must necessarily try to deny it as part of the war. You win a war physical or cultural one fight at a time. Lose enough fights and you lose the war. You don’t give up ANY ground without a fight unless you must. SO -EVEN if an issue means NOTHING to you personally if you are a true blue conservative and the democrats are FOR it you line up against it. This works both ways of course.
Another part of the answer is that the liberals who are politically active are generally insulated from the direct undesirable effects of their initiatives. I am painting with a broad brush but I can say with no doubt whatsoever that the odds of a person being a liberal are twice as high if he is a government employee as if he is a construction worker – unless he is in a powerful union.Most working people of course are not members of powerful unions. The unions are siamesed to the Democrats. Teachers and post office people and government people in general don’t get laid off when an industry closes or moves due to changing regulations etc. Redneck working people do. This scares the hell out of working people and the business community is highly skilled at fanning the flames of this fear.
Just about every new law and regulation I have ever heard of makes it HARDER fro an uneducated or poorly educated person to go into business for himself or to stay in business for himself. IF just a third of the environmental regulations that have been proposed for my area and my industry are ever implemented I would be forced to shut down except that I have already retired. Right now there are regs that may or may not go into effect that will result in the defacto uncompensated taking of about twenty percent of my very best land. I will still own it and have to pay taxes on it but it will be totally worthless to me except to go rabbit hunting.
The liberal wing thinks it is fine to say what will be legal and illegal according to their own morality – whereas the conservatives like their own older morality much better.So a real conservative hates a real liberal’s guts and the liberal returns the favor with interest.
The Democrats are right about environmental issues but the proof is such that if you do not want to believe it you can easily convince yourself it is flawed or even fabricated. Not many people – probably not more than two or three out of a hundred in this country – are actually qualified to have opinions except second hand – meaning their opinions are accepted as a matter of faith. You can graduate from almost any elite college or university in the country with the exception of a VERY few that are just about all science or engineering oriented without learning half as much real honest to Jesus science as I learned in a backwoods high school on the academic track well over half a century ago.
ONE SO CALLED SURVEY course is all you need for a bunch of majors at Yale. Look it up. These courses are about the intellectual equivalent of basket weaving.
Now the liberals /Democrats are WRONG about a great many things that are important to me and TO ME it is perfectly OBVIOUS they are wrong.
But to a liberal my proof is no good. A liberal doesn’t want to believe and just like a conservative finds it very easy to convince himself that CONSERVATIVE evidence is flawed or even fabricated.
Society moves slowly. The average conservative is slow to admit than new regulations are needed but eventually accepts them. The average liberal is slow to accept any loss of government power and authority but likewise gradually comes to accept it.
If my cousin the mail carrier had his way UPS and FEDEX would be outlawed. Fax machines too.
I used to be a teacher and I KNOW without a shadow of doubt that the teachers unions and teachers lobby and monopoly is ninety nine percent about teacher and one percent about kids.
IT is mostly US and THEM or to put it slightly differently US OR THEM folks. We are just naked apes that have learned how to wear clothing and make stuff.
The mid brain is still in charge.
Old farmer mac,
“We are just naked apes that have learned how to wear clothing and make stuff.
The mid brain is still in charge.”
This is something you and I agree about.
Hoping Political Economist or someone who can decipher this model can shed some more light on this:
Don’t waste time with solar – lecturer
“Despite Jamaica being a land of sunshine, a senior lecturer at the University of the West Indies, Mona, has suggested that it would be uneconomic for the country to harness solar power to fire the power grid.”
The actual resaerch paper (pdf)
Achieving the Renewable Energy Target for Jamaica
The researcher, an economist, is saying “”Contrary to increasing popularity of solar panels in Jamaica, given current investment climate and costs, solar energy is not recommended as an energy option for electricity generation for the national grid,”. He may be absolutely correct as far as the national grid goes but, the calculations for individual businesses, especially those with high daytime and low night time electricity consumption, point to fairly short payback periods (4 years).
Alan from the islands
Alan – The model seems to only consider CAPEX (Capital Expenditures),
and ignores O & M (operations and maintenance).
At least that’s how I read “c sub(i)” – the unit cost of capital/kWh for electricity source i.
Solar, wind and hydro are “all CAPEX” (actually O & M is around 10 – 20% of lifetime cost),
whereas cheap gas turbines are 10 – 20 % CAPEX, with huge and variable (unless one has a 20-30 year hedge on fuel) O & M costs.
He _could_be_ including O & M in “capital cost”, with a model of net present value of the O & M costs,
but I don’t see any assumptions about discount rates, lifetime, presumed inflation, etc. that are typically part of such an approach to LCOE (Levelized Cost of Energy).
And I don’t see any actual numbers associated with capital costs – highly suspicious – “trust me, I’m the expert”.
Here’s a decent paper on LCOE of various technologies, comparing 6 different models/sets of assumptions. The assumptions make a lot of difference, and some of clearly outliers – the EPRI’s MERGE 2009 assumes PV CAPEX of $8/Wp flat to 2050 – when large scale PV is today closer to $2/Wp.
http://www.nrel.gov/docs/fy11osti/48595.pdf
The NREL paper is from 2011, and many of the models don’t have much/good real-world cost data.
The International Renewable Energy Agency, among other things, tracks actual costs of renewables projects.
This IRENA paper will have updated real-world costs from 2014.
http://www.irena.org/DocumentDownloads/Publications/IRENA_RE_Power_Costs_2014_report.pdf
This paper has a better (at least, less obscure model of cost of power), and it’s focused on Caribbean islands. (top of page 3).
http://www.reiner-lemoine-institut.de/sites/default/files/plessmann2012_paper_energy_supply_on_interconnected_renewable_based_islands_in_the_eastern_caribbean_sea_5thired_berlin.pdf
They’re decent enough to put their assumptions in at the back.
And even there, they don’t break down their O & M costs, just providing a lump sum.
It’s interesting to note this paper also sees little need for PV, as wind is so cheap, at least at utility scale.
And geothermal is claimed to be even cheaper.
IRENA has some regional reviews, this one is project case studies of islands in general, though it mentions some projects in the Caribbean.
http://www.irena.org/DocumentDownloads/Publications/IRENA_Renewable_Energy_for_Islands_2014.pdf
Well … if there is any validity to the whole Marie Orsic (her pic is viewable online) and the Aldebaran stuff, that woman could shanghai my sorry, brainless ass to any planet in the galaxy anytime she wants.
Alan, I’m not 100 % familiar with Jamaica, but I put my pencil to it for Cuba. And I reached exactly the same conclusion. The best option seems to be to expand sugar cane, reduce cattle, use some of the sugar for ethanol, burn bagasse, use wind as dictated by local wind fields, build hydro, pumped storage (to use wind excess to store power.
Cuba has a lot more land than Jamaica. This means we can produce and store ethanol to burn in turbines to use when the wind is down. Theoretically, if we add a couple of nuclear power plants for baseload we would be zero net emissions by 2050. But first we got to get rid of the Castro dictatorship.
If you want, run by that business case for a small business, and I’ll look it over. Sometimes one can take advantage of government rules and subsidies which don’t apply at a national level.
How long ago did you run your numbers for Cuba? It is my understanding that while wind power is getting cheaper year by year that solar power is getting cheaper even faster and may soon be cheaper than wind in a lot of places with good sun but only so so wind.
Some people claim solar is already cheaper. I think they are probably right for small scale installations but not for big ones. It seems the cheapest wind project that is large enough to be economical runs into the millions where as you can install solar efficiently in much smaller increments.
Does Cuba have a really good wind resource ? I expect it probably does but not sure.
OFM – check out page 27 on the IRENA report, it shows costs in 2010 and 2014. While PV came down greatly, it’s still (on the average) more expensive than (onshore) wind.
http://www.irena.org/DocumentDownloads/Publications/IRENA_RE_Power_Costs_2014_report.pdf
You’ll see projects range greatly in cost.
Here’s the thing with renewables – they’re all site specific.
A place with no stream and/or no elevation drop – not good for hydro, even if hydro is the cheapest renewable (on average).
A place with greatly variable wind – may not get a wind system built there – not worth the bother.
What you say is true – for $1000 a person can power a small ‘fridge from solar in pretty much all tropical and temperate locations, but small wind is typically more expensive and requires fossil backup.
But big wind, with a grid to shift power around, is often cheaper than coal, though it requires millions of US $ (or equivalent) up front.
Large wind turbines are less than 1 $/Wp in many places (total installed cost just over $1 up to $2.50), but small ones are like $4 to $9/Wp, which is same or worse than solar pretty much anywhere.
Big Chinese wind turbines are down to $0.6X/Wp.
The NREL wind map for Cuba I found shows a few good spots, but mostly moderate.
http://www.nrel.gov/wind/pdfs/cuba.pdf
more international maps at:
http://www.nrel.gov/wind/international_wind_resources.html
Old farmer, I did it two days ago. This was triggered by a discussion we had about biofuels. I think I described how I had helped build a biofuels systems dynamics model, but it wasn’t used for a specific case like Cuba’s.
Jamaica is a fairly small island, it has a mountain chain running down the middle, so it’s very different from Cuba. A wind power set up would have to be designed so it can be shut down and withstand storms and hurricanes, and the shut down period can last several days.
I don’t really worry about solar power kits for a single home, I’m afraid that’s fairly irrelevant when one has to worry about powering a modern society. If you want to obtain the real cost of solar power work it out like this: take a new plant’s capacity, say the 550 MW plant in California. Multiply by the time the sun is available in winter (say 10/24ths). Take that figure and assume you store half of what it produces in a giant battery pack. This 550 MW plant would yield 115 MW. It cost 1.5 billion US dollars, without the batteries. That’s $13k per kW excluding batteries, and expenses. And if this exercise is carried out for a northern location then the derating is much harsher. Daylight hours are shorter, and it’s not unusual to have two solid weeks of overcast (remember the Battle of the Bulge and the siege of Bastogne?).
For Jamaica wind is much better. But in their case the realistic solution is to build a high efficiency coal plant and get a long time supply contract from Colombia. The Germans build coal plants like fast food joints make hamburgers. The Jamaicans are definitely better off copying the Germans.
For Lodges we design for no more than 15% kWh thru Batteries, maximizing nighttime effeciencies if you are able to shift loads like Day Laundry. Invest in the PV side, Size the array for Cloudy days. For Re-sale or Grid, Time of use rates reflect storage costs at night and loads will shift to day. Store daytime production via Hot water, Ice making, Freezers, etc.
Yes, but a country isn’t a lodge. What I do is try to use apples and apples comparisons. And I’m really worried about the dumb incentive plans used by some european countries for solar. I’m ok with incentives for wind up to a point. But I’d rather have hydro and nuclear plants than solar. They just need lower costs, and find a viable storage mechanism.
A wind power set up would have to be designed so it can be shut down and withstand storms and hurricanes
That’s pretty standard for off-shore wind plant.
solar power kits for a single home, I’m afraid that’s fairly irrelevant when one has to worry about powering a modern society.
Take a look at caiso.com. Look at the afternoon peak. Look hard – it’s disappeared. The daily peak used to be noon to 3pm, by a good distance, and that’s gone forever. Why? Customer-side solar power, both on industrial/commercial roofs, and on residential roofs.
It’s big, it’s real, and it’s here.
solar…Take that figure and assume you store half of what it produces in a giant battery pack
That’s highly unrealistic. No one does the analysis that way – at least, not if they work for a utility or an Independent System Operator which oversees the grid.
Batteries and pumped storage would work well to match supply and demand for daily (diurnal) variation, but the sensible storage option for seasonal wind/solar lulls is “wind-gas”.
People get hung up on the capex of batteries and pumped storage, but using those for seasonal storage is like driving a M1 tank to work – they only make sense for diurnal storage where the capex is amortized over thousands of cycles.
Overbuild wind/solar production by, say, 25% above the average demand, and use the excess to electrolize seawater and store the hydrogen the same way you store methane, which is generally underground.
http://en.wikipedia.org/wiki/Underground_hydrogen_storage
That makes the storage incredibly cheap, and the conversion efficiency is relatively unimportant because you’ll only need to draw about 5% of consumption from storage*. Higher efficiency is still valuable, but minimizing capex is much more important than maximizing efficiency.
“wind-gas” is the solution, and other forms of storage are just red herrings.
in their case the realistic solution is to build a high efficiency coal plant
That’s probably better than oil. But, its still imported, dirty fuel.
Not quite 100% but not bad:
http://blog.rmi.org/blog_2015_01_07_a_caribbean_island_says_goodbye_to_diesel_fuel
and:
http://nostsiliconvalley.org/2014/02/17/sustainability-in-the-dutch-caribbean-hawaii-can-small-island-nations-become-energy-independent/
http://www.gea.com/en/produktreport/20120309-00565.html
and a vid from a couple of years ago:
https://www.youtube.com/watch?v=C6oWPXeBW_Y
Rgds
WP
He may be absolutely correct as far as the national grid goes but, the calculations for individual businesses, especially those with high daytime and low night time electricity consumption, point to fairly short payback periods (4 years).
Hey Alan, I looked up a couple of his other papers, he seems to be a pretty typical unimaginative BAU paradigm economist, who probably is unable to even imagine a post BAU world where distributed energy generation by individuals will have advantages over centralized generation and grid based distribution. He seems to be more on Goliath’s side as opposed to David’s.
Cheers!
Solar PV is much cheaper than oil.
Wind is somewhat cheaper than solar.
Solar PV panels are the cheapest thing around *without* installation, and installation costs vary widely. If you can install PV panels very cheaply on your commercial or residential building, that’s the cheapest option.
My PV array totals about 8kW peak. It has served me well winter and summer. At the moment, I have a check from the power company for the power in excess of use we have sent back to them- $ 280.
Wind? Reminds me of the freshman confronted with a list of questions about his alcohol use. None fit, but a combination did:
“seldom” , and “to excess”.
Right now a winter storm is really kicking up a storm out my window.
I have toyed with the idea of a wind turbine for that seldom and to excess situation here. Would have to be real cheap. The idea just sprang into my head– simple, works only in winds like that one out there, whirling every which way, and roaring away advertising its power- just gone with the wind.
Thing looks exactly like a helicopter rotor. Just as strong. Same vertical axis. Pole just high enough to not chop of heads except maybe a crow’s or two a year.
Wind blows, trying to cool me off. Rotor spins, trying to heat me up. Perfect!
Meanwhile, PV.
Nick, I greatly appreciate your efforts at fair and balanced, otherwise, this site might tip over into a bottomless tar pit.
I add a couple of obvious remarks
Unless cost includes environment, it does not count. Comparisons of fractions of real cost don’t make sense at all.
PV is cheap for another reason- anyone can buy just a little bit at a time, and then add to that. I did it that way and felt no pain, but lots of gain.
OFM says he would buy a turnkey system with storage and service. That package, in my view, is near certain to appear at Lowe’s etc in the very near future. Just makes sense, etc.
Alan, thanks for posting this. I’ll open some new mini-posts below to talk about Chinese electricity costs
Alan, what is the typical household monthly use of electricity in Jamaica?
Mr. Patterson, my respect for you has increased exponentially for keeping an open mind regarding this extremely emotionally charged topic. To examine fuller/contradictory views and then to acknowledge a change of stance is so rare an occurrence nowadays and I heartily salute your both doing so and sharing that on your blog. Gerard
Thanks Gerald. I try to keep an open mind. But one person once told me that I was narrow minded because I dismissed the idea as silly that migration to other planets might solve our population problem. I told him that I thought I had an open mind but not so open that my brains would fall out.
A friend just posted me the below:
US diesel is exposed to price competition from foreign buyers at a much higher level than gasoline due to the high export volumes shown in the graph below. Roughly 20-25% of US diesel (under 500 ppm sulfur) production is exported. It is worth noting that prior to the shift from importer to exporter of diesel in 2007 diesel historically sold for a lower price per gallon that regular gasoline. That is no longer the case and it is my view that it will never be cheaper that regular gasoline again. There are a few other issues that have driven the cost higher such as the higher nat gas input to get the sulfur out to meet the ULSD requirements. It is also important to remember that diesel competes in the same part of the barrel as jet fuel and the low sulfur marine fuel market. Anyway just some thoughts on the question you posed today on your blog.
Ron, you will find most of the diesel exporting coming from Valero. Five years ago, they spent billions in gulf coast cap-ex to improve their diesel margins from heavy sour. America was importing diesel from European refiners. Now it going the other way.
I have not saved links but given that trucking has been a part of my ( NON according to most folks ) rolling stone career I have kept up with trucking news to some extent.
The explanation according to some industry people who buy lots of diesel is that the US is exporting diesel and importing gasoline due to shifts in demand for both in both domestic and European markets. Adding in the problems with refiners having to run less than ideal crude oils this is probably enough to account for the price swing .Sounds reasonable anyway.
When construction is down in the US it cuts into diesel sales freeing up some for export and we have not switched to diesel cars en masse the way Europeans have.
Mr. Mason, on June 18, 2014, reporters were summoned to witness tap water set afire at the Castlewood Mobile homes near Linda, California. This in a frantic attempt by residents to have remedial action take (reinstall a methane filtering water system) and forestall another explosion that had occurred there in 2008.
Frac’ing was being done in Colorado, so … not a cause.
Methane seeps are a common happening above hydrocarbon beari g formations, whether drilled or not.
The Truthland and Fracknation works undoubtedly have their biases, but a rigorous, open-minded examination should enable truth/facts to emerge, IF the observer is not too swayed by – what Mr. Patterson’s long ago sage noted – “People believe what they choose to believe”.
Don’t disagree, coffee guy, but just making the point that the oil companies find a half truth (e.g. The film makers should have said methane gets into tap water in these parts) and omit to say that tap water that is safe and clean get s contaminated by fracking – the film’s substantial point remains. And fracking poisons the water.
I think that it is likely that under high pressure, some of the fluids used by fracking does make its way into the water table. I don’t think the concrete casing is 100% secure, I think it will fracture, and the earth is not without flaws through which contaminated water can travel, especially over time.
Pete, I agree that a concrete casing could fracture. But when I watched the “Truthland” video I found out that it was steel, then concrete, then steel again. No, that could not rupture. Perhaps after 50 to 100 years it might rust through, but I doubt it. No, any gas in the water table most definitely did not come from a ruptured casing.
Dag Hammarskjöld once said: “He who wants to keep his garden tidy does not reserve a plot for weeds” I would add that he who wants to keep his credibility does not tell even one big whopping lie.
re casing rupture
FYI – I have the impression that most oil/gas wells only cement at intervals – for a thousand feet +/- up from the bottom of each size casing, and outside the production string, possibly up a ways into the next casing.
The Macondo well casing plan only did a full length cement on the upper two casings, the next 5 only got cement at their bottoms, as did the long string production casing.
Fig 2.1 (page 50) of
http://ccrm.berkeley.edu/pdfs_papers/bea_pdfs/dhsgfinalreport-march2011-tag.pdf
There are plenty of places for a string of casing to leak – ask any plumber who’s ever screwed joints of pipe together.
And never mind the subsurface casing hangers if they’re used.
AFAIK, the only wells that are routinely cemented solid annulus bottom to top of hole are geothermal wells, but that’s mostly to keep the thermal stresses from buckling the casing(s).
Sunnnv,
All surface casing that effect aquifers are fully cemented. The only place I have been where all casing strings are fully cemented by law, is Russia. That is to do with the permafrost. They need as much insulation as possible.
Buttress threads which are used on non production casings are just screwed together and made up to the required torque.
All the production casings, use a premium thread, which has a metal to metal chamfered sealing face. These joints are JAMed. “Joint Analyzed Make-up”. They measure the torque build up in the last 1/8 of a turn, to where the seal face is engaged. This is a guarantee that the seal faces have come together correctly. Every joint is graphed, and saved. The resultant data put into the well file for future reference if there are any issues.
The one thing I have to say, there has been so much uninformed hype about fraccing, it has been insane. Good to see people are finally looking at the areas that maybe cause of concern. Also don’t forget the waste disposal trucks, returning to the well site earlier than expected. Cement bond logs would be another area to look at, to confirm or easy any worries.
Why the frac companies have been allowed to get away with not putting out an ingredients list, I don’t know. They may have thought themselves smart by getting this through government, but in the long run, I believe it has hurt their cause. It is much easier to be afraid of the unknown, then the known.
In Oz we had a “big” incident with a fracced well. There was a recording of 1 PPB (Part per BILLION) of BTX. Crazy because if someone bothered to check out on the road in front of their house they are guaranteed to get higher readings. The case went to court, the company agreed to pay a nominal fine as they could not afford the court case, and the company finally went bust. Ironically the 1 ppb, most likely came from the formation and not the frac fluid, but when emotions get involved, fact go out the window.
Why the frac companies have been allowed to get away with not putting out an ingredients list, I don’t know. They may have thought themselves smart by getting this through government, but in the long run, I believe it has hurt their cause.
I totally agree. They have acted as if they have something to hide, so people who don’t want fracking near them assume they are hiding something.
BTX?
NAOM
My apologizes NAOM
http://en.wikipedia.org/wiki/BTX_%28chemistry%29
BenzeneTolueneXylene
Ah, thanks. Googling did not help me as there are a lot of different BTXs.
NAOM
Ron,
I offered to discuss potential leak pathways in a previous comment. As you mentioned, a leak through two strings of steel casing is somewhat unlikely. usual practice is to put a full column of cement outside the outer string to protect the fresh water zones. The inner string to outer string annulus is usually cemented, but that’s a variable (it depends on local regulations and the well design). This means it’s possible to have the inner casing burst, and the pressure is seen at the base of the outer string (the base is the casing shoe). This pressure can fracture shallow rocks rather easy. But the pressure is also seen in the annulus at the wellhead. This pressure is monitored. As soon as the annulus starts showing pressure the pumps have to be shut down.
This would be considered a major incident, the well would likely be filled with cement and a report filed with authorities. Lawsuits may be filed with the steel supplier, and a couple of people would get punished, demoted, or fired. In other words, a burst casing during a frack job is a major incident, it is reported, investigated. And the frack fluids aren’t allowed to flow just anywhere.
And if the incident is hidden…then how the heck is the well going to produce when the frac fluids headed the wrong way? This can be thought through a little more, but I think you are right, the whole Gasland set up is more fiction than fact.
Fernando, you are talking about a potential problem where no problem currently exist. Now it may happen years from now but no evidence has ever been found of it happening now.
How Anti-Fracking Activists Deny Science: Water Contamination
This site contains a dozen cases where various state and federal agencies have tested for ground water contamination and found none.
The flaming faucets case was an outright lie. They were doing that long before fracking was happening. But it made the perfect media event. I am shocked that some people commenting here fell for such a cheap trick, and that includes myself. I fell for it also. And now that really pisses me off.
Now what really shocks me is some still believe it even after that cheap trick has been exposed. I guess some people want to believe something so strongly that they do deny science.
pete, the wells are cemented using oil well cement. We don’t use “concrete”. I take it from your comments you are unfamiliar with well design. Would you like an overview?
Fernando, you raise a good point regarding oil/gas well construction and the incredibly sophisticated engineering that goes into both the design and developing of these wells.
There are numerous sites on the net that have graphics and text that describe this process. Interested observers may find these sources useful educational tools.
Coffeeguyz, I flinched when he mentioned concrete. I don’t follow independents’ practices, nor can I vouch that some companies lack sound engineers, but I was taught to make sure we pressure tested casing before the cement was pumped, took cement samples prior to and during the job at random intervals, ran the cement quality well logs, and monitored the annulus to make sure we could identify leaks. One of the most stressful jobs I had was signing off on cement job quality. Nobody in their right mind wants a leaky well.
“Man prefers to believe what he prefers to be true.”
― Francis Bacon
Well, thinking of Bacon and the scientific method, I thought there had been a scientific assessment or two that supported claims against the very powerful fracking industry, but I’ll have to leave it to another day. Keep up the good work Ron,
Cheers,
pete
Mr. Mason, if one were to google ‘fracking studies’, about a gazillion pop up.
This past fall, two of the more extensive, seemingly sound studies announced their findings. One was from the US Department of Energy, the other a consortium of universities, including Duke, Stanford, and Dartmouth. Both studies found no harm or contamination whatsoever to aquifers from hydraulic fracturing. The Duke report was somewhat noteworthy in that the university had taken an ‘anti frac’ing’ stance in prior public statements.
Where I think communities have legitimate concerns (which aren’t disputed given what is going on in the Bakken) are noise, dust, wear and tear on the roads, increased traffic accidents, and so on.
Suburban communities don’t like becoming industrial zones, particularly if most of the home owners don’t receive any financial benefits from the disruptions.
Exactly. I try to focus on your list. If the BS about flaming tap water didn’t distract people they could focus on the proper concerns. Gasland did a lot of damage because it got people looking in the wrong direction.
Thanks for the reminder coffee.
I did have to go check it out – memory said they hadn’t given fracking a squeaky clean bill of health.
Duke’s site:
http://sites.nicholas.duke.edu/avnervengosh/duke-study-on-shale-gas-and-fracking/
A representative study:
http://sites.nicholas.duke.edu/avnervengosh/files/2012/12/PNAS_Jacksonetal2013.pdf
results:
some number of homes < 1 km from a gas well have much higher levels of methane, ethane, and propane, and helium.
This indicated thermogenic source (not biological in shallow aquifers), since no microbes make ethane and propane in any quantity.
Why are these gases found in wells close to fracked gas wells?
Their conclusion: bad cement jobs and bad casing.
Fracking itself seems to be blameless – as far as they know.
"Casing leaks can arise from poor thread connections, corrosion, thermal stress cracking, and other causes".
…
"… sustained casing pressure from annular gas flow is common. A comprehensive analysis of ~15,500 oil and gas wells (43) shows that 12% of all wells drilled in the outer continental shelf area of the Gulf of Mexico had sustained casing pressure within 1 y of drilling, and 50-60% of the wells had it from 15 y onward."
…
"… we propose that a subset of homeowners has drinking water contaminated by drilling operations, likely through poor well construction."
So coffeeguyzz is right – no harm due to (the actual) fracking, the harm (demonstrably) done to the aquifers is done during/after drilling the hole that will be/was used for fracking/production.
Hmmmmmm….
Anyway, the latest is that using other inert gases in conjunction with the hydrocarbons, they now claim to be able to tell the difference between cement failure and casing failure (at least in the Marcellus)
http://www.pnas.org/content/111/39/14076.full.pdf?with-ds=yes
Interesting – wonder what the next 100 years of mass spectrometry will bring?
Sunning, a steel casing failure probability is extremely low. The failure mode is usually a small annular leak channel in the space between the steel casing and the cement sheath.
If I were investigating this issue I would simply find out if they have or had wells in the area. In the old days the cement quality wasn’t checked the way we can check today. If they had old wells those are the most likely leak points. I remember reading one of those Yale reports and it seemed to me they just didn’t know where to look. They had an incomplete product.
I agree that cement is far more likely to fail than the casing,
but that casing leaks (from joints, pump rod wear, hard coat on drill pipe, corrosion, etc.) are not unknown.
As to old wells, from the 2013 study:
http://sites.nicholas.duke.edu/avnervengosh/files/2012/12/PNAS_Jacksonetal2013.pdf
down at bottom of page 5 left column:
“In 2000, the Pennsylvania DEP estimated that it had records for only 141,000 of 325,000 oil and gas wells drilled historically in the state, leaving the status and location of ~184,000 abandoned wells unknown (47). However, historical drilling activity is minimal in our study area of north- eastern Pennsylvania, making this mechanism unlikely there.”
Did you guys ever coat your casing with epoxy and grit to make the cement bond better, or has that gone out of use?
Sunnnv, I cannot speak for the casing in oil/gas wells, but the numerous jobs in which I participated that had steel “I” beams or pilings in water surroundings usually had epoxy or creosote coating. They were then enclosed in a form, usually wood or fiberglass, and cement pumped in in thickness ranging from 4″/10″ or so. The seement would then be epoxy coated.
But that’s old wells, not brand new wells with casing designed to take a high pressure frac job. These guys are proposing the frac fluids are somehow creating a shallow failure. Read up the thread where I described how this happens.
An old well is a different issue. And I bet some of the gas in those shallow zones is leaking through 100 year old wells cased with seamed casing. Can you imagine the junk steel they must have used say in the late 19th century?
I came across this presentation, don’t think it has been posted before.
Some very interesting calculations and break evens for different prices and IP rates. Basically at around current prices they need $7mil wells with > 800bpd IP
It then has this table stating expected rig count at certain prices. But it is the expected drilling rate that got my attention.
eg 140 rigs to drill 3800 wells per year = 27 wells per rig, or 13.5 days per well!
I find that incredible. I am not saying it is not possible to drill a well in 13.5 days, you do have those perfect wells, but an average of 13.5 days is a whole new ball game.
If these are the type of assumptions that oil companies are basing their production figures on, then in my opinion they could be in for some disappointment.
BTW, at $45 wellhead price, and 120 rigs drilling, oil production is in a downward slope!
https://www.dmr.nd.gov/oilgas/presentations/HENR010915.pdf
North Dakota Challenges & Opportunities Page 44
Page 49
$/BO ,,,,,,,,,,,Rigs ,,,,,,,,New Wells,,,,,,,,,,,BOPD,,,,,,,,,BOPD,,,,,,,,BOPD
,,,,,,,,,,,,,,,,,,,,,,,,,,,,,,,,,,,,,,,,,,,,,,,,,,,,,,,,,,,,,,,,,,,7/1/15,,,,,,,,7/1/16,,,,,,,7/1/17
,
$25,,,,,,,,,,,,,,, 40,,,,,,,,,, 1,100,,,,,,,,,,,, 1,000,000 ,,,,800,000,,, 700,000
$35 ……………90……….. 2,400……….. 1,030,000 ….875,000…. 720,000
$45 ……………120 ………3,200 …………1,100,000… 1,050,000 ..975,000
$55 ……………140…….. 3,800……….. 1,200,000 ……1,200,000. 1,150,000
$65…………… 155…….. 4,200 ………..1,200,000…… 1,225,000… 1,250,000
$75 …………….170………4,600 ………..1,200,000…… 1,300,000 ..1,400,000
$85…………… 190 ………5,000 ……….1,250,000 …….1,400,000 …1,550,000
We have had discussions about that table starting about a month ago when it first came out. I know there are some comments in this entry.
Anyway, what was concluded is that the “new wells” column most likely is supposed to represent the dates shown in “BOPD” columns: that is, July 1, 2015 – July 1, 2017. This makes sense because the table, and presentation, was prepared for the legislature to aid in the development of the next two-year budget for the state of North Dakota. The state’s fiscal year always starts on July 1 and two-year budgets always start and end in odd-numbered years.
Thanks Reg,
So the numbers wells drilled column seems to be, wells drilled from July 2015 to Jul 2017. I took it as per year.
So around 27 days per well sounds a lot more reasonable, though some of the oil companies will be telling their investor, they can drill faster than that, smiles.
Not just drilling. Drilling and completing. The long pole in the tent is fracking pumps, not drill rigs.
Watcher,
The frac and completion, certainly does seem to be the hold up at the moment, but we do not have good numbers on what is happening, so it is hard to follow. How many wells have been drilled, logged and they realized the well is no good to marginal. It could be put on hold for later consideration, but we are left thinking it is just waiting for a frac truck to turn up. Some companies have stated they don’t frac in winter, wait for warmer weather. This may especially true this year as winter fracing is more expensive, an they will be trying to save every cent they can.
I have always felt the long wait list for fracing must be more than just logistics, but not being there I do not have understanding why. The only thing I can really think of, operationally was with their pad drilling. If they had to wait for the drilling rig to move off location before they could bring in the frac spread, and then frac all the wells in one go? I am not sure if this is the case, ast the wells are spaced out far enough, that I would have thought this would not have been a problem.
Tool push, they could be waiting to have the well samples and logs from a group of wells, to plan the fracture treatments. That’s what I would do. The fracture programs can be prepared, the details worked out, and they can use the space more efficiently.
What we should monitor is the difference between new wells and decline in legacy wells in the drilling reports
http://www.eia.gov/petroleum/drilling/
Attached a simple graph
You mean new production from new wells and legacy declines (declining production from old wells)?
Yes, when the 2 curves in above graph meet, growth will be zero
This is a really good way to show it. I know this will sound crazy, but I had managers in a very large oil company come by my office and ask casually why didn’t we ramp up production by 10 % over our yearly forecast. It took time to explain how this works, even to people who should have known better. These large fields with thousands of wells have a huge amount of “production inertia”, and once those two curves meet it takes moving heaven and earth to make sure they don’t cross all the way. It’s usually impossible.
Oil inching up towards $60. Looks like all those people who predicted $20 oil or never having $100 oil again are looking pretty silly now.
As per Yogi … ‘Makin’ predictions is tough … especially about the future’.
Making predictions is easy, it’s making good ones that’s the hard part.
Fundamental predictability is mathematically impossible.
Predicting oil prices is certainly impossible. But it is not impossible to understand how the price of oil relates to other parts of the system. If that understanding is reasonably accurate, then generally forecasting the behavior of the overall system becomes possible.
Critical dependence on initial conditions means we can never know enough details about the system to make any exact predictions. But if we have good historical data, and can correctly understand the fundamental relationships amongst the various parts of the system in general terms, we can model the system algorithmically. We can’t make any exact predictions this way, but we can make some good general ones.
Limits to Growth did this, and, 40+ years later, their model has proven to be frighteningly accurate.
The future is not so much unknowable as it is unthinkable.
Hello Anon.
You said:
Oil inching up towards $60. Looks like all those people who predicted $20 oil or never having $100 oil again are looking pretty silly now.
People who predicted $20 oil never predicted that the price could never rise.
People who predicted never having $100 oil again (not necessarily the same people who predicted $20 oil) have yet to be proven wrong.
Although spot oil improved, the futures contract for December 2017 declined to 66 USD per barrel. Contango decreased also substantially, which makes it more expensive to buy oil now and store it. It is to early to have a final judgement about oil prices. In my view oil prices will be declining another leg until summer as the segmentation of the oil market has significantly changed.
The dollar has been under extreme weakness pressure the last 2 weeks as Europe persuades itself Syriza will fold and drives the Euro up, taking the yen and pound with it.
Oil rises as the dollar weakens.
Watcher,
I see it the other way around: the dollar weakens when oil rises. The reason is the trade balance of mostly China and Japan. When oil rises, there is less surplus trade balance available to buy Treasuries. As China has to buy more and more oil, it has to sell Treasuries to buy oil. For the future of the dollar this is very scary.
Hello Heinrich Leopold.
I don’t know if the exact reasons you listed make sense or not, but I think you are correct that the price of oil is the underlying driver of the strength of the dollar. It really is a petrodollar.
The real cost of energy drives all other factors in the economy (and politics and culture). Although economic and political events can also cause movements in the strength of the dollar (which can feed back to effect oil prices), the real prime mover of the system is the cost of energy.
As the system looses stability, it gets much harder to predict anything. But at least the laws of physics don’t change.
I want to thank Ron and Dennis for all the data they put up here. I used their information, and the material the others post on economic issues, to steer my decision to buy into the market in late January. So far, so good.
“After December High, North Dakota Oil Output May Stall
Lynn Helms, the state’s head of Department of Mineral Resources (DMR), said the December figures were “encouraging,” but warned they may not be bettered anytime soon. The number of rigs drilling for oil in North Dakota could shortly dip below 130, the level Helms previously estimated was necessary to maintain output at around 1.2 million bpd.
“It all depends on oil price and rig count,” Helms said during a conference call. “Oil prices are beginning to recover, but the rig count is still down. In the short term, we’ll maintain production at a little over 1.2 million barrels per day.”
Helms added that “significant” growth could occur next year.”
http://www.rigzone.com/news/oil_gas/a/137222/After_December_High_North_Dakota_Oil_Output_May_Stall
Meanwhile, well completions increased to 173 in December from 48 in November. Producing wells in the state reached a new record of 12,124 in December versus 11,951 in November.
So now we know. 173 wells were completed in December. And “wells awaiting completion” were down by 25. That means 148 wells were drilled in December. Of course those numbers are not exact. There had to be a lot more than 48 wells completed in November else production would have dropped considerably.
The latest North Dakota rig count, according to Baker Hughes, was 123, below the alleged 130 units needed to maintain flat output.
However the remaining 750 wells waiting on completion services (as of the end of December) should support Bakken production even with significantly lower drilling activity.
I am not sure but I think Baker Hughes was not counting MIRU rigs. (Moving In Rigging UP). The rig count given at: ND Current Active Drilling Rig List has to be correct because it list each rig counted, who is leasing it, its location and the well number it is working on.
Yes Ron,
As I have said earlier, BHI has a stricter definition of active drilling rigs.
Ron.
I don’t think we can assume the DMR are 100% correct. EOG, one of the gun oil companies, has 4 out of 6 of its wells dated 2014. Continental has one well that has been MIRU for a couple of weeks.
I am not sure of the consequences to a company if they do not report or report inaccurate information, but it seems some are not playing ball?
Well that may be the case but each rig on the list is assigned to a permit number. This permit number is assigned to a specific spot on the ground by a longitude and latitude number. It cannot be moved. So if that well is ever drilled it will be drilled by that rig.
Yes, it is true that some wells take a lot longer to set up than others. If they are located in the badlands then dirt must be hauled in to build a platform on. And even a road may have to be built. This may take several weeks.
The point is I really don’t the companies are outright lying here. They may take a lot longer to set up are longer to drill. But I do believe the rig data is legitimate.
Ron,
Never an accusation of out right lying, just they seem to delay reporting until they leave the pad, rather than they leave the well?
“Total CEO Says Cheap Oil Will Prevent US Energy Independence
The chief executive of French oil major Total said the United States will not reach its aim of energy independence as the drop in oil prices will hit American shale oil producers.
“It is not true the U.S. will be independent in oil, they continue to import,” CEO Patrick Pouyanne told CNBC in an interview on Friday.
“Yes, production in the U.S. has increased from 6 million to 11 million barrels (per day) but the U.S. consumes 18 million barrels and part of the oil is coming from (the Middle East),” …
Total’s Pouyanne said the rapid decline in the number of rigs drilling for oil in the United States, which fell to the lowest since December 2011 last week, was a sign that U.S. production would quickly adjust to lower prices.
The weaker oil price, which has more than halved since June, would also have a particular impact on leveraged independent oil and gas producers, he said.
“Most of these shale developments were based on big borrowing, you know the big banks, cheap money, we have plenty of money as interest rates were very low,” he said. “I think it’s like a bubble there which is just exploding, it will have an impact.”
The French oil major, Europe’s second-biggest oil company, took a $6.5 billion impairment in the fourth quarter, mainly on its North American shale gas and oil sands projects.”
http://www.rigzone.com/news/oil_gas/a/137226/Total_CEO_Says_Cheap_Oil_Will_Prevent_US_Energy_Independence
Have read argument from pundit that US rig reduction not important, in part, because vertical rigs are a non-factor in this new era, and much of reduction is in vertical oil rigs.
Doesn’t that mean that US decline rate will continue to steepen? Also, doesn’t that mean long term higher prices, given drilling costs for horizontal?
US horizontal rig count is down 347 units, or 25%, from November 2014 peak levels.
Combined vertical and directional rig count is down 260 units, or 44% (but they peaked in September).
These are numbers for oil and gas rigs. I guess that the number of horizontal rigs drilling for oil has declined by more than 25%, which is still quite significant number.
Judging by their guidance, companies are planning to reduce the number of active rigs by mid-year. However if prices recover to $70/bbl levels, companies will likely return some of iddled rigs.
Anybody who thought the USA could reach energy independence on the back of fractured horizontal wells must have been smoking rolled up EIA reports?
I think diesel prices started to rise because they mandated it to be low sulfur and it costs more to make. I don’t know the precise year but it’s in the range.
Good point! I drive a diesel and the exhaust sure smells good compared to diesel 10-15 years ago. It doesn’t put out soot either.
US Shale oil and NG production data,,
Monthly projected production decline as a percentage of new production. e.g. In the Bakken in Feb, the projection is that if there is new oil production of 100 bpd, there will be a production decline in the older wells of 83.3 bpd giving a production increase of only 16.7 bpd.
How long to zero growth?
Field OIL NATURAL GAS Jan 2015 Feb 2015 Jan 2015 Feb 2015 Bakkan 76.7% 83.3% 74% 85.1% Eagle Ford 84.2% 89% 76.3% 78.6% Haynesville 100% 100% 76% 71.6% Marcellus 75% 75% 75% 78.4% Niobrara 82% 92.6% 79.1% 87.2% Permian 62% 69.7% 66% 73.1 Utica 66% 33% 38% 40.7%Amvet, I tried to reformat your data to make it readable. It is still not perfect as the formatting program is not perfect either.
I think you got these decline rates from the EIA’s “Drilling Productivity Report”. Some people claim that their decline rates are too high but I think they are pretty close.
Hi Ron,
You can use the actual NDIC data to check what the legacy decline is in the North Dakota Bakken. I do not have good data for Montana on a monthly basis (the DPR includes both Montana and North Dakota as you know, but others may not).
If there were 173 new wells brought online in December then the new wells in the Bakken/Three Forks of North Dakota produced about 98 kb/d in December. Production was up 39 kb/d, so legacy decline in December was about 59 kb/d.
If the number of new wells added decreases, then legacy decline in kb/d will decrease as the output from new wells also decreases. Even with pretty conservative assumptions(new wells added decrease to 120 new wells per month) output could continue at present level until 2017 and then rise slightly to 1200 kb/d around 2019 in the North Dakota Bakken.
Dennis, the problem with this that 173 wells completed in December is a totally unreliable number. Do your math with the 48 wells completed in November and you will likely get a number you cannot believe.
Hi Ron,
The 48 from November is wrong, I have looked at the NDIC well data and about 175 new wells started producing in November. Also there is month to month variation in the well productivity so three month averages are better to smooth out this noise in the data. I have not checked the December data yet, to verify the 173 estimate for december.
Dennis, of course it’s wrong, that’s my very point: The 48 is wrong and the 173 is just as wrong. We can place no confidence in either number. How can you quote one number as if it it is accurate while dismissing the other as being totally wrong?
After December High, North Dakota Oil Output May Stall
Quoting Helms:
Meanwhile, well completions increased to 173 in December from 48 in November. Producing wells in the state reached a new record of 12,124 in December versus 11,951 in November.
Hi Ron,
In the past Helms has not been very far off. I checked the November number and it is wrong. I am assuming the December number is pretty close, but haven’t has a chance to check out Enno’s data yet from December.
Natural gas (methane) was first reported in
southeastern North Dakota in 1892 in an artesian
well producing from the “Dakota” Formation
sandstone. Methane gas was obtained from many
artesian wells in a belt extending south from
Jamestown to Merricourt. The gas was used for
lights, cooking, and heating at Edgeley. It
apparently occurred in an unsaturated solution with
the artesian water and, as the water pressure was
released when it flowed to the surface, the gas was
collected in tanks.
Another early gas discovery was made in
Bottineau County in 1907. In the Fifth Biennial
Report of the North Dakota Geological Survey,
published in 1912, John Barry (NDGS, 1907 -1908)
noted that gas had been struck on the Parker farm,
nine miles south of Westhope on July 3, 1907. The
gas came from a 19-foot-thick sand bed at the base
of the glacial deposits, at a depth ranging from 175
to 210 feet. Six-inch casing was used. When the
first well was opened, sand, small rocks, pieces of
lignite, and twigs were blown out forming a dune
100 feet in diameter and six feet high around the
well. The initial pressure was 64 psi, but this soon
declined to about 20 psi. Barry also noted that
Lansford, in southwestern Bottineau County, was
supplied for a time with gas piped from wells
located five miles to the northeast.
Nobody seems to have a lot to say about WHY the Fracking crews are so far behind in ND except for weather.
I am wondering if it has to do with a shortage of the equipment needed.
There are a lot of oil rigs in the world and moving a few dozen of them to a new spot would not be a big problem in terms of the supply of rigs.
But Fracking uses some stuff that may have very few and very limited use on other jobs if it has any other use at all. When I try to think of an ADDITIONAL use for a huge portable pump capable of the volumes and pressures used in Fracking I draw a blank. Ditto the pressure lines and all the associated hardware.
So -My guess is that this stuff is manufactured in VERY limited quantity. Assembly line techniques would not apply very well since there would not be enough volume.
Any opinions or input from somebody that knows more will be appreciated.
It seems likely to me that anybody building such machinery probably builds it one unit at a time to order about the same way a very large boat or ship is built. So – people might be reluctant to buy more of this stuff than they KNOW they have work for a long way ahead.
This brings up a thought about the very fast continued ramping up of solar and wind manufacturing capacity. This fast manufacturing growth is necessarily going to taper off very fast indeed once the INSTALLED capacity of each starts catching up with the ability of buyers to pay for it in such enormous quantities and utilities to adapt to so much new additional intermittent power.
The BUSINESS and engineering ” rules” involved in exponential growth are as applicable to renewables as anything else. But there is still room for exponential growth in renewables for a good long while – maybe as long as a couple of decades?
“Nobody seems to have a lot to say about WHY the Fracking crews are so far behind in ND except for weather.” Perhaps fracking some is being deliberately deferred by some companies owing to low oil prices. Why bring a high decline rate well on line when your oil will fetch a low price, assuming you can afford to wait? There a probably a zillion reasons this is flawed logic! Watcher?
Shit, my kingdom for a text editor. Or maybe, speaking of deferrals, maybe I should just drink more coffee.
Hi Doug,
I think that is the best explanation for why wells waiting on completion has risen from 600 to 750. Maybe we are both wrong, but I agree with your assessment.
Here is one company stating they are holding back on completing well due to poor oil price, which I posted on the last thread.
WPX expects its oil production to climb again in 2015. The company is targeting 15 to 20 percent oil growth this year even as it decreases capital spending and builds an inventory of wells awaiting completion for when commodity prices are more favorable.
http://www.noodls.com/viewNoodl/26894084/wpx-energy-inc/wpx-aligns-capital-plan-with-operating-cash-flow#sthash.gfcl5Fva.dpuf
Deferring Fracking in hopes of getting a higher price for that first few months of very high production makes good sense.
But it seems to me that the Fracking crews were way behind even before the price crash. Of course I could be wrong about that. In any case I am still wondering if the specialized equipment using in Fracking is so specialized it is seldom if ever used for other purposes..
I have to capitalize ” Fracking ” to stop the spell checker changing it to tracking.
Before the price crash there were 650 wells awaiting fracking crews. Now there are 750.
OFM,
You mean those Fracking spell checkers? lol
Frack pumps are design for fracking/cementing . Here is a link on Haliburtons latest.
http://www.halliburton.com/public/pe/contents/Data_Sheets/web/H/H09160.pdf
The industry standard, used to be the HT-400 or equivalent, from BJ or Dowel. That was in the days, when they were usually used just for cementing. I am sure the early fracs were done with HT-400s, and I have been on one rig that had a Q10 for cementing, so they are interchangeable in use, just one is for greater volume than the other.
There are plenty of other oilfield triplex pumps on the market, but usually they are for lower pressures. Drilling mud pumps are rated at 5000 or 7500psi, where as frac/cement pumps are usually 10,15 for 20,000 psi.
I meant to add this as well Ht-400
http://www.halliburton.com/public/cem/contents/Data_Sheets/web/H/H04798.pdf
cash to pay for proppant may be getting scarce. I’m gonna go with that rather than a smug choice to choke and save high IPs for higher cash. The loans that drilled and bought the lease and pay for people have to be repaid on schedule whether they frack or not, at whatever price.
More likely they aren’t dong any aloof and cold evaluation of maximizing revs by waiting for something that may not happen. More likely the spigot of financing is getting twisted.
Perhaps as much as 10% of oil consumption is for electrical generation in Japan, Saudi Arabia, Hawaii, Chile, India & China, etc.,etc.
Solar PV is clearly cheaper than oil generation – there’s a lot of pent up demand there, and as PV falls in price it keeps opening up new markets.
OFM, If you look at the above listed pricing data showing Nov. pricing @$60, Dec. @$40, Jan. @$31, one may get the drift of what is happening .,. especially since the first 90/120 days produce a highly disproportionate amount of total production from these wells.
In Brazos county Tx, we have had natural gas in our water wells since I was a kid in the 60’s- long before the first oil wells started getting drilled in Kurten on the other side of the county.
Fill a glass with well water and it will be opaque white for about 20 seconds until it all fizzes out. Imagine the fun when my grandmother showed us it would light! Beautiful blue wispy flame for a couple of seconds.
What more could a poor farm boy ask for as far as free entertainment?
Mr. Peabody’s Wayback Machine still works!
Here’s the skinny:
In the more than 60 years following those first treatments, more than two million fracturing treatments have been pumped with no documented case of any treatment polluting an aquifer – not one.
And:
The first commercial hydraulic fracturing of an oil well took place in 1949 about 12 miles east of Duncan, Oklahoma.
http://aoghs.org/technology/hydraulic-fracturing/
Halliburton started the fracking craze way back in 1949.
Doesn’t the fracking take about four to five hours? A day, allow travel and preparation time.
8 hours times 750 wells to be fracked, it will be 6000 hours of time to do the fracturing. Not an insurmountable task to complete the 750 wells.
Fracking time depends on several things but it primarily depends on the number of frack stages. I have read, several times, that it takes about 3 days. And in another place that it takes from 2 to 5 days. But no well could be fracked in five hours unless it had only one or two frack stages.
I can’t remember where I read the information on the length of time for a fracking from start to finish, but the information was incorrect. I stand corrected.
“On average, it’s a process that takes about three to five days to complete start to finish. Once the fracturing operation is done, the well is considered “completed,” and is now ready to produce oil and/or natural gas for years, even decades, to come.”
http://energyindepth.org/just-the-facts/
Have you run across any data on the energy needed to pump the water for fracturing?
Nick,
Here is some data for you. The link is mainly about Natural gas usage but it gives you usage numbers for diesel plus a lot of other interesting details.
http://gekengineering.com/Downloads/Free_Downloads/Final-Technology_To_Save_You_Millions_CNG_LNG&MFHW-George_King_5Feb2014-NAPE.pdf
Haliburton’s main line frac pump is the 5 cylinder Q10, and is often driven by Cat 3512. So here is some info on the 3512 and the Q10
http://www.avesco.ch/fileadmin/dateien/ESYS/Dokumente/Datenblaetter/2013_11_CAT/CAT_EN/CAT_3512B-1500_EN.pdf
http://www.halliburton.com/public/pe/contents/Data_Sheets/web/H/H09160.pdf
Remember there can be 10 to 20 or more, of these frac trucks hooked up in line.
Ronald, I’m not sure how they do it in these days, but I’m familiar with the way it has been done in the past. The frac job requires a lot of water, sand, and additives. These have to be blended and pumped. When one of these jobs is supposed to take place we have to prepare sketches to make sure we know where everything is supposed to fit and get hooked up. And all the piping has to be tested. Some of this piping has a very high working pressure, and it takes time to make connections, and then fill the lines with water and pressure test. Some of these lines have to be chained to make sure they don’t fly around, and on and on. So the time it takes to mix and pump is just a small part of the process. In my case a large frac could take 9 months.
THE PRICE OF OIL ISN’T JUST ABOUT SUPPLY AND DEMAND ANYMORE. IT’S ABOUT DEBT.
https://ca.finance.yahoo.com/news/price-oil-isnt-just-supply-223100001.html
“…Against this background of high debt, a fall in the price of oil weakens the balance sheets of producers and tightens credit conditions, potentially exacerbating the price drop as a result of sales of oil assets (for example, more production is sold forward). Second, in flow terms, a lower price of oil reduces cash flows and increases the risk of liquidity shortfalls in which firms are unable to meet interest payments. Debt service requirements may induce continued physical production of oil to maintain cash flows, delaying the reduction in supply in the market…”
Doug,
Nicely done. Yes, it is true, DEBT will destory the Great White Shale Hype. CLR- Continental Resources spent approximately $5.6 Billion more on CAPEX than they made in operating CASH FLOW from 2011-2014.
Continental has total liabilities of $9.8 billion. It’s market cap is $17 billion. For Continental to be able to pay off its current liabilities, it would need a positive FREE CASH FLOW of at least $500 million a quarter for nearly 5 years straight….LOL.
How is CLR going to do this with the price of oil down at $52? Or how is it going to do it even at $100 when it couldn’t show a positive FREE CASH FLOW when prices were higher?
The entire U.S. Shale Oil and Gas Industry is going to vaporize at some point. Of course, it won’t be 100%, but 70-90% is good enough.
steve
The entire U.S. Shale Oil and Gas Industry is going to vaporize at some point. Of course, it won’t be 100%, but 70-90% is good enough.
That’s my primary concern as companies push into fracking areas which don’t want them. The oil industry has spent a lot of money lobbying to convince local citizens that they should be allowed to drill in certain areas. I am concerned that the bottom will fall out, the local communities won’t have gotten much out of it (or will have been negatively impacted), and then the communities are left holding the bag for whatever damage or disruption has been caused.
The oil industry has not been pleased when it runs into a go-slow approach from communities, but I think that approach is better for the communities and might be better for the oil industry, too.
Boomer II,
I don’t remember where I heard this, maybe from Deborah Rogers at the EnergyPolicyForum.com. The state of Texas brought in something like $1 billion in tax revenue from shale oil and gas over the past several years.
However, road damage due to the huge fleets of fracking trucks caused something like $4 billion. So, how worthwhile is Fracking…LOL.
steve
Hey Boomer,
Is this what you are caught up in?
http://www.denverpost.com/business/ci_27522307/drilling-rigs-and-housing-development-face-off-colorado
Powered by the ability to drill 2-mile-long horizontal wells and release oil from hard shale with hydrofracturing, or “fracking,” drilling rigs are pushing closer to homes.
At the same time, suburbs are sprawling onto the plains — the six Front Range counties where drilling has occurred added nearly 105,000 residents between 2010 and 2013 — and at the edges, houses and drill rigs collide.
Just to show how things can happen. It may surprise you to hear that oil companies are merrily drilling away in downtown Beverly Hills. Yeah where the rich people live. They have been doing it for 100 years!
http://en.wikipedia.org/wiki/Beverly_Hills_Oil_Field
Now the oil companies have made quite a few concessions, to be allowed to continue drilling there. But I feel the main difference between Denver and Beverly Hills is, “Since many of the residents of the area own the mineral rights to their properties, they are entitled to royalty payments from the oil produced from underneath their land. In 1975, there were 6,200 individuals getting such payments”.
Amazing what a difference money makes!
The point I am trying to make, there are always work arounds that can keep both sides happy, if both sides work to a common purpose. Either side can stick their heels in both sides end up being screwed.
Just as a side note on the Beverly Hills drilling. These days they have sound proof buildings by the look of things, but back in the 1970/80s, I don’t believe they did. So they had rubber laid up the V door, so the pipe would not make any/too much noise, and the blocks had to stop so the derrickman could put the pipe into the elevators quietly. I am sure there were other practices they had to follow, but that is just two that I had heard about. No doubt the sound proof building started to look cheap in the end.
Push, if you check out the THUMS production platforms right off Huntington Beach, CA, you might see an amazing display of ‘can’t we just get along?’.
In Colorado, the folks on the Western Slope are very proud and determined to continue to allow hydrocarbon development that is considerate and minimally disruptive to the residents. Those guys are quick to needle their Front Range neighbors for responding in a strongly emotionally-driven manner in these matters.
Yes.
Fracking has moved into the suburbs. What’s gone on in the Bakken is a model that isn’t welcome across the street from schools and housing developments. Therefore, if there is any risk of a boom and then a bust where companies leave disruption and then don’t stick around long enough to pay for any damage, it might be better for them not to have started in the first place.
Colorado has seen many boom and busts over its history. And the oil boom and bust in the 1980s was devastating to the local economy.
Colorado, for much of its history, was a resources driven state (and where that wasn’t happening, ranching and farming were happening). Having learned from its past, the state worked hard after the oil bust to diversify. So now the oil and gas industry has to co-exist with housing, farming, tourism, high tech, and so on. People in Colorado have the Bakken as a model, and that isn’t what they want. So it has been important for the state to create laws and regulations which prevent the worst of the fracking boom here. And if it has prevented some activity from happening, it might have also lessened the chance that companies might have started projects when oil prices were high and then realized they weren’t economical when prices dropped.
There wasn’t ever any real urgency in greatly expanding drilling before lots of things were worked out.
An old newspaper article about the bust:
http://news.google.com/newspapers?nid=1928&dat=19820503&id=hV0gAAAAIBAJ&sjid=gmQFAAAAIBAJ&pg=5488,523404
Let me see if I can imbed this image. If it doesn’t work I’ll post a link instead.
As you can sell, wells are moving towards Colorado communities. If they had remained out in unpopulated areas, I don’t think you would have seen communities assert themselves in terms of drilling within their borders.
The industry won’t “vaporize”. People will get laid off. Some will lose their business. Some will commit suicide, like my neighbor with two young kids did back in 1986, and some will soldier on. It’s the oilfield.
And this is why those who stick around and take the heat get paid better than the average, why we have 30 foot joints, and why drilling rigs are supplied with dope by the bucketful. It’s not something regular folk can do year after year.
and the boss is the Pusher!
I haven’t seem that tee shirt for a long time, lol
“Against this background of high debt, a fall in the price of oil weakens the balance sheets of producers and tightens credit conditions, potentially exacerbating the price drop as a result of sales of oil assets (for example, more production is sold forward). Second, in flow terms, a lower price of oil reduces cash flows and increases the risk of liquidity shortfalls in which firms are unable to meet interest payments.”
Pretentious gobbledygook.
In English. The price gets low. The oil holdings on the balance sheet have to price lower, and since they are collateral for loans, the lenders get reluctant to lend more. And with price low, the oil produced is worth less and that pressures ability to make loan payments.
There is no reason for new B school grads to adopt silly language.
Damn Watcher, it sounded sensible to me. Maybe that’s the reason I walked out of the Intro-to-Accounting Basics course during the third class – never to return: Couldn’t get past the debit and credit part. On the bright side, my wife insists I’m not totally retarded and that I do have uses; but, alas, she won’t actually say what these uses are (or were).
Pipeline bombed in Libya:
http://www.reuters.com/article/2015/02/14/us-libya-security-idUSKBN0LI0KP20150214?feedType=RSS&feedName=worldNews
Hi. I have updated the 1 month after production graphs. First all counties.
Here is Mountrail. Confidential wells are not included as usual. So unfortunately, 30-50% of the wells are not included. The EOG wells are usually confidential for example.
Gas production is up quite a bit for all counties. Perhaps the use less choking to produce more while they still have hedged oil price. Just a guess.
Thanks for the summary graphs, Freddy.
What is the weighting on your water cut statistics? Consider for example a 2-well data sample with one well of 1000 barrels/day and 10% water cut and one of 100 barrels at 99% water cut. Water produced by the two wells would then be 111 and 9900 barrels, respectively. The well-weighted average water cut is 54.5%, while the volume-weighted or field average is 90%.
I’m guessing these graphs represent unrevised initial estimates for older wells as well? Older wells would now have come off of “confidential” status.
With the initial oil probably near saturation with no significant free gas, the gas/oil ratio is probably a halfway decent proxy for pressure depletion. Large ratios early in the life of the well probably mostly indicate infill drilling, or drilling near older already producing wells. I suppose it ought to be possible to manually track down if this is the case.
Away from the sweet spots, much of Mountrail county has a weathered high water-cut Bakken layer, with a relatively poor upper Three Forks layer. Most of McKenzie county has better initial rock than much of Mountrail county. I’m not surprised that they’re getting on average better results from McKenzie lately. I wonder if a narrow focus on Mountrail county is really useful.
I wonder what the well decline curves would look like binned by water+oil production. I would think that wells with similar oil+water production ought to have similar pressure depletion rates, and hence similar decline curves. Clearly the more intensive fracks will have a more rapid decline curve, but the question is by how much. They might not look all that different from an earlier well which happened to hit a natural fracture line.
Hi Blaine,
Thanks for your input. There is no weight, just pure average. So in your example it would be field average. It shows average production one month after first production. So for example 4/2014 shows the average data for wells that started production 3/2014. No revision is done at all. It´s data collected from this page; https://www.dmr.nd.gov/oilgas/mprindex.asp. Old data from from wells that were confidential but are now public is still confidential. However I use this page to find out which well are bakken wells; https://www.dmr.nd.gov/oilgas/bakkenwells.asp and sometimes older wells get added there which could affect old data. For example 11/2014 had lower production in my graph last month. But this month 3 more wells were added which increased the average.
Yes it would be possible to track the wells on the GIS map server and see if the later wells with higher gas production are closer to other wells than before. But it would require alot of work.
The reason I track Mountrail is because it is the county with the highest drill density. Downspacing should affect Mountrail first and it would giv a hint when it will effect the other counties.
I don´t have any decline curve graph sorted by oil+water production. But I have yearly production profiles. Water cut has changed quite alot over the years but the production profiles are quite similar. Later years have higher initial production but quite similar besides that. I will attach it here.
Here is the water cut graph. The last 11 data points for each curve on both graphs does not yet contain all the data and will change. So you can choose to ignore those.
Thanks for the response.
Average well density in Mountrail isn’t much higher than the other core counties, but of course the wells are crammed together in the sweet spots there and it’s a higher permeability area, so it’s effectively significantly higher. Yes, we should see downspacing effects there earlier than elsewhere in ND, although I’m still expecting to see downspacing effects in Eagle Ford first.
EOG has been talking about putting in injection wells specifically in Mountrail, which should considerably muddy the usefulness of water cut as a decline indicator there.
I’ve been trying to get a handle on the EUR of some of the newer big wells, which seem to be edging towards a standard of $9-11 million, 10,000′ and 1800 pounds sand/foot.
Later years have higher initial production but quite similar besides that.
That would be a losing proposition, were it the only effect, because you gain only the initial year’s worth of production boost in EUR. I think we’re seeing in your annual class data a combination of a gradual phase-in of longer wells with bigger fracs, along with wells being gradually pushed to worse rock, and gradual increase of downsizing pressure.
Looking at some of the individual well data from Rune Likvern indicates to me that the newer wells represent a significant cost reduction, although not nearly so dramatically so as the IP per well numbers would indicate.
The data is still pretty sparse and noisy. IP seems to be improved dramatically for some of the newer wells, with production after the first year up only modestly.
Ahh #%&#, you were right. I checked my code and the water cut is actually weighted. Thanks for poiting it out. I calculate water cut for each well and then calculate the average. I quickly added a field average calculation and got about the same result. So no harm done I suppose.
I based that Mountrail has higher well density on Hughes Drilling Deeper report. A bit hard to compare to McKenzie though, which looks like a mess where some areas have few wells and other areas closeby have wells drilled extremely close to eachother. I also agree that Eagle Ford should be affected first. But I don´t have the data for it. It would have been interesting though to do the same work for that.
That later years have higher initial production but similar after that I base on the production profiles above. So you can make you own analyzis. Note that it is real data. So things like halt in production because of maintenance or increased production because of refracking are included. Hint: You can get a larger picture if you right click and open in another window.
Comparing for example 2013 which have a cumulative first year of production of 91k barrels with 2011 which has a cumulative production of 85k barrels, there does not seem to have been any major changes between those years. Production is very similar after that as you can see in the graph.
On a slightly different topic. I found something strange when I looked at the IEA monthly data tables. If you first look at an older data sheet like for example July 2014 data here;
https://www.iea.org/oilmarketreport/tables/
In Total Stock Ch. & Misc on the first page we can see -0,3 for 2011, +0,8 for 2012 and +0,2 for 2013. So everything is fine. There has been plenty of oil available. Now look at January 2015 data. What?! -0,9 for 2011, +0,2 for 2012 and -0,5 for 2013. So they missed to inform us that we have been using stocks the last years to be able to meet demand. I feel that I can´t really trust their numbers anymore. Later when production will start to decline, they can just say; No worries. Look at 2011 and 2013. It´s normal that production is sometimes lower that demand. With higher prices, investment can increase again and production can get higher than demand like it did in 2014 and 2015.
The problem is that they only have definitive data years after their first publication. It is sometimes strange to read from their report “higher production comparing to the previous month” when they compare estimations for the current month to corrected data from the last month. Example:
July 2014 production: Global supply up 235 kb/d in July to 93 mb/d
August 2014: production: Global supply was down 400 kb/d in August, to 92.9 mb/d
So if production was down 0.4 mb/d, that means July corrected production (after one month) was probably 93.3mb/d, not 93.0 mb/d as in their first estimation.
The problem is that they compare raw estimation to better estimation without mentioning it.
Sometimes you have production increase, demand decrease as well as stocks. This is because these three estimations are done independently. They are therefore not consistent between them.
The main problem is that they never mention previous corrections. It is like in 2010 (if I remember well) when the BLS declared they just missed 6 million unemployed people in their statistics in 2008. So the situation in the US was worst than declared in 2008. But as the numbers have been adapted smoothly with time, so there was no effect on stock exchange.
Yes I know the data is not definitive and that they change old data every month. But I find it very suspicious that when production now is higher than consumption, stock changes for 2011, 2012 and 2013 get reduced alot, all at the same time.
Tribal leader: Iraqi troops in Anbar could ‘collapse within hours’
http://www.cnn.com/2015/02/14/middleeast/isis-iraq-syria/index.html
CNN is reporting that ISIS forces are only nine miles away from Ayn al-Assad Air Base, which as noted above, was attacked on Friday and where several hundred US personnel are stationed.
US Moving small number (4,000) of troops to Kuwait for defense against ISIS:
http://www.washingtontimes.com/news/2015/feb/13/fort-carson-combat-troops-head-kuwait-4k-will-beco/
ISIS may be antagonizing Jordan to destabilize it:
http://www.huffingtonpost.com/alastair-crooke/isis-jordan-strategy_b_6674252.html
http://en.trend.az/iran/politics/2364420.html
http://www.renewableenergyworld.com/rea/news/article/2015/02/tesla-plans-battery-storage-for-emerging-residential-market?cmpid=SolarNL-Saturday-February14-2015
The wind and solar revolutions may proceed substantially faster than most of us expect. If battery prices come down substantially within the next few years I will give serious consideration to going off grid myself. Generating enough kilowatt hours with a good sized pv system would be manageable.
But organizing my life around intermittent power is not something I will do unless it becomes necessary. Grid juice is still a world class bargain.
If I could buy a complete system turn key standardized design for twenty five to thirty grand it would be better than money in the bank at a low interest rate and IF it were standardized with good drawings I could install it myself with a laborer to help.
Check out Aquion, they are in production now.
NAOM
Very interesting. Did not see cost.
My batteries are minimal- 6kW hrs to 50%, which means we throttle down to essentials and resort to wood stove for most everything else.
Am playing around with compressed air storage. Easy to do with any excess power if big enough tank. Take that air and use it to replace compressor in gas turbine cycle. Fast load match, even if not necessary with battery. Pyrolyzer stove gives gas for turbine burner.
Pyrolyzer puts carbon back into ground where it belongs. So- carbon negative power, Everybody should be doing it with the money they divert from digging ever deeper holes in ever more horrid places at ever more frantic pace. Ludicrous!
$250-$500 /kWh depending on what you read.
NAOM
More Tar Sand chaos:
http://www.vancouversun.com/news/Crude+train+derails+Alberta/10815214/story.html
Hello everyone,
This article from Bloomberg may have been discussed here before.
This Chart Shows Why the Number of Oil Rigs May Not Matter Anymore
http://www.bloomberg.com/news/articles/2015-02-13/this-chart-shows-why-the-number-of-oil-rigs-may-not-matter-anymore
But production isn’t slowing yet. In fact, last week the U.S. pumped more crude than at any time since the 1970s. “The headline U.S. oil rig count offers little insight into the outlook for U.S. oil production growth,” Goldman Sachs analyst Damien Courvalin wrote in a Feb. 10 report.
We’ve seen this before, in natural gas. The chart below shows a striking separation between natural gas production, in orange, and natural gas rigs, in blue. The massive increase in efficiency this represents helped fuel the U.S. fracking boom and has led to some of the world’s lowest prices in natural gas, in gray.
The gas data is fascinating and may provide some insight into how we can have such low gas prices here in the states.
On another note, regarding a conversation I had with Dennis and Nick in the last thread I also wanted to point out the following from the National Stripper Well Association:
https://nswa.us/custom/showpage.php?id=25
The United States has an estimated 771,000 marginal wells in production – about 410,000 oil and 361,000 natural gas wells. Combined these wells make up almost 20% of the total of all oil and natural gas produced domestically. (11.3% oil / 8.3% natural gas)
Now marginal wells are not the same as stripper wells, although I am sure there is a lot of overlap. But the key point to my mind is that the numbers seem to contradict the EIA data.
United States Total 2009
ftp://www.eia.doe.gov/pub/oil_gas/petrosystem/us_table.html
Best,
Tom
Strangely, the number may be irrelevant.
They are saying that the number of rigs drilling for oil may be irrelevant to oil production. That just goes to show how some MSM writers haven’t a clue. Of course there is a delay between rigs being stacked and oil being produced. And in some cases, where hundreds of rigs are awaiting fracking, the delay is very long. But if the number of rigs were irrelevant, the oil companies would have pulled those rigs a long time ago. Why would an oil company spend 9 million dollars on a well if production from that well was irrelevant?
This tells me I shouldn’t trust Goldman Sachs analysts for anything related to the oil market.
Ron,
Is it what they are saying that is really important? Who cares? What matters is the data. If someone can refute the data I will listen. But look at the graph in the Bloomberg link. You are not seriously suggesting that six years after the gas rig count dropped we are still trying to catch up with fracking and that is why production has not been effected, are you? As I note to Dennis below, the data screams at us that something in our underlying assumptions is fundamentally wrong. I guess I should also point out that I am not saying that oil production will not peak in the future (possibly the very near future).
Let’s not ignore the data, let’s try to understand it and incorporate it into our models so that we can more accurately predict production.
Best,
Tom
Some interesting EIA annual Louisiana natural gas data, through 2013, that I have previously posted:
2012 to 2013 annual rates of change:
Overall Dry Gas Production: -21.0%/year
Gross Withdrawals From Three Sources of Gas:
Gas Well Production: +6.5%year
Associated Gas Production: +4.9%/year
Shale Gas Production: -32.8%/year
Data: http://www.eia.gov/dnav/ng/ng_prod_sum_dcu_sla_a.htm
It seems to me that this is an interesting case history of a reduction in overall drilling in a shale play, the Haynesville Shale Play in this case, while they presumably focused on the “sweet spots.” Note that these rates of change are all net changes, after new wells were added. The gross underlying decline rate from existing shale wells in 2012 would of course be higher.
Citi Research puts the underlying gross decline rate in existing gas production in the US at about 24%/year. At a 24%/year gross decline rate, in order to just maintain existing US gas production for four years, the US would have to put on line the productive equivalent of about 100% of current gas production over the next four years. In round numbers, a 24%/year gross underlying decline rate requires that the US put on line roughly the current gas production from the Marcellus Play, every year, just to maintain current production.
Of course, at a 24%/year decline rate, existing production would be down to 38% of the current level in four years, since we would be declining against a declining volume (and the decline rate from existing wells would probably fall with time too), but I am stipulating a steady state production scenario.
Incidentally, note that Louisiana shale gas production was increasing at 55%/year from 2009 to 2012.
At the 2009 to 2012 rate of increase in Louisiana’s shale gas production, it would have met 100% of US natural gas demand by the end of 2017.
At the 2009 to 2012 rate of increase, Louisiana’s shale gas production would have met 100% of global demand by the end of 2020.
Hi Jeff,
I am going to be off of the computer until this evening (or perhaps even until tomorrow evening) so I will more thoroughly respond to you, Doug, Ron and Dennis later.
Best,
Tom
Tom, yeah, what Jeffrey said. But a couple of more points. Gas is not oil and oil is not gas. Oil wells also produce gas but gas wells do not produce oil. Look at Texas. While Texas gas well gas had declined their associated gas, that is oil well gas, has increased dramatically, keeping Texas total gas production on a plateau.
Look for both the production of oil in the US to start dropping after mid year. Also look for the production of associated gas to start to drop as well.
Hi Ron,
I know you do not know me, but let me start by saying I have a very good understanding of the differences between oil and gas down to the molecular level, and an adequate understanding of oil and gas wells and what they produce.
It would not in any way surprise me if oil and gas production starts to decline soon. What has surprised me is that gas has not started to decline yet.
I am going to be off of the computer until this evening (or perhaps even until tomorrow evening) so I will more thoroughly respond to you, Doug, Dennis and Jeff later.
Best,
Tom
Hi Ron,
The US gives us crude plus condensate data, there is no place to get crude data for the World (OPEC only). Usually when people refer to oil it is C+C and gas wells do produce condensate. So gas wells contribute to C+C output and in some sense produce “oil” if we call C+C output “oil”.
In the past few years, U.S. nat gas production was largely driven by increasing output from the Marcellus and Utica shale plays. Excluding these two plays, U.S. nat gas production peaked at 76.5 bcf/d in January 2012 and was 73.7 bcf/d in November 2014 (gross gas withdrawals).
Shale gas production ex Marcellus/Utica also peaked later in 2012.
Meanwhile, combined Marcellus+Utica production in November 2014 was 17.2 bcf/d in November 2014, up 168% from January 2012 and 790% from January 2010.
Marcellus/Utica complex is unique in terms of high wells productivity and low costs, and there is nothing comparable among the tight oil plays.
Besides, about 20% of total natural gas produced in the U.S. is associated gas from oil wells.
My conclusion is that it is unrealistic to expect continued growth in U.S. LTO production with continued reduction in oil well count.
Hi Tom,
First it does not seem to contradict the EIA data, because the dates are different and there is a difference between a marginal and a stripper well, it will depend on oil prices and well costs and well output of oil and water to determine if a well is marginal, so we have an apples to oranges comparison here.
In 2009 there were 648,000 oil and natural gas stripper wells.
Hi Dennis,
So I provide a link that suggests there are 500,000 stripper wells in the States, and you refute that data by providing the very link I posted–the exact same 2009 data. I thought I understood what you were trying to say–here is 2009 data, but there is no mathematical way that in six years we have added that many new wells to production to result in half a million stripper wells. OK, fair point. But you then can’t come back and say the same data is not applicable here to marginal wells.
So your initial point is still valid (or at least what I thought your initial point to be)–there is no way we have drilled so many new wells since 2009 that we have that many marginal wells in the States. Whether we are discussing marginal or stripper wells is irrelevant. The same logic applies, and I would agree with you that the logic is sound. Someone somewhere has their data wrong.
If I get a chance I am going to contact the stripper well association this week to see if they have data on the number of stripper wells and average production/decline rate from those wells, because I am still interested in that data.
At this point it is clear to me that there are fundamental flaws with the models being used. I don’t think anyone could take data up to 2005 and do an accurate retrodiction of the data as it has played out over the subsequent 10 years–thus the models are not worth very much–a point I have been trying to make here in a couple of different ways . But I want to be clear–that does not mean I am saying that oil production will not peak in the future (possibly the very near future).
But a point I want to emphasize here, and I will point out to Ron above, the gas data shows that something in our underlying assumptions of decline rates and future production is fundamentally wrong. Simply look at the graph at the Bloomberg link and that fact screams at us!
Best,
Tom
Hi Tom,
You likely already know this but if you have the patience there is a lot of info in US National Stripper Association News reports. For example:
“They (stripper wells) produced 700,000 barrels per day in 2012, the latest year for which data are available AND the more than 770,000 marginal oil and gas wells currently in production in the US represent nearly 80 percent of the total wells, and are responsible for 19.6 percent of the total of all oil and natural gas produced domestically.”
This is new to me as in the last 20 minutes new. The trouble is there are reams of reports so you need a lot of endurance: Didn’t notice the “500,000 stripper wells” figure. Good Luck.
A bit of trivia:
“Although tiny in isolation, the average stripper well yields less than 2 b/d, there are more than 400,000 such wells in the US supplying about 11 per cent of US oil production: they produced 700,000 barrels per day in 2012, as much as the OPEC member Qatar, according to data from the Interstate Oil & Gas Compact Commission.”
Hi Tom,
Often in a live interview an oil analyst can misspeak. The 500,000 stripper well came from CNBC. I suggested that today the number will be larger than in 2009.
I also gave you two other links, one to EIA data for 2010 (about 15,000 oil wells added that year) and a link to Baker hughes well data which gives 110,000 oil and natural gas wells added from 2012 to 2014. Baker Hughes does not break this into oil and natural gas wells, but we can assume it is proportional to the % of oil rigs which was 77% over the 2012 to 2014 period so 85,000 oil wells, we don’t have data for 2011, but if we assume 35,000 total wells that year and 52% of rigs were oil rigs in 2011, we would have 18,000 oil wells for 2011.
We would then have 466,000 oil wells in 2014, if no wells were abandoned between 2010 and 2014. If 410,000 of these wells are marginal (not the same as stripper wells according to your link), then 87% of all wells are marginal wells. I have no data on the number of stripper wells in 2014, only 2009 when stripper wells (15b/d or less) were 85% of the total.
I was only pointing out that we have data on marginal wells and stripper wells, but they are not the same thing. From the webpage you linked to:
Stripper Well For tax purposes, a stripper well is defined as any oil or natural gas well property whose maximum daily average oil production does not exceed 15 bbls of oil, or any natural gas well whose maximum daily average gas production does not exceed 90 Mcf, per day, during any 12-month consecutive time period. Often used interchangeably with the term “marginal well” although they are not the same thing.
Note that I underestimated oil wells previously by assuming half of 110,000 wells from 2012-2014 were oil wells (I have assumed the number of oil wells are proportional to oil rigs in the estimate above). If stripper wells are roughly equal to marginal wells then since 2009 the percentage of stripper wells may have risen, but if some of the 2009 stripper wells were abandoned (about 7% of the 310,000 stripper wells over the 5 year period or about 4400 wells per year) the percentage of stripper wells would still be 85% of the 444,000 oil wells producing (466k minus 22k abandoned wells from 2010 to 2014).
I think some wells decline to produce less than 15 b/d, some strippers are worked over or show response to injection and move above the 15 b/d boundary, some wells are abandoned, and some gas wells are re completed into oil zones or viceversa.
Hi Tom,
Can you explain what a retrodiction is? For the Bakken I use average well profiles for 2005 to 2007 and then a different well profile from 2008 to April 2014, and then modify that well profile from May 2014 to Dec 2014 to match model to data.
This is combined with the number of wells added each month from 2005 to 2014 and the match of model to data is quite good.
I cannot do this for all wells in the US or the World, there are too many wells and too many different formations and I don’t have the data needed.
I have also tried to do this for the Eagle Ford, but the data is much more difficult to work with, so the model is not nearly as good as the Bakken Model.
Hi Dennis,
I am going to be off of the computer until this evening (or perhaps even until tomorrow evening) so I will more thoroughly respond to you, Doug, Ron and Jeff later.
But quickly, you can find a good definition of a retrodiction here:
http://en.wikipedia.org/wiki/Retrodiction
Best,
Tom
Think the footnotes help explain the difference?
2) This U.S. total does not include pre-2003 oil wells from NY, post-2004 wells from PA, 2009 wells from KY, most post-2005 TN wells, and all wells from IL and IN.
4) To be consistent between states a GOR of 6,000 (cf/bbl) for each years production was used to classify wells. If the GOR was less than 6,000 (cf/bbl) the well was classed an oil well, greater than or equal 6,000 (cf/bbl) were gas wells.
Hi NickG,
That may account for some of the discrepancy, there is not a lot of oil output from New York, Pennsylvania, Illinois or Indiana.
Roughly 50 kb/d for the 4 states combined, if we assume all wells are stripper wells with 3 b/d of average output, that might add 17,000 wells, it would still not get us to 500,000 stripper wells, but it would get us 17,000 wells closer, we would be at about 400,000 stripper wells by this estimate. We can call it 500,000 if we must assume oil analysts are always correct and that the EIA tends to make mistakes (though this is mostly forecasts, their data is quite good in my opinion (though not perfect).
got this link off the NY Times Andy Revkin blog.
A story about the potential boom in Nova Scotia.
8 Billion bbls – what he US uses in a year and and a month.
But an interesting story about the formation and discovery of oil,
in particular the Atlantic margin.
http://qz.com/318755/how-one-mans-wild-geological-treasure-hunt-could-set-off-a-new-great-oil-boom/
Very nice article. It has one glaring mistake, when it says a typical Middle East well recovers $2 billion barrels, and a couple of other minor glitches, but overall it’s very educational material.
sunny: Good find, excellent mix of material. I can’t imagine anyone who wouldn’t benefit from reading this. It would have benefited from a geologic section or pseudo-section to help put known geology into perspective but that’s a minor quibble. Will read it again later today.
Does anyone know where I could find data on the total number of wells drilled in the us on a monthly or annual basis for the last few years? Eia data only seems to go up to the end of 2011, which misses a very interesting period. It’d be interesting to see how productivity responds to the number of wells drilled. Global numbers would be interesting too, but I suspect impossible to come by.
Total oil & gas wells drilled in 2014: 47,402 (est.), 2015 forecast: 38,033
Source: http://www.worldoil.com/magazine/2015/february-2015/special-focus/prices-reduce-us-oil-drilling-but-gas-activity-remains-steady
Land wells drilled (Baker Hughes data):
BHI numbers do not include offshore wells, exploratory and workover wells
When I first looked at this data, I didn’t realize it is oil and natural gas wells, not only oil wells
Hi AlexS,
The link didn’t work for me, is that US wells or for the World, I doubt there were 12,000 offshore wells drilled in the US, so either World Oil or Baker Hughes is wrong for 2014, or 47,000 was for the World and not just US.
Hi Dennis,
For some reason, all links in the World Oil website (http://www.worldoil.com/) currently don’t work. Hopefully they will fix it tomorrow.
There is a big table with total U.S. wells and footage drilled in 2014 and to be drilled in 2015, by state.
The number of offshore wells is indeed relatively small. In 2014, there were only 275 wells drilled in the GoM and California offshore.
But I think World Oil’s numbers include exploratory wells, while Baker Hughes only takes into account development wells.
From the same article:
“Up until now, U.S. activity has remained in a narrow band between 44,000 and 48,000 wells per year, going back to 2011. Last year, activity was up about 2%, as operators drilled about 47,400 wells. This year, World Oil forecasts that drilling will drop nearly 20%, to just over 38,000 wells, Table 3. And there is always the possibility that this decline could be a little larger. We also expect footage drilled to fall at a slightly faster rate, dropping nearly 21%, to about 315.6 million ft of hole. This is due, of course, to the fact that a greater share of drilling will be lost in shale plays, where many wells have long laterals.”
“Liquids-rich shale plays are expected to bear the brunt of low crude oil prices because of high break-even costs. Many of the leading U.S. independents are making adjustments by either divesting non-core assets, or reducing budgets and rig counts.”
“On a state-by-state basis, Texas will experience an overall 23.4% decrease in new well activity to 13,911 wells. Particularly hard-hit will be District 8, which includes the Permian basin (-30.9% to 4,155 wells), as well as Eagle Ford District 1 (-21% to 2,448 wells), District 7C (also -21% to 1,598 wells) and District 2 (-10.1% to 1,169 wells). Texas led the nation in oil production at the rate of 3.403 MMbpd in November 2014. That figure potentially could dip below 2.5 MMbpd in the latter part of 2015.”
“North Dakota, which produced 1.187 MMbopd in November 2014, will suffer a severe cut, due to reduced activity in the oil-rich Bakken shale play. World Oil expects the number of wells to be drilled in 2015 to drop 30% to 1,663.”
Thanks Alex
The EIA also has tables on total feet drilled and drilling cost per foot, but again the data is years out of date, so hopefully worldoil has something similar (when they start working again). I think it would be interesting to look at metrics of feet drilled required per extra barrel of production, or how much the cost per added barrel has changed. The EIA charts of cost per foot seemed to spike upwards very sharply around 2009, right around when the data stopped.
The USA was drilling around 40,000 wells annually back in the early 80’s and we seem to be at around that level again.
I wonder why so much of the data on EIA website has not been kept up to date?
Budget cutbacks? Most of the holes in the data seem to occur right around the financial crisis sort of time, give or take a few years.
The Motley Fool has another name for Peak Oil, “Hump Day”.
The “Hump Day” Of America’s Oil Boom is Fast Approaching
Oil and gas production in America has been surging over the past few years. We’re pumping out so much oil that we’ve really changed the oil market’s dynamics by ruining OPEC’s ability to control the price of oil. However, there is a downside to this and that’s the fact that the high oil price over the past few years was what had been fueling America’s oil boom. This means that after years of growth America’s oil production is about to not only stop growing, but could begin to decline later this year. That would lead to the hump day, so to speak, of the oil boom.
In reading the following and very interesting article, I was reminded of the following quote:
NYT Column: Why Movie ‘Facts’ Prevail
http://www.nytimes.com/2015/02/15/opinion/sunday/why-movie-facts-prevail.html?ref=opinion
I’m also reminded of the CNBC anchor’s pronouncement a year or so ago that the US was already a net crude oil exporter. I wonder how may people carry that concept around in their brains as an established fact.
And a very interesting, and really scary, series of social media horror stories:
http://www.nytimes.com/2015/02/15/magazine/how-one-stupid-tweet-ruined-justine-saccos-life.html?ref=magazine
Jeffrey,
I’m currently reading thinking fast and slow by Daniel Kahnemann. A very illuminating book on how the mind functions, but at the same time deeply disturbing when one things about how some of the things shown in the book might interact with problems such as peak oil or climate change.
Sam – let me put you at ease. How the human mind functions (collectively) has gotten us this far. It would be somewhat presumptuous (or truly clairvoyant) to think that it is all coming to an end.
However, as a species we have never had to confront a problem like running an industrial civilisation through something like peak oil or climate change. And given how dreadful human decision making is, especially at dealing with probabilities, the odds of us making optimal decisions seems low. Kahnemann himself considers climate change basically a perfect example of something our minds are incredibly ill equipped to handle.
However, as a species we have never had to confront a problem like running an industrial civilisation through something like peak oil or climate change.
True.
Humans have undergone some major disasters, but it appears the response has been religion. They pray or sacrifice something and hope the gods will be kind, or at least give them a great afterlife.
WWII was probably the most recent. We responded in a “reasonable” manner in that case by identifying the enemy and fighting with everything we had.
Knowing in advance of a coming crisis isn’t something humans have had the tools to plan for. Now, farmers in the past have known the likelihood of bad years and have tried to put away some supplies to tide them over, but this form of thinking has gone out the window in modern times and days of abundance. Preparing for times of loss doesn’t seem to be in our mentality anymore. If it were, we’d be doing more to prepare for peak oil. And yet we have a significant group of people who get mad at the very suggestion of peak oil.
”Humans have undergone some major disasters, but it appears the response has been religion.”
I enjoy jerking the chains of anti religious folks just a little bit from time to time when they forget that religion is a natural part of the human condition and that when we get right down to the nitty gritty we all seem to look up to SOMETHING and that very few of us believe in NOTHING.
I don’t know WHY we exist but evolutionary psychology as part of the Darwinian synthesis explains why we have religions. Most of us are followers. ONLY a very few people ( percentage wise of the population ) are intelligent enough to think for themselves.
Religion confers a survival advantage under the circumstances that have prevailed historically most of the time and continue to prevail in many if not most places.
I remember from my childhood hearing a preacher preaching the story of the wisdom of putting away a surplus for a rainy day at least a couple of times every year.
It is not good to have people on congressional committees who lack a sound scientific education but it would be a damned good thing if every congressman and every businessman and everybody period listened to that sermon a couple of times a year.
If we could all have a sound education religions would probably fade away.
I remember from my childhood hearing a preacher preaching the story of the wisdom of putting away a surplus for a rainy day at least a couple of times every year.
At least the Mormons do this as a religious culture. I could never become one because I wouldn’t be able to accept all of their beliefs, but as a lifestyle, I can relate to them.
Hello Sam Taylor.
For some weird reason, your insightful comments (about the implications of human nature on peak oil) have been sidetracked by a protracted discussion on religion.
You said:
“However, as a species we have never had to confront a problem like running an industrial civilisation through something like peak oil or climate change. And given how dreadful human decision making is, especially at dealing with probabilities, the odds of us making optimal decisions seems low.”
I completely agree. It should be quite obvious that, once net energy begins to decline, human irrationality and bad decision making will feed back through the system, leading to worst case outcomes in all cases. That simple insight not only guarantees that total collapse is inevitable, it also guarantees that collapse will be very rapid.
I guess that is not a very welcome insight to most people.
clueless,
How the human mind functions (collectively) has gotten us this far. It would be somewhat presumptuous (or truly clairvoyant) to think that it is all coming to an end.
That is completely backwards. It is highly presumptuous to presume that we can’t possibly fail.
In previous comments I have tried to explain why there are farmers and ranchers in Nebraska who don’t want the Keystone XL on their property.
Here is an article about a pipeline in Wisconsin. Every problem with every oil industry pipelines makes the Keystone opponents more wary. This is an industry that doesn’t have a pristine safety record, so people who might be directly affected often don’t trust them.
Enbridge, North America’s largest oil and gas pipeline operator, has the Western Hemisphere’s worst record for spills. The National Transportation Safety Board has recorded 800 incidents since 1999 — and that’s not including oil that seeps into the environment from weak or corroded sections of pipe, which is ignored by federal regulators.
http://www.wisconsingazette.com/wisconsin/xxlbreakwisconsin-pipeline-dwarfs-keystone-and-affects-every-waterway-in-the-state.html
What’s the definition of “incident” according to this article? In some jurisdictions one has to report a spill into containment kit as a “spill incident”. Some of these incidents are such as an operator taking a sample and getting distracted, allowing the sample container to overflow. I’m sorry, but I don’t buy your argument. 99% of the people objecting to pipelines are outsiders who object to everything. This is easy to see reading their blogs, articles, watching their videos, and so on. I also think this is in part financed by the venezuelan dictatorship. They have a keen interest in being able to ship extra heavy crude blends by tanker to the usa gulf coast.
I also think this is in part financed by the venezuelan dictatorship. They have a keen interest in being able to ship extra heavy crude blends by tanker to the usa gulf coast.
I know nothing about this, but I am familiar with the Nebraska landowners who are protesting and going to court.
Also, read the whole article, if you haven’t. I pulled that one quote, but I wasn’t trying to use that to sum up the entire article with it.
Please identify the industries that do have a “pristine safety record” so that I can support them more. But, do not include companies such as Apple that have exploited workers, which in some cases resulted in suicides. And they rely on mining and energy companies to produce what they do. Tobacco – out, steel – out, mining of any kind – out, utilities – out, construction – out, retail (they sold tobacco) – out, medical (why am I seeing all these “call an attorney now” ads on TV?) – out, food -absolutely out, nuclear – out, etc. What am I missing here? Okay, Monks in Tibet. And, as someone who grew up in the Midwest farming country, do not say farmers. Pesticide and fertilizer runoff destroying streams. Let’s just all recognize that everything has problems. And the idea is not to be “pristine,” but rather to continually strive to do better. Today’s pipelines (2015) are state of the art, but not pristine (and, like everything else, will never be).
You’ve made your point.
I’ve just been trying to explain that whenever there is news of a pipeline leak or failure, that reinforces concerns by private landowners in Nebraska that their land will be damaged.
Quite honestly, there are a lot of places that wouldn’t welcome a pipeline running through their properties.
The thing about pipeline spills and leaks is that they are very visible. While there are other industries that pollute, their damage may be invisible and not immediately apparent so they can stall and pretend they haven’t done any damage.
I plugged in pipeline spills into Google images and this is what came up.
https://www.google.com/search?newwindow=1&client=gmail&rls=aso&biw=1280&bih=616&tbm=isch&sa=1&q=pipeline+spills&oq=pipeline+spills&gs_l=img.12…0.0.0.50610.0.0.0.0.0.0.0.0..0.0.chm_loc…0…1c..61.img..0.0.0.LCui3YUfe9o
Well, the link is so long that it is broken. But you can see for yourself what comes up by going to Google Images and typing in pipeline spills or something to that effect.
Lac-Megantic, hit by blasts “like an atom bomb” after an oil tanker train derailed on a bend on the nearby rail-track: Pretty visible, think I prefer oil seeping into the soil around buried pipe.
Sure, exploding tankers are more dangerous than leaking pipelines. But we are talking about private property owners. They don’t feel the need to give up their land for the “greater good.”
I saw somewhere that maybe the pipeline should be run alongside railroad tracks since there’s already right-of-way established for those.
Probably a good idea. Railway right-of-ways are already polluted by herbicides, heavy metals, polycyclic aromatic hydrocarbons (PAH): Better than routing pipelines across fields growing food! Please don’t get the idea I’m fighting with your ideas Boomer.
Yes, might as well concentrate the pollution and accidents in areas where they already happen rather than exposing new areas to them.
This focus on Drilling Rigs also fails to address the serious nature in the STAGGERING DECLINE RATES. While MSM and other assorted nitwits continue to state that drilling rigs don’t matter as overall production increases (temporarily), the huge LEGACY DECLINE rates still take place in the dark.
I just put together this chart comparing the legacy decline from the Marcellus from OCT 2013 vs FEB 2015. In about a year and a half, the decline monthly loss of gas in the Marcellus is not more than what they were producing for the month of OCT. In OCT 2013, the Marcellus added 579 Mcf/day, while the legacy decline was a paltry 171 Mcf/day. Compare that to the most recent report in FEB 2015 as the new production has increased to 792 Mcf/day, while the legacy decline is now a stunning 621 Mcf/day.
I don’t want to be a BROKEN RECORD, but the Great Shale Ponzi Scheme will implode in glorious fashion. And of course with it, the Grand U.S. Leech & Spend Economy.
steve
I’ve found that media coverage of business topics has left a lot to be desired since at least 2000. The reporters tend to parrot what they see in press releases rather than doing their own investigations.
It’s a combination of them not having the proper business education to know BS when they see it, not having the time to do anything other than republish press releases, and being too cozy with the industries they cover.
Some interesting exponential rate of change numbers for the Marcellus. Total production increased at 23%/year from 10/13 to 2/15 (estimated), while the volume of the legacy decline increased at almost 100%/year from 10/13 to 2/15 (estimated). Basically, the legacy decline rate is estimated to be increasing at about four times the rate of increase in total production.
And as I have periodically noted, based on the Citi Research estimate* of a gross underlying (legacy) decline rate of about 24%/year from existing US gas production, in round numbers the industry has to put on line the current productive equivalent of the Marcellus Play, every single year, just to maintain current production.
*Supported by the observed net decline (net after new wells) in Louisiana’s gas production from 2012 to 2013 (20%).
“Basically, the legacy decline rate is estimated to be increasing at about four times the rate of increase in total production.”
Slight clarification: The estimated volume of gas lost due to declining production from existing wells is increasing at about four times the rate that total production is increasing.
Remarkable!
The cattle in the coal mine…
MLA Projections 2015: Big adjustments ahead in beef production, exports, as drought hangover lingers
By Beef Central, 27 January 2015
http://www.beefcentral.com/news/projections-2015-big-adjustments-ahead-in-beef-production-exports-as-drought-hangover-lingers/
http://www.bom.gov.au/climate/current/annual/aus/
Might as well add this since all the lunatics will appear now anyway.
WARMING PUSHES WESTERN U.S. TOWARD DRIEST PERIOD IN 1,000 YEARS: UNPRECEDENTED RISK OF DROUGHT IN 21ST CENTURY
http://www.sciencedaily.com/releases/2015/02/150212154527.htm
“During the second half of the 21st century, the US Southwest and Great Plains will face persistent drought worse than anything seen in times ancient or modern, with the drying conditions ‘driven primarily’ by human-induced global warming, a new study predicts.”
Well, in that case what the HAY, let’s just go full monty and just bait them with a little red meat and just sit back and watch the blood flow, it’s always great entertainment to watch a good BULL fight, eh? (BIG GRIN!)
Forget about the Western US. Global warming is currently killing the East coast. Robert Kennedy Jr., Prince Charles, Michael Moore have been proven correct (not). “No one in the US will know what snow is like after 2010.” Maybe, the above noted “prediction” will turn out to be just as accurate. Remember Malthus? I think that we ought to just stick with current facts. Unless, of course, it becomes unanimous that it is easier to predict the weather 100 years from now than it is to forecast the weather 2 days from now. Last year, the Midwest US had about the best growing season ever. Record crops (and yields per acre) of every kind – corn, wheat, soybeans. Almost like the Garden of Eden. Please note: the foregoing is not “denying” anything. Also note: I am not a fan of “predictions” the accuracy of which cannot be determined until almost everyone reading them is dead. For example: show me a reputable democrat or republican prediction made 6 years ago that today the US (Congress, State Houses and Governors) would be mostly controlled by Republicans. I am not looking here for an argument. So, I am not going to debate the foregoing. We all love “predictions” that agree with us, but that is a frailty. I would hate to show you how many stocks I have lost money on based upon cannot miss future predictions.
clueless, what an apt handle you have chosen for yourself.
Maybe, the above noted “prediction” will turn out to be just as accurate. Remember Malthus?
Carrying Capacity:
What Is It? How Have We Misunderstood It? And Why Is It Important?
William R. Catton, Jr.
Professor Emeritus, Washington State University
Implications of the exploitation of prey species was illuminated by one of the most vital scientific discoveries of all time — the recognition by Thomas Robert Malthus (1798) of the vast significance of the fact that the human species was capable of reproducing in excess of the level required in usual circumstances for replacement of each mortal generation.
For too long, too many people, upon hearing reference to Malthus, have imagined his theory about population has been refuted. This simply means they have misread him. Here are the two best known sentences from his famous 1798 Essay on the Principle of Population (and I emphasize two essential words that are customarily neglected).
He wrote:
“Population, when unchecked, increases in a geometrical ratio. Subsistence increases only in an arithmetical ratio.
Leaving out those two words — “when unchecked” (which need emphasis) — turns Malthus’s meaning upside down. That is why people can imagine subsequent history has refuted him. Although his language today seems archaic, he was correctly noting that populations tend when possible to over-reproduce and thus have the potential to grow exponentially. His Essay was not so much about predicting population growth, or demonstrating the inevitability of famines, but about what in fact held populations back from maximum potential increase.
The Bering Strait Chunnel needs to be constructed, get that big drill they used over in England to bore under the English Channel through all of that dolomite and start digging. You’ll be able to drive from Rio Grande in Argentina to London, stop in Shanghai for some street food, drive the Khyber Pass over to the Cedars of Lebanon and on up to Munich for a few beers before making your way to tour some castles in England.
https://www.youtube.com/watch?v=-GWoV4r67h0
https://www.youtube.com/watch?v=4Il9q397lL0
😉
Ron — I don’t doubt that Gasland got some things wrong, but I always look at the source of these sort of “expose” movies, and in this case I don’t like what I see. The previous documentary before Fracknation by these directors was about promoting global warming denial (or “controversy” or whatever euphemism they like these days), and the one before that was about how those evil environmentalists were going to stop mining from happening in some town. That tells me enough about the ideological bent of the directors of Fracknation.
Instead of getting reporting from ideologically skewed directors (in whatever direction), a good place to turn is old-school journalism, like that from ProPublica.
How about just going to US government studies? No way is the EPA “bought and paid for” by the oil and gas industry. The EPA has done a number of studies in the Marcellus and elsewhere. Let’s just limit quotes to those studies. I think that they are all in the public record.
U.S. Ethanol Exports and Imports: 2016
Renewable Fuels Association
Hat Tip: Big Picture Agriculture
Drop in agricultural productivity and smaller crush to result in revenue loss exceeding R$3 billion in the 2014/2015 season
UNICA, Brazilian Sugarcane Industry Association, 12/18/2014
Don’t they know the Amazon rainforest is drying up? One of the reasons is the cutting down of the rainforest for agriculture, which of course helps cause the droughts. The whole region is getting warmer also, which doesn’t help.
Unlike the sun, which shines no matter what we do to the planet, bio-fuels depend upon the natural rain cycle. By cutting down or burning the forests, the rain cycle gets erratic and dies out. That gets worse due to a feedback cycle. Ooops. Hoisted by their own petard.
São Paulo drought raises fears of Brazil energy crisis
By Joe Leahy, Financial Times, in São Paulo, Last updated: February 11, 2015 1:53 pm
The “advantage” of talking about drought rather than climate is that it is observable and has an immediate impact on those affected by it.
While skeptics may quibble about the cause and even the solutions, it is at least a real, perceivable problem that can be discussed.
The Brazilian drought is caused by low solar activity, the same as East African droughts.
Much research has been conducted over many decades in an attempt to link sunspots or other forms of solar activity to the weather. The subject is often extremely popular with the media. Countless hours have been spent in trying to convince the world that droughts or floods are the consequence of an unprecedented outburst of solar fury. Unfortunately, for each paper published showing a relationship between the floods of some year and sunspots, there can usually be found a contradictory paper showing either no relationship of perhaps a relationship between sunspots and a drought of the same year.
http://www.ips.gov.au/Educational/1/3/13
Yes sir. It seems there are subtle hints but the mechanisms are hard to pin down. Meanwhile I’m just cheering for the increasing ice cover around antarctica. That ought to help the energy balance.
David,
I would imagine Paul Beckwith mightt disagree with you on that.
Steve
More likely the Brazilian drought is caused by too many humans and their activities using up too many resources and the environment not being able to support those activities and therefore tipping points are being reached in heretofore stable systems such as the climate. In simple terms we are in ecological overshoot. Climate change is but one of its symptoms there are many many more.
With Brazil the crises are interdependent, since they generate a significant portion of their electricity from hydro. A drought threatens not only drinking water, but also electricity supply. It’s a very worrying situation there.
After oil, natural gas, and cattle, I want to return to electricity. In this and following mini-posts, I will report some latest electricity statistics in China. China is now the world’s largest electricity generator and her electricity production continues to grow rapidly. To a large extent, what happens in China decides the global trend in the electric power sector.
I will start with some general statistics and then compare the OBSERVED generationg costs from different generating sources (note the word “observed”, these are not modeled, estimated, idealized costs but costs derived from actual performance). An important conclusion will be that when grid investment costs are included, I find that wind and solar electricity costs may never be competitive against fossil fuels because of their fundamentally low capacity utilization rates.
In 2014, China’s electricity generation reached 5,546 terawatt-hours (TWH), 3.6 percent higher than in 2013. Hydro accounted for 20 percent of China’s electricity generation, fossil fuels accounted for 75 percent, nuclear accounted for 2.3 percent, wind accounted for 2.8 percent, and solar accounted for 0.4 percent (the total is greater than 100 percent because of rounding errors).
In 2014, China’s electric power generating capacity reached 1,360 gigawatts (GW), 8.7 percent higher than in 2013. As of the end of 2014, China’s installed generating capacity included 302 GW of hydro (including 22 GW of pumped storage), 916 GW of fossil fuels (including 825 GW of coal-fired capacity and 56 GW of gas-fired capacity, the rest is presumed to be oil-fired capacity), 20 GW of nuclear, 96 GW of wind, and 27 GW of solar. Note that the growth rate of China’s generating capacity is much larger than the the growth rate of generation, suggesting that China’s current installation boom may not be sustainable.
In 2014, the observed average capacity utilization hours for China’s all electric power plants were 4,286 hours, implying an average capacity utilizatin rate of 4286/8760 = 48.9%. The observed average capacity utilization rate for hydro was 41.7%, for fossil fuels was 53.7%, for nuclear was 85.5%, for wind was 21.7%, for solar was 9.9%.
Hi Political Economist,
If we assume that coal output peaks at some point, then the cost of producing electricity with coal rises,
there is no coal price that would make the future cost of coal fires power generation similar to Wind and Solar? Are you including externalities in your analysis? Are you assuming that future costs of wind and solar cannot decrease?
As I explained, I will show my calculations. Today I’ll just report the calculation result for fossil fuels.
Good Morning Economist,
You say
” An important conclusion will be that when grid investment costs are included, I find that wind and solar electricity costs may never be competitive against fossil fuels because of their fundamentally low capacity utilization rates.”
I agree if the time frame is constrained to the next ten or fifteen years or so and the analysis is a ” static ” analysis of the sort beloved by so many people who want to win an argument- especially in the halls of government when making budgets and writing regulations.
Hopefully you will also talk a little bit about a dynamically based cost comparison as well. Coal and gas prices are sure to go up in my estimation as depletion bites while the world economy hopefully remains on it’s feet for while yet and maybe even grows for another decade or two.
If a country has a big wind and solar industry – especially a domestically based one – it will benefit to some extent from the substitution effect reducing the PRICE of purchased coal and natural gas ( maybe some oil as well) needed to generate electricity.
I don’t know what the long term price elasticity of any fossil fuel is and I doubt that anybody else does for that matter. But it is almost for sure significant and I strongly suspect that taken as a whole USA society is getting a positive return on the subsidies we provide to our domestic wind and solar industries.
Coming up with an accurate estimate of the amount of coal and gas saved annually is not easy. I am not good enough at this sort of thing to gather the info and do it myself but my rough guess is that it takes from ten to twenty percent of the coal and gas that is nominally saved by wind and solar to provide the extra hot spinning reserve made necessary by having wind and solar on the grid. This ten to twenty percent is only a wild ass guess and the actual amount of EXTRA coal and gas burnt to provide hot reserve for renewables seems to be an unknown. Any given utility would obviously know it’s own consumption but I have inquired a lot of places without getting anything except a polite non answer.
So – if my guess is accurate we are saving well over three percent of our annual Tonnage and /or cubic foot usage of coal and gas for generation – eighty to ninety percent of the approximately 4.1 percent of our generated electricity. ( This assumes we are not cutting back on hydro or nuclear to simplify my argument. )
Now the dollar savings extend beyond the actual quantities purchased. If the amount of a commodity purchased falls off significantly because of lower demand for it then the price of it generally falls as well. Of course this effect might be hidden in the noise of generally increasing demand but it is a real effect nevertheless. If the price does not actually fall it will at least go UP to a smaller extent.
I realize that coal is sold and largely priced on a world market but the transportation costs are very high and so some buyers get it a lot cheaper than others.
IF memory serves Wyoming coal costs five times as much delivered to Atlanta as it does at the mine. My impression is that American electrical utilities get their coal at prices based determined almost entirely by domestic mining and shipping costs rather than based on international market costs.
Given that I am not an economist I may be using some of the terminology incorrectly but I believe my arguments are sound.
As the percentage of wind and solar power on the grid increases the amount of coal and gas needed to generate juice will continue to fall. If we get to say twenty percent wind and solar this is going to put a REAL HURTING on the coal and gas industries in terms of quantity sales and an EVEN BIGGER HURTING in terms of gross revenues. ( Even so I think coal and gas prices are going to go up- just not as FAST as they would without wind and solar.)
The coal and gas industry losses will be everybody else’s gain.
Notice I haven’t even touched on the environmental consequences of burning coal and gas in making this argument.
If there is going to be a long term industrial future it is going to be based on renewables.Fossil fuels are not going to last forever.
Interesting discussion and not entirely to the point but:
I spend about a month per year in Asia spread between Japan, Vietnam and China. Most of this time is spent alongside senior engineers, old friends, some being retired nuclear energy sector people. And I must say pretty well everyone in Asia agrees that China’s energy statistics, especially from the past decade, are capricious at best but I do have some semi-on topic thoughts.
First though, when you say: “assume that coal output peaks” What does this mean: China’s coal, Australia’s coal, South African coal, something else?
Regardless, I’ve been told carbon emissions from China will continue to grow until about 2025 then start to decline owing to the rapid take-off of renewable energy. This means, for all its efforts to reduce energy intensity China expects to be increasing its carbon emissions from generating power for another decade: Transportation sector, a separate issue. At the same time, China is building a very impressive “green” energy system based on non-fossil sources (renewables and nuclear) and doing so much faster than any other country: especially wind and solar. But, it should be realized that China’s so-called green revolution, reflected mainly in targets for building renewable energy systems, is being expanded as fast as humanly possible in the name of energy security: Decarbonising is simply an (welcome) offshoot of these policies.
Another point. Actually if coal production “peaks” due to demand-side constraints or environmental regulation, it may lead to falling coal prices. Similar to what we now observe as the oil price “collapse”.
Paint me a cynic but I can see no way coal demand is going to fall for economic reasons other than the Mother of All Depressions for the easily foreseeable future. It is just NOT AT ALL likely that any alternative source of energy to generate electricity can be scaled up fast enough for that to happen within the next two or three decades if the world economy is ambulatory.
And for what it is worth based on my qualifications as an armchair historian there is only a vanishingly small chance the governments of the world will get together and organize a coal boycott for environmental reasons THAT WORKS—-NOT for very long anyway.
Even if the world comes to understand the true nature of the environmental problem people and governments are going to worry about short term survival above and beyond all else.Short term survival ALWAYS trumps everything else in human affairs.
And cutting back on the coal in a big way is not apt to ensure the survival of any politician that advocates doing so when people are short of food and shelter due to lack of income. Coal is arguably as important or even MORE important as oil when you get right down to the nitty gritty.
I think the economic ship is already sinking and will inevitably sink. The doomers are right in GENERAL terms about what is going to happen except for one thing. Collapse is not at all likely to be universal in time and place all over the planet and there is a significant possibility some countries will pull thru the coming bottleneck.
I am not argueing that a surviving country will survive forever but rather that a country such as the USA or Canada has a shot at avoiding a massive die off and outright economic collapse due to overshoot in the short to medium term.
Something is sure to get us all in the long term if the L O N G is emphasized.
Sky Daddy alone knows what a desperate China might do in a couple of decades to ensure her own survival.
Or what the USA might do so far as that is concerned. But we are better situated than any other country in the world possibly excepting Canada. And Canada while she is a valiant nation is not strong enough to withstand an all out assault from a belligerent EUROPE or ASIA without the backing of the USA. A potential Fortress North America MIGHT pull thru humbled and chastened but still more or less whole.
Paint me a cynic but I can see no way coal demand is going to fall for economic reasons other than the Mother of All Depressions for the easily foreseeable future.
That’s why I am somewhat philosophical about income inequality. I think it depresses consumption by the 99%. I don’t think the rich have intentionally thought about the environment by sucking up so much wealth and not putting it back into creating ways to increase the wealth and lifestyles of everyone else, but the more they lack and the less they leave for the masses, the less the masses can buy.
And the hard times ahead that people predict mayPREVENT an even worse environmental disaster. Yes, I know that poor economies will devastate their environments to survive, but if they experience a die off in their areas, then they aren’t around to do more damage.
I’ve suggested that as far as Earth is concerned, it might be healthier for it to be left with a small group of wealthy who have amassed enough resources to survive, and have lots of other people gone. It’s not fair at all, but I see the wealthy having a better chance of survival than most of the rest of the world’s population because they will have started with more.
It’s important to be clear that the current low price of oil is not due to peaking, it’s due to a boom in oil production.
Ron is predicting that the bust in oil production that often follows a boom will combine with depletion to cause oil production to peak.
That is conceivable. But we should all be clear that the current period of low prices was not *caused* by oil production peaking.
An important conclusion will be that when grid investment costs are included, I find that wind and solar electricity costs may never be competitive against fossil fuels because of their fundamentally low capacity utilization rates.
In my opinion it ultimately doesn’t matter because if we need replacements for fossil fuels, we’re going to need solar and wind as part of the mix.
And if the economy needs to adjust to higher electricity costs because the price has gone up, it will even if that means an economy that uses less electricity.
I see the move toward solar and wind as part of the preparation for a post-fossil fuel world.
Dennis, even without considering externalities it is proving cheaper to produce electricity with solar and wind power. If externalities and subsidies are included, fossil power and nuclear power are an order of magnitude more expensive.
In 2014, China installed 103.5 GW of new electric power generating capacity, including 21.9 GW of hydro, 47.3 GW of fossil fuels, 5.5 GW of nuclear, 20.7 GW of wind, and 8.2 GW of grid-connected solar.
In 2014, China’s “main” electric power businesses made a total investment 776 billion Yuan (about 130 billion US dollar by market exchange rate, 6 Yuan = 1 dollar), including 365 billion Yuan invested on generating facilities and 422 billion Yuan invested on grid and transmission.
The total investment on generating facilities included investment on hydro, fossil fuels, nuclear and wind. But because it only includes investment reporeted by “main” electric power businesses, it leaves out distributed rooftop solar as well as some of the smaller grid-connected solar.
Note that investment on grid accounted for 54 percent of the total investment. The question is how to assign the grid investment to different types of electric power. I take the naive approach assuming that grid investment is evenly distributed between different generating sources. Since in 2014, China installed 103.5 GW of generating capacity and the tatal grid investment was 422 billion Yuan, the grid investment that needs to take place to match each gigawatt of generating capacity is calculated to be 422/103.5 = 4.1 billion Yuan.
This estimate, when applied to solar or wind, may be a significant underestimate, as the intermittency and the remoteness of wind and solar generating capacity may require far more grid investment than conventional generating sources.
Hi Political economist,
For remote wind sites that is probably true, but basically you just need to tie a remote wind site with the grid and the grid can handle the power as it it overbuilt already. This cost is typically included in the cost of a wind project, no grid upgrade is needed. For distributed solar power, grid costs are close to zero, the grid is there already.
You are probably overestimating grid cost for wind and solar.
Hi, Dennis, please note that what I did was to assign evenly the ACTUAL grid investment to the ACTUAL increase of generating capacity. What you said was equally true for nuclear and fossil fuels. But I think in fact a disproportionately larger proportion of the grid investment is needed for wind and solar because of their intermittency and remoteness. Think about wind and solar in or near deserts (many of China’s new wind and solar power plants are in Inner Mongolia) and new grid investment to accomodate intermittent rooftop solar (which is currently a small proportion of China’s solar investmetn).
Again, I am just reporting the current OBSERVED data. See below for the fossil fuels calculation. Note that in China, even after the grid investment is included, the construction of fossil fuels plants remain far cheaper than equivalent plants in the US.
You are assuming your conclusion.
You have no actual data on the cost of connecting Chinese wind capacity to their grid.
Assuming that grid investment cost should be allocated proportionally to nameplate capacity additions is not a valid methodology. It might be conceivably useful as a preliminary starting point to generate hypotheses, but you certainly cannot draw any conclusions from it.
If I understand you correctly, you’re coming up with about $.75 per watt cost for transmission to connect wind power to the grid.
This appears high: in the US, the figure is about $.25 per watt.
Have you looked at how chinese grid investment is distributed between the supply side and the consumer distribution side?
Now let us work through the data for China’s fossil fuels electric power plants and calculate the observed generation cost. My approach consists of four simple steps. First, I will calculate the impled capital cost. Secondly, I will use a simple formula to calculate the annual fixed cost. Thirdly, I will calculate the annual fuel cost (this only applies to fossil fuels and nuclear). Fourthly, I will calculate the annual total cost based on step 2 and 3 and use the annual total cost to calculate the “economic price” (or average generating cost) of different generating sources.
In 2014, China made a total investment of 96 billion Yuan on fossil fuels generating capacity, and 47 GW of new fossil fuels capacity were installed. The implied investment cost per GW of fossil fuels capacity was 2 billion Yuan. When 4 billion Yuan of matching grid investment was included, the total capital cost per GW of fossil fuels capacity was 6 billion Yuan or about 1 billion US dollars. By comparion, in the US, it now takes about 3 billion dollars to build 1 GW of new coal-fired power plant. Thus, China’s construction cost is lower than the US’s by about two-thirds.
To calculate the annual fixed cost, I simply assume that the annual fixed cost is 10% of the capital cost. 10% is assumed to include 5% for interest rate (or minimum rate of return on capital), 2.5% for depreciation rate, and 2.5% for operation and maintenance. Thus, the annual fixed cost for 1 GW of fossil fuels power plant is estimated to be 600 million Yuan.
If the fossil fuels power plant has a capacity uitlization rate of 50 percent, the 1 GW power plant can generate 1 GW * 8760 * 0.5 = 4380 GWH = 4.38 TWH. Assuming a 38% generating efficiency, it takes 4.38/4.4194 = 0.99 million tonnes of oil equilvanlent of thermal energy to generate 4.38 TWH of electricity.
An average ton of Chinese coal has the same energy content as about 0.5 ton of oil. For simplicity, assume that 2 million tonnes of coal are required for the generation of 4.38 TWH. The current Chinese coal price is about 500 Yuan/ton (or about 80 dollars/ton, more expensive than the current US coal at about 50 dollars/ton). Thus, the total annual fuel cost equals 1 billion Yuan.
Adding up the total fixed cost and fuel cost, the annual total cost equals 1.6 billion Yuan. The annual electricity generation is 4.38 TWH. Thus, the average generation cost = 1.6 billion Yuan / 4.38 TWH = 1.6 billion Yuan / 4.38 billion KWH = 0.365 Yuan / KWH. This is very close to China’s current residential retail electricity price of about 0.4 Yuan / KWH.
That suggests that new Chinese cool is very very dirty: no scrubbing of sulfur, particulates etc., at all.
“Coal”, not “cool”.
Siri…
Correction: in 2014, China made a total investment of 95 billion Yuan on fossil fuels power plants (not the 96 billion Yuan stated above)
If it is science that got us in this pickle, the peak oil predicament, how can science extricate us from the fine kettle of fish that science seems to have netted? Science is the Judas Goat leading us all to slaughter! The filthy swine science has become is too much! lol
Here is a hare-brained dream and scheme: Place, float and anchor wind turbines on ocean and sea waters, have them crank out electricity, set up the apparatus to use the anode and the cathode for electrolysis, pump out hydrogen gas right from the ocean water and into a vessel. Might as well make good use of the electricity. Multi-task wind power, makes more sense.
In 1700, nobody ever thought something like electricity for heat and light would be possible, just unimaginable at the time. No electricity today would cause some serious upheaval.
Thomas Jefferson did not believe there were such things as meteorites. If the evidence was there, he referred to them as ‘thunderstones’, a product of lightning and thunder. There is a good view of evidence of impact craters somewhere in Ontario and up into Ungava at Google maps, you’ll be able to see a few of them. They’re there.
No such thing as a meteor from space smashing into the earth’s surface from Thomas’s point of view, an unknown known for Thomas. Although, he could write some profound words that made you think. ‘We hold these truths to be self-evident’ were a few words he penned.
You can lead a bull to the whatchamacallit, but you can’t make him stampede.
In the timeline of human population accrued totals, the number is probably close to 85 billion beginning with Old Adam and stunningly beautiful Eve to today’s newest newborn.
Any loss of human population in any serious numbers in any given 100 year time period is merely a blip on the graph.
One difference between the Stone Age and the Oil Age, Peak Stone never happened. Peak Oil maybe is happening, maybe has happened, maybe not now, but sometime in the future, it will.
Think of Stonehenge as clear testimony as no such thing as Peak Stone.
If Thomas Jefferson can believe meterorites are caused by thunder and lightning, then, of course, the numbers of stones on the planet would be endless. A positive feedback loop if there ever was one.
If you think of oil originating like Thomas Jefferson thought of the origin of meteorites, from thunder and lightning, then oil can be from thunder and lightning too, following Thomas Jefferson’s logic, oilstones or thunderoil would appear like magic. That’s the ticket.
A return to the Stone Age has one advantage: stones will last.
Rebuild Stonehenge!
Probably was destroyed by a radical environmental group. har
Impractical. The cost to do this offshore is astronomical. I suggest you do a conceptual design using onshore located on the Falkland Islands. They are incredibly windy.
Ronald wrote “If it is science that got us in this pickle, the peak oil predicament, how can science extricate us from the fine kettle of fish that science seems to have netted? Science is the Judas Goat leading us all to slaughter! The filthy swine science has become is too much! lol”
It’s not the science that got us in trouble, it’s the prostitution of science to business ends that got us there. Basically, it’s greed with no moral limits that got us here.
~ Daisy Bell ~
“Daisy, Daisy,
Give me your answer do
I’m half crazy
All for the love of you
It won’t be a stylish marriage
I can’t afford a carriage
But you’ll look sweet
Upon the seat
Of a bicycle built for two…” ~ IBM 7094, programmed by John Kelly, Carol Lockbaum & Max Mathews
Here is something very interesting:
http://www.ft.com/intl/cms/s/0/def8d8f4-b532-11e4-b186-00144feab7de.html#axzz3RrAfQX1A
“New finds of oil and gas are likely to have been about 16bn barrels of oil equivalent in 2014, IHS estimates, making it the fourth consecutive year of falling volumes. That is the longest sustained decline since 1950.
Peter Jackson of IHS said: “The number of discoveries and the size of the discoveries has been declining at quite an alarming rate . . . you look at supply in 2020-25, it might make the outlook more challenging.”
The figures for declining discoveries are particularly striking because exploration activity in 2014 showed little impact from the sharp fall in oil prices in the second half of the year. The last time oil and gas discoveries were around 2014’s level was in the mid-1990s, when exploration activity was hit by a period of weak prices.”
So with record high oil price and exploration spending, we still find less and less oil. It definitely looks like we are heading for peak oil production soon.
Well that’s what Ron et al. seem to be saying…
I’m unsure I can imagine how this is going to affect things like the economy, country debt defaults, sovereignty, war-mongering, social unrest, protests, movements, rebellions, ecovillage expansions, etc., and if or how it’s going to make 2008 look like a Sunday picnic.
It cannot be imagined exactly how things will be affected by oil peaking, just generally.*
*By imagined, above, I mean in terms of useful forecasting. Of course, in the broadest sense, anything can be “imagined”. Just scroll around this page for examples.
Freddy, that’s only half the story. They reported finds in BOE.
Yes so it´s even worse if anyone missed that. 16bn boe and maybe 1/2 of it is oil. We use close to 30bn.
Actually it does not look good for gas production either. I think gas production could peak not that long after oil production peaks.
Continue with China’s observed electricity generating cost. See the above for China’s general electricity statistics and cost estimates for fossil fuels plants.
In this mini-post, I will focus on the nuclear power plants. My approach consists of four simple steps. First, I will calculate the impled capital cost. Secondly, I will use a simple formula to calculate the annual fixed cost. Thirdly, I will calculate the annual fuel cost (this only applies to fossil fuels and nuclear). Fourthly, I will calculate the annual total cost based on step 2 and 3 and use the annual total cost to calculate the “economic price” (or average generating cost) of different generating sources.
In 2014, China made a total investment of 57 billion Yuan on nuclear generating capacity, and 5.5 GW of new nuclear capacity were installed. The implied investment cost per GW of nuclear capacity was 10.4 billion Yuan. When 4 billion Yuan of matching grid investment was included, the total capital cost per GW of nuclear capacity was 14.4 billion Yuan or about 2.4 billion US dollars. By comparion, in the US, it now takes about 6 billion dollars to build 1 GW of new nuclear power plant.
To calculate the annual fixed cost, I simply assume that the annual fixed cost is 10% of the capital cost. 10% is assumed to include 5% for interest rate (or minimum rate of return on capital), 2.5% for depreciation rate, and 2.5% for operation and maintenance. Thus, the annual fixed cost for 1 GW of nuclear power plant is estimated to be 1.44 billion Yuan. This does not take into account the future cost of decommissioning and dismantaling, which could be comparable to the costruction cost.
If the nuclear power plant has a capacity uitlization rate of 85 percent, then 1 GW power plant can generate 1 GW * 8760 * 0.85 = 7446 GWH = 7.446 TWH.
According to World Nuclear Association, each gigawatt of nuclear power plant in average uses about 150 tons of uranium on a recurring basis. Assume the uranium price 50 dollars per pound of uranium oxide (equivalent to 130 dollars per kilogram of uranium). The annual fuel cost is estimated to be about 20 million dollars or 120 million Yuan.
Adding up the total fixed cost and fuel cost, the annual total cost equals 1.56 billion Yuan. The annual electricity generation is 7.446 TWH. Thus, the average generation cost = 1.56 billion Yuan / 7.446 TWH = 1.56 billion Yuan / 7.446 billion KWH = 0.21 Yuan / KWH. This is lower than the fossil fuels generating cost by about 40 percent.
The above calculation does not include cost of nuclear waste disposal. Nor does it include the future cost of decommissioning and dismantaling of retired nuclear power plants.
Personally I don’t think the ”decommissioning and dismantlement” of a WESTERN style nuclear plant is even NECESSARY in the sense that the words are used by environmentalists to scare the hell out of people about nuclear power.
The importance of removing spent fuel assemblies and storing them safely someplace that is geologically stable for the long haul cannot be over emphasized.
BUT ONCE the fuel is removed let’s just be a bit more realistic and a hell of a lot less religious and hypocritical about this matter.
I have never been privileged to see the pyramids but they have stood a long time and left undisturbed they would still be there for another ten thousand years at least and maybe fifty thousand or a hundred thousand still more or less in pyramidal form.
Let us suppose a typical containment building is sealed up after the fuel is hauled away by pouring a few thousand yards of concrete… If sea level rise doesn’t flood the site then my own personal guess is that the eventual leakage rate of hot stuff from the building will be trivially slow and of hardly any consequence except in the immediate neighborhood BY COMPARISION to the long term economic and ecological damages brought about by burning fossil fuels – AND BY A RETURN TO BURNING WOOD- which seems to me to be a VERY real possibility at some future time.
This may sound sort of ignorant and redneck but keep in mind the RELATIVE actual level of future problems is what I am talking about and that I am not talking about spent fuel but rather a reactor containment and its contents after the removal of fuel.
ANTI nuclear folks insist that things are going to have to be cleaned up PERFECTLY. Humans have never cleaned up any large scale mess perfectly and it is absurd to even consider the possibility in the case of fossil fuels use.It is also in my personal opinion absurd to insist on a wind driven level of snow white perfect cleanup in the case of nuclear power. In any case it is only going to happen in a few cases in the near term. Later on the insistence on perfection is going to yield to the reality of economic restraints.
I cannot even guess at specific numbers but the law of diminishing returns probably means that ninety five percent of the current estimated cost of decommissioning a nuke is going to be spent getting rid of the last one percent or less of contaminated infrastructure which just left sitting in a sealed containment is not going to be that big a problem compared to the need to spend the money on more immediate problems.
Now if the world were to go on a nuclear building binge this argument would fall apart fast. BUT I don’t expect nukes to be built by the hundreds or thousands at least not soon.I am not actually advocating any particular level of cleanup but rather trying to throw a little light on the issue.
I believe that US nuclear power plants are generally considered to be among the best managed in the world, operationally.
Their operational cost is 1.9 cents per kilowatt hour.
Dennis had a question about whether wind and solar electricity needs new grid investment and how grid investment cost should be shared. First, considering that grid investment benefits all existing generating capacity, it is reasonable to argue that all electricity generating facilities should share a portion of the grid investment cost probably in proportion to their generating capacity.
Second, unlike the US which has a mature electricity market, in China, both the gride and the generating capacity continues to grow rapidly. Without rapid expansion of grid to match the rapid expansion of generating capacity, mostly likely, many of the newly built power plants (whether renewable or not), cannot be put into productive use.
I find a table about China’s wind electricity by province in 2014, shown below:
The numbers are not too clear and barely readible. And I suppose most of you have not yet learned to read Chinese. But I can at least help you with this table and it contains some important information. For a better view of the table, see here:
http://www.sxcoal.com/dl/4045862/articlenew.html
The first row lists the variables. The second row is 合计 or Sum Totals. The first column lists all the provinces, starting in the third row with 北京 or Beijing.
The fourth column shows 新增并网容量 or Newly Added Grid-Connected Capacity, the first number in the fourth column is 1981.3, the unit is 10,000 Kilowatt. Thus, 1981.3 * 10000 KW means 19.813 GW. It means China installed 19.8 GW of wind electricity in 2014. This is somewhat smaller than the 23.35 GW of wind electricity that World Energy Council said China had installed in 2014.
The fifth column shows 累计并网容量 or Cumulative Grid-Connected Capacity. The first number is 9637.09, meaning China’s cumulative wind capacity at the end of 2014 was 96.37 GW. Move down along the fifth column, you can identify China’s most important wind electricity provinces. 河北 or Hebei province is on the fifth row, which had a cumulative capacity of 913.06 (10000 KW) in 2014, or 9.5 percent of the national total. 内蒙古 or Inner Mongolia is on the eighth row, which had a cumulative capacity of 2018.52 in 2014 or 20.9 percent of the national total. 甘肃 or Gansu province is on the tenth from the last row, which had a cumulative capacity of 1007.56 or 10.5 percent of the national total. 新疆 or the Xinjiang Uighur Autonomous Region (the vast region in China’s northwest with many muslim minorities), which had a cumulative capacity of 803.93 or 8.3 percent of the national total.
Now consider the seventh column, 弃风率 or Wind Abandonment Ratio, which tells the abandoned wind electricity as a share of total generation. The first number says 8%, meaning the national average wind abandonment ratio was 8 percent in 2014.
If one looks through the seventh column, you can see many 0%. But 0% all comes from provices that have had small amounts of wind installation. The big wind provinces all had quite significant wind abandonment. Hebei’s wind abandoment ratio is 12%, Inner Mongolia’s wind abandoment is 9%, Gansu’s wind abandonment ratio is 11%, and Xinjiang’s wind abandonment ratio is 15%. Clearly, in these provinces, growth of wind electricity is being hampered by the lack of grid investment.
Finally, consider the eighth column, 年利用小时数 or annual hours of utilization. The first number says 1893. That means the national average hours of utilization of China’s wind electricity was 1,893 hours in 2014. Out of the annual total of 8760 (365 * 24), it means China’s observed national average capacity utilization rate of wind electricity was 1893 / 8760 = 21.6%.
What I remember most about China is their excellent corn soup, the huge number of Chinese, super long coal trains, the Forbidden city, the Great Wall. and getting hit by a soldier when I didn’t stand in a straight line to look at Mao.
If You Average The High & Low Price – From 2000 to 2015
Bakken Oil Ranges From $34.09 to $66.09
With WTI Discount Spread – It Is What It Is…………………………………………………………………………………
The Years Above $66.09 Are Very Very Few – 5 In 15 At Best
http://bakkenboomorbust.com/aaacurrentbakkencrudeprices.jpg