North Dakota has published their Bakken Production Data as well as North Dakota Production Data.
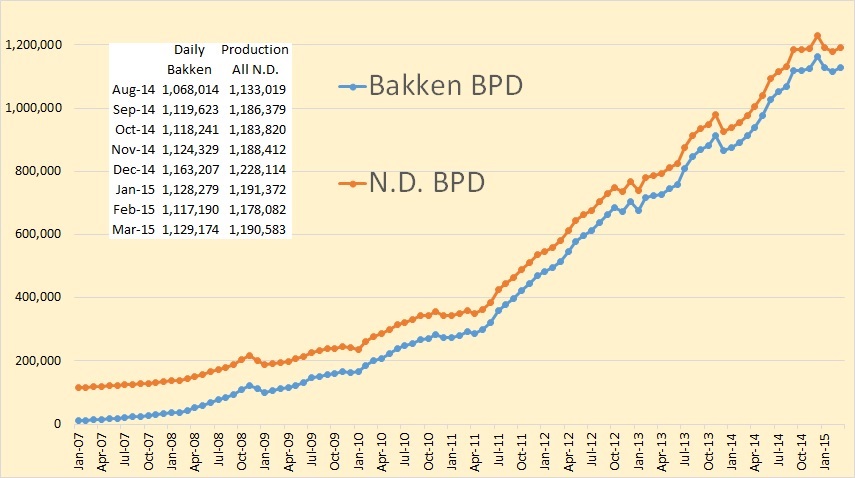
North Dakota production was up 12,501 bpd above February but still stands 37,531 bpd below the December high and is still 789 bpd below the January production numbers.
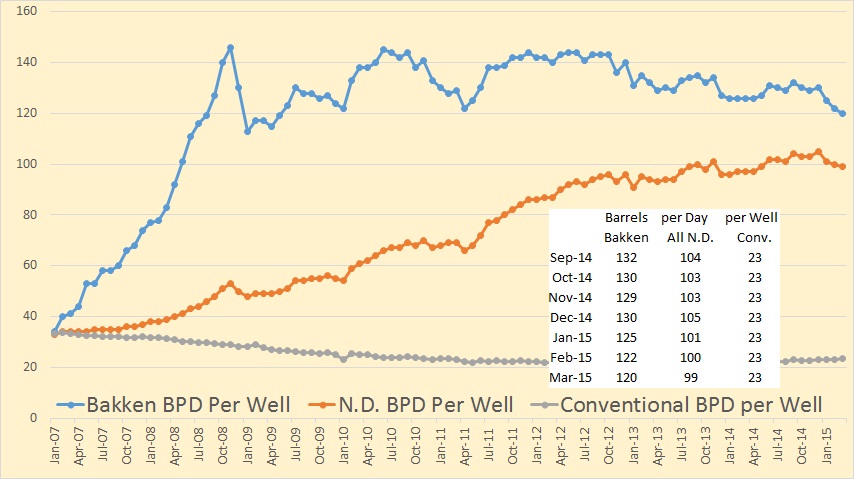
Barrels per day per well is dropping, 12o for Bakken wells, 99 forN.D. Total and 23 for Conventional wells.
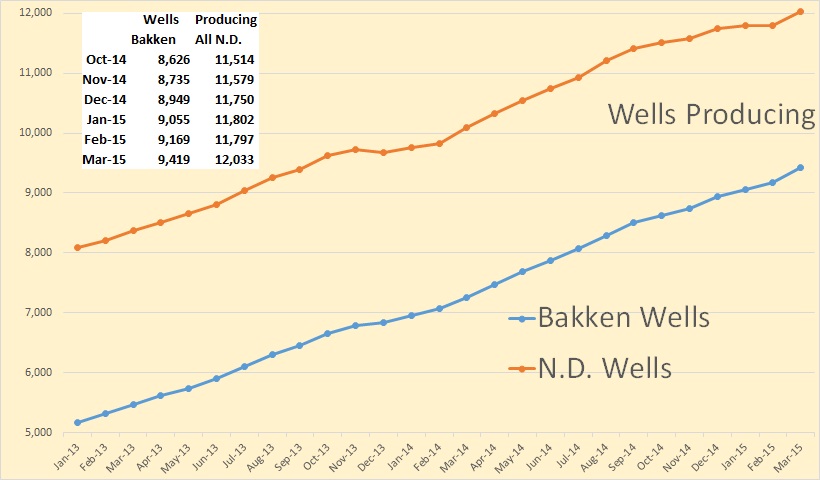
According to the NDIC stats the number of wells actually producing in the Bakken increased by 250 in March and total North Dakota wells increased by 236. Which means some non-Bakken wells were shut down. Lynn Helms said, in the Director’s cut, that the increase was 240 producing wells though his totals were different.
From the Director’s Cut:
Feb Producing Wells = 12,199
Mar Producing Wells = 12,439 (preliminary)(NEW all-time high)
9,397 wells or 76% are now unconventional Bakken – Three forks wells
3,037 wells or 24% produce from legacy conventional pools
Feb Permitting: 197 drilling and 0 seismic
Mar Permitting: 190 drilling and 0 seismic
Apr Permitting: 168 drilling and 1 seismic (all time high was 370 in 10/2012)
Feb Sweet Crude Price = $34.11/barrel
Mar Sweet Crude Price = $31.47/barrel
Apr Sweet Crude Price = $38.33/barrel
Today Sweet Crude Price = $46.00/barrel (all-time high was $136.29 7/3/2008)
Feb rig count 133
Mar rig count 108
Apr rig count 91
Today’s rig count is 83 (lowest since January 2010)(all-time high was 218 on 5/29/2012)
The statewide rig count is down 62% from the high and in the five most active counties rig count is down as follows:
Divide -77% (high was 3/2013)
Dunn -74% (high was 6/2012)
McKenzie -52% (high was 1/2014)
Mountrail -63% (high was 6/2011)
Williams -63% (high was 10/2014)
Comments:
The drilling rig count dropped 25 from February to March, 17 more from March to April, and has since fallen 8 more from April to today. The number of well completions2 rose sharply from 42(final) in February to 189(preliminary) in March. Oil price is by far the biggest driver of the slow-down followed by oil extraction tax triggers, NDIC gas capture goals, and NDIC oil conditioning rules. There were no major precipitation events, 8 days with wind speeds in excess of 35 mph (too high for completion work), and 1 day with temperatures below -10F.
Over 99% of drilling now targets the Bakken and Three Forks formations.
At the end of March there were an estimated 880 wells waiting on completion services, a decrease of 20. To maintain production near 1.2 million barrels per day, 110-120 completions must be made per month.
I bolded that last line because I flat don’t believe it. If they had 240 additional wells in March and production increased by only 12,500 barrels per day it will take one hell of a lot more new wells than 110 to 120 to keep production flat. Of course there is a difference between additional “wells producing” and “new wells completed” but that should make little difference. Old low or non producing wells are shut in so the number of “new wells” should be larger than additional “wells producing”, in most cases that is.
The EIA’s Short Term Energy Outlook just came out. All the data is “Total Liquids” and is in million barrels per day.
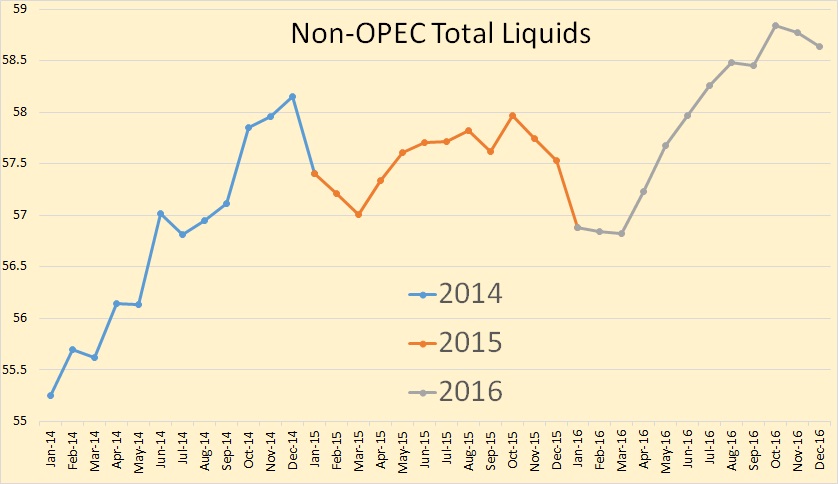
The EIA is actually expecting total liquids to decline from the high of the last three months of 2014, though the annual average would still be .83 million barrels per day higher. However they are expecting things to really take off again in 2016.
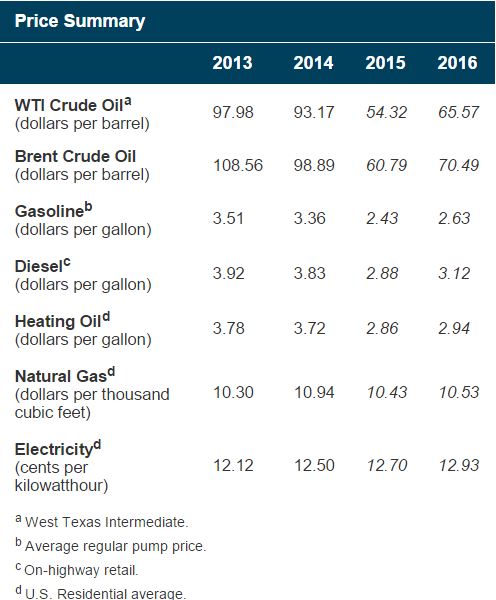
They are predicting WTI prices to average $65.57 next year. That is not enough, in my opinion, to allow a shale recovery. So I really don’t understand their reasoning.
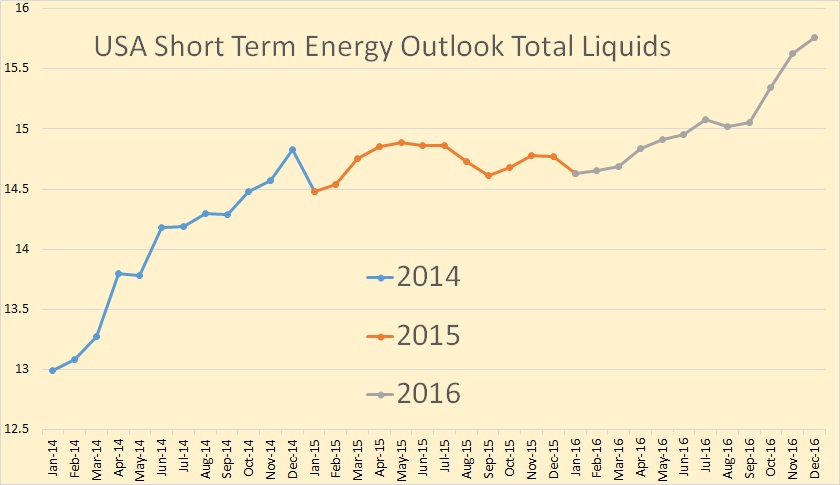
Looks like they are not expecting much of a production increase foe the US in 2015, closing the year below the December 2014 level. But they expect things to take off late in 2016. This is rather strange in view or their price prediction for 2016.
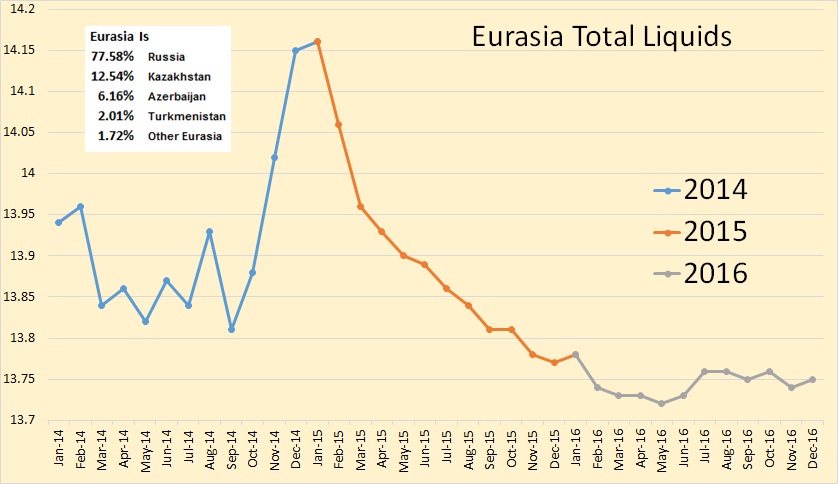
The only other really interesting prediction they had was Eurasia. They expect Eurasia to peak in January 2015 and decline pretty fast from that point on. Obviously they are not expecting Kashagan, Kazakhstan’s giant but troubled field, to come on line before 2017.
The decline is exaggerated here on this non-zero chart. From peak to valley is really only about 3% of total production. But nevertheless 3% is quite a lot from such a large producing area.
___________________________________________________________
Note: If you would like to receive an email notice when I publish a new post, then email me at DarwinianOne at gmail.com .
Enno Peters data shows 179 new wells began producing in March 2015 and production increased by 12,500 bpd. That means it would take at least 160 wells per month to keep production flat. If there were 150 wells completed in April then there will be at least a 10,000 bpd decline.
Hi Ron,
The first month that a new well produces it only produces for about 15 days on average because the well start dates can be anywhere from Mar 1 to March 31. So some of the boost from 179 new wells will occur next month.
Lynn Helms estimate of 120 new wells for flat output is correct as far as I can tell. Enno has also run some simulations which show the same thing and Rune Likvern has also said that although 140 new wells are needed for the first month, that the number of wells needed to keep output flat falls to about 110 new wells after 10 or 12 months (from memory), with an average of about 120 new wells per month for 12 months (if I am remembering correctly). Chart below showing modelled output for the North Dakota Bakken/Three Forks with 120 new wells added each month from April 2015 to Dec 2016.
The first month that a new well produces it only produces for about 15 days on average because the well start dates can be anywhere from Mar 1 to March 31. So some of the boost from 179 new wells will occur next month.
Geeze Dennis, I know that. But half of the new wells from February were responsible for the increase this month. It works the same, month after month.
Lynn Helms estimate of 120 new wells for flat output is correct as far as I can tell.
No, he is off by a country mile. It will take about 150 to 160 new wells per month to keep production flat. That is what the data from the past 12 months tells me,
Feb + March well completions is 241. Divide by 2, and we can guesstimate that the 12,500 bpd drop is equivalent to 115.5 well completions.
Gotta say 120 well completions to stay flat sounds like a good estimate.
I agree with Ron about number of wells needed to keep production flat. There were 152 new wells in January and 160 new wells in February and production fell a bit in February.
I tried to attach a graph showing number of wells put on production each month (not completion month). But it didn´t work :(..
Hi Freddy,
There seems to be a size limit, try using gif format to reduce file size and use fewer pixels (smaller image.)
Usually 50 kB or less works.
It’s starting to look like the new wells are not as productive as the ones in the past. Past posts have talked about running out of sweet spots. Or maybe these are shorter horizontal lengths with less fracks?
I have heard talk about a new method to make the wells much less expensive, I wonder If that is being implemented.
Actually, I have some graphs with one month after first production data that shows that the wells have produced as good as or even slighty better than older wells. February was a really really good month for McKenzie. There seems to be some problems attaching files. So not sure I can show them. The decrease in production is because the number of new wells is a bit lower than before.
You are both right. The confusion arises from the meaning of “keeping production flat”. Is it for the next few months, then Ron is right. If you talk about the long term (> 6/12 months), than Dennis is right. About 120 wells per month (plus/minus 10) are needed to keep production at 1.2 m bpd for the coming years.
I have posted the following graph a few months ago.
Yes that sounds reasonable. Older wells decline slower. But you have assumed that future wells will produce as good as current wells?
Yes, it’s just a simple projection. I have no idea how future well curves will look like.
Hi Enno and Freddy W,
It turns out that I was assuming new well EUR had increased in 2013 and 2014, if that is wrong and EUR has not changed (or not by as much as I had assumed which was about a 16% increase from Dec 2012 to Jan 2015), then Ron is correct, about 150 new wells per month are needed long term to keep output flat and about 160 new wells short term (next month). Some comments on this down thread.
Hi FreddyW,
I agree with Enno, I am looking at a steady number of wells that will keep output relatively flat over 12 to 24 months. About 140 to 150 are needed for the first couple of months, then fewer wells are needed. I know that Ron won’t be convinced, but it seems that you Enno and I are in agreement.
My scenarios assume that well productivity decreases starting in June 2015 with a gradual increase in the rate of decrease for 12 months. A maximum annual rate of decrease is reached in June 2016 at 7%/year. This is just a guess based on adding 120 new wells per month, if wells are added at a faster rate, the rate of decrease is higher, if the wells added per year doubles then the rate of decrease doubles.
Essentially I pick a rate of decrease that causes the URR of 40,000 wells to be 10 Gb (USGS mean estimate).
The date that this begins is a wild guess. We won’t be able to tell until 12 to 24 months after it has begun.
Yes pretty much. But as I showed last time, completing a new well close to an old one, cause the old well to increase production because of well interference. This causes the average decline rates to look more favourable than it would have been without well interference. Up until 2014 the number of new wells has increased every year. I suspect that if the number of new wells stay flat, then decline rates for older wells will increase a bit. If they stop completing new wells entirely in an area, then I expect decline rates in older wells in that area to increase substantially. Currently, the average production for wells completed in 2008 has actually increased the last year or so because of well interference (as I discussed last time). So I think a bit more than 120 wells per month may be needed.
Hi FreddyW,
The well interference idea is interesting. Sometimes the older wells may be refracked as well. Looking at the data for some of the closely spaced wells, it looks like the old wells did increase output when new wells were drilled and I had thought it was due to a refrack, but your idea makes more sense.
As wells get very closely spaced we may see more of this, but decline rates may steepen as well.
For now I have assumed that the increased output in 2013 and 2014 will result in higher EUR per well, instead we may see achange in the shape of the well profile with a steeper decline over the fist 24 months and overall EUR unchanged from the 2008 to 2012 average (or perhaps lower).
Freddy, is the production increase in older wells when a new well is drilled caused by the new well fractures extending close to the older well area of influence?
I’m used to the term interference, but I see it as interference between two transients causing a boundary which in turn leads to pseudo steady state. Is the term interference used for hydraulic fractures?
Fernando
I do not know if Freddy has confirmed info on this topic, but the term ‘halo effect’ has been used for the past couple of years to describe this.
When an existing well is temporarily shut down as nearby wells are frac’d, pressure readings on the shut in well can spike dramatically. When these wells resume production, it is quite common for output to rise from pre-frac levels and stay elevated for many months.
As far as I know, there are several theories trying to explain this with no unanimous, provable answer, yet.
Hi Fernando and coffeeguyzz,
I don´t know the exact reason. I have just observed the phenomena in my data. I did consider pressure buildup as the reason. But the production is three times the original production and I always find a well close by being completed at the same time. So I think some sort of communication is more likely in these cases.
Hi Dennis,
Yes absolutely, I think that is a possibility. Looking at the latest yearly production profiles I can see that the decline rates for 2013 and 2014 are for sure higher than earlier years the first 12 month. Then for 2013 it seems to follow the 2010 and 2011 curves. 2013 and 2014 has only recovered something like 10-15 thousand barrels more during the first 12 month compared to earlier years. So if that trend continues, then that is the extra amount of oil they will recover. But the decline rates may as well turn out to be higher than earlier years.
Hi FreddyW,
Thanks for your insights.
My thinking is that the recent output increase may be due to more frack stages and higher proppant levels during the frack job have increased the initial flow rates. The total amount of oil recovered over the life of the well may not change because there is only so much of the original oil in place that can be recovered profitably.
So initally the decline rates will be steeper, but later the decline rates may be less steep.
Eventually the sweet spots will be fully drilled and then estimated ultimate recovery(EUR) of the average new well will begin to decrease.
Freddy, Dennis
What you – Dennis – just mentioned is a HUGE component in all the plans/computations that companies bring to bear in these matters, specifically higher, earlier returns at the expense of future production.
Recent case in point … in the Utica, a company just used Gasfrac’s methods and got the expected early ‘bump’ in IP.
However, as has been the case these past years, the higher flows were not sustained.
There is still a massive amount of data gathering, analyzing and theorizing occurring in these fields.
Maybe it’s a combination? Let me think about it. You know, if this is happening it may mean water injection will work in the future. Crazy.
Fernando,
You are one step ahead in the thought process, but I’m thinking the players involved are a couple of yards ahead in their projections.
Pure speculation on my part, but if you were an operator with, say, six wellbores, each two miles long and spaced 500’/600′ apart, and felt you could pressurize the matrix with, say, liquid/gaseous CO2, field gas (being done successfully right now by DeeThree in Canada, nitrogen or some combination, you may very well increase your recovery by several percent.
As it is, 90%+ of the hydrocarbons are still in place.
This is why there is ongoing research and field trials in attempts to utilize this massive underground collection grid that – at present – is being significantly underutilized.
Coffeeguyzz, I’ve served as a “Typhoid Mary”, providing consulting services to companies wishing to have a peek into un patented technology owned by other companies. The amount of work that goes on isn’t visible to most company engineers, and some of what they do is really far out. But I’ve found the work doesn’t bring to bear all the tools they could use.
I suspect these tight zones are suitable for some sort of EOR, but they need to try it ASAP, because the processes work better if the oil viscosity is preserved close to the initial value. And sone of the more exotic techniques require incredibly high prices.
I thought about it. I suspect most of the rate increase observed in a fracked well after it´s shut in to frac offset wells is caused by flow from the naturally fractured reservoir into the hydraulic fractures. This means the well pressure will build up or increase as the fluids pack the fracture system and the well itself.
I´m under the impression such wells being shut in to frac offset companions are mostly in a transient flow regime (the negative pressure pulse caused by the well hasn´t reached a boundary, the well behaves as if it were producing an infinite reservoir). Even if the natural fracture system has very low permeability, the hydraulic fractures have a large contact surface, which means they should “recharge” with fluids.
Regarding the use of EOR, I think they need to step way out of the box on this issue. For example, it´s common to prescribe keeping injection pressure below frac pressure in injectors. However, I´ve found a fracked injector isn´t that undesirable. In some cases it´s necessary to get enough injectivity. I don´t think ANY simulations, tests, or pilots which maintain a low injection pressure will work worth a darn.
Fernando
I have not been following events too closely, but two years ago, DeeThree used one lateral wellbore in a field of ten, I think, to re-inject gas in the Upper Bakken Silt formation in Canada.
They reported 20%/30%/ increase in output and arrested decline rates.
Their plans called for placing one injector for every future 3 or 4 laterals.
As a follow-up to your observations about watching ExxonMobil’s actions, they (XOM) have announced a new, proprietary frac’ing process, XFrac, that has greatly enhanced effectiveness as well as speed. Despite my extensive checking, I found almost no detailed description of the process, although the few available tidbits of info lead me to suspect it is some iteration of the coiled tubing conveyed Bottom Hole Assembly that appears to be poised to rewrite the frac’ing processes everywhere.
XTO, XOM’s subsidiary, is going balls to the wall drilling up in the Bak.
I thought a year ago we stopped believing there had to be a relationship between new completions and production breakeven. We were seeing several months with quoted numbers that blew apart all scenarios proposed.
Ron somewhere made the point that mid month doesn’t matter because previous mid month is in play and so in raw form 150 new completions * what xxx bpd first month? = what’s the legacy decline now (where legacy is defined as all wells past month 1). Thought it was supposed to be 90K bpd by now.
So pick any bogus number you want for xxx and that will tell you how many wells offset 90K. If xxx avgs 800 bpd month 1, then 90K/800 = 112. If month 1 avg flow is 400 bpd then you gotta have 224 wells — unless truckers decide to go on strike. Then you can complete all the wells you want and you’ll flow nearly nothing.
Hi Watcher,
Two problems.
First legacy decline in the DPR is not correct, it is between 55 and 60 kb/d not 90 kb/d for March 2015.
Second, the legacy decline changes over time and depends on the number of wells drilled.
As a simple example, assume all legacy decline comes from the most month of new wells drilled prior to the current month. If 200 wells were drilled last month the lagacy decline would be higher than if 100 wells were drilled.
A more detailed example down thread.
In my comment above “most month of new wells drilled” was supposed to be “most recent month of new wells drilled”.
Hi Ron,
Hopefully this explains it, as charts are not convincing it seems.
Link to spreadsheet below:
https://drive.google.com/file/d/0B4nArV09d398cGg5Z2NEREY4MEk/view?usp=sharing
A more extensive spread sheet at link below with slightly lower well profile. New estimate, 127 wells needed for flat output.
https://drive.google.com/file/d/0B4nArV09d398dTNOWFBEMmVYYTg/view?usp=sharing
New wells fall from 180 to 135 over a 6 months and then gradually to 127 new wells per month over 6 to 18 months for flat output in ND Bakken/Three Forks.
Chart below shows (as Enno suggested) that Ron is correct initially that about 150 new wells are needed, but it gradually falls over time (read number of new wells per month on right axis). My 120 new wells per month estimate was wrong, it is about 125 to 130 new wells per month needed for flat output (127 new wells from July 2016 to July 2018). The average number of wells per month from July 2015 to Dec 2017 is 130 new wells per month in the chart below.
Something interesting I saw looking at EOG’s Parshall Field production information for March, 2015 as reported on the ND site which was released yesterday.
EOG had 310 wells listed in Parshall Field for March, 2015. The average production per well was 132.22 barrels of oil per day, which is above the Bakken average of 120 reported by the State of ND for March, 2015.
However, I also noted that of the 310 wells, 72 were either shut in or produced less than 30 barrels of oil per day for March, 2015.
Parshall is considered to be one of the top producing fields in the North Dakota Bakken. Yet over 23% of the wells are now below 30 barrels per day. Maybe there are some reasonable explanations for that many low producers besides massive decline rates?
It would be really interesting to see EOG’s lease operating statement for Parshall for the first 3 months of 2015. I assume the 2014-2015 wells are carrying the earlier completed wells.
Shallow
I did a quick scan of the permit #’s of EOG’s Parshall wells and, unsurprisingly, many are pre #20,000 – indicating that they are ‘older’ wells (a precise recounting could be had by accessing the wells’ histories via the ND subscription service).
It is recognized by the managers’ statements over the years that EOG is postponing full development of the Parshall for several reasons, including a main focus on the Eagle Ford.
EOG has been in the forefront (as usual) in the nascent area of secondary recovery processes in the shale fields. There has been much speculation that the suits have yet to identify the optimal field design so as to incorporate both maximal infill spacing as well as future secondary recovery efforts.
The adjacent Sanish field – viewable on the ND Gis map – provides a glimpse of future Parshall development.
Hi Ron,
The point is that 180 new wells will be different from 160 new wells, in March there were a lot of wells relative to Feb, but not all of the increase will happen in the first month also this affects legacy decline, so it is probably best to look at three month output averages which will smooth out some of these effects.
Also remember that the legacy decline is not fixed, as the number of wells added each month falls, the legacy decline(in kb/d) also falls. In April 2015 the legacy decline will be 58 kb/d and 148 new wells are needed for flat output, by April 2016 (if output remains flat) legacy decline falls to 50 kb/d and only 128 new wells are needed to keep output flat. In this scenario first month output is assumed to fall from 427 b/d for a new well in April 2015 to 415 b/d in April 2016 (due to new well EUR decrease starting in June 2015).
Note that the new well EUR is assumed to fall at a 7% annual rate from June 2016 into the future until new wells are no longer completed at the 127 well per month rate. Output starts to decline in 2019 due to new well EUR decrease.
In April 2015 the legacy decline will be 58 kb/d and 148 new wells are needed for flat output,…
The below copied and pasted from the DPR Bakken data:
Now I am not saying that 82,161 was the actual legacy decline in April but I would bet my social security check this month that it was one hell of a lot closer than 58,000 barrels.
Hi Ron,
You are correct.
I was using the 2008-2012 average well profile for my legacy decline calculations rather than the higher output from the 2013 and 2014 wells. Legacy decline is about 80 kb/d.
In my reworked model (using new well profiles for 2013 and 2014 wells estimated from Enno Peter’s dataset). The first month for the average 2014 well is about 500 b/d. There were 179 new wells in March, and if we assume the 2014 well approximates the 2015 wells, so output would increase by 89.5 kb/d from these new wells.
Actual output increased by 12 kb/d, so legacy decline would be 77.5 kb/d if all new wells produced for the full month.
I realized that I was using the lower well profiles for the average 2008 to 2012 well for my legacy decline calculation, you are correct that 58 kb/d is too low for legacy decline. Using the correct first month output of 500 b/d for 2014 and 2015, legacy decline is 79 kb/d in March 2015 for the model and falls to 76 kb/d by June 2015 if 150 new wells per month are added from each month from April to June. For April the legacy decline rises slightly to 80 kb/d, close to the DPR value (which includes Montana and North Dakota).
The reworked model is at link below:
http://peakoilbarrel.com/bakken-data-short-term-energy-outlook/comment-page-1/#comment-516966
Note that I also agree that if new well EUR has remained about 345 kb from 2008 to 2015 with the shape of the well profile changing over time, then about 150 new wells will be needed for flat output, rather than the 130 wells I estimated with the assumption that new well EUR had increased in 2013 and 2014.
So you are right on that point as well, if average new well EUR has remained relatively constant since 2008.
Ron Patterson said:
It’s all part of The Beautiful Story.
Plentiful and cheap oil, and Russia down for the count; what more could one ask for?
http://i.imgur.com/4OoyMKl.png
From today’s IEA Oil Market Report:
“the strong performance of some other sources of non-OPEC supply defied expectations. Russian oil companies seem to be coping exceptionally well with lower oil prices and international sanctions, thanks to a flexible tax regime that lightens their fiscal burden as prices drop and to steep cuts in production costs that came courtesy of the rouble’s depreciation. Russian production jumped by a steep 185 kb/d year-on-year in April.”
Thanks Glen yes there is a beautiful story that we are all to believe. The economy is recovering we are at full employment and no inflation (did I mention energy independence and that Russia sucks?) Anyway it will be interesting to see how this all plays out and yes this play will play out in spite of manipulation of the price of crude. It is interesting that every time metals and oil are up the stock market gets smashed. The junior sector in mining and oil E&P companies and explorers have been destroyed as central planners, banks and politicians continue to pick the winners and the losers. So energy independence, flying pigs, unlimited debt and fiat all have about a zero percent chance of coming true.
t is interesting that every time metals and oil are up the stock market gets smashed.
Otherwise known as “the business cycle”.
The more things change…
Nick I am talking about day by day not the business cycle. Wow.
Above I had an interesting discussion with Freddy W and Enno Peters about the number of wells needed to prevent output from declining in the North Dakota Bakken/Three Forks.
If the EUR of the average new well has been increasing since 2012, as I have assumed since I have had access to Enno Peter’s data gathering from the NDIC, then only 130 new wells would be needed over the long run until about 2019. Enno agrees (until new well EUR starts to decrease) and Freddy W thinks I have underestimated, Ron thinks it is at least 150 new wells per month and probably more like 160 new wells per month.
Freddy W and I seem to agree that the new well profiles from 2013 and 2014 indicate steeper decline over the first 12 months than earlier (pre-2013) wells. One possibility is that the shape of the 2013 and 2014 well profiles have changed to something with steeper initial decline with a flatter decline in the later months with the overall estimated ultimate recovery (EUR) of the 2013 and later wells remaining at previous levels (around 350 kb).
I created hyperbolic well profiles for the average 2013 and and average 2014 Bakken/Three Forks well based on the limited data available (14 months for 2014 and 26 months for 2013). These were added to my Bakken/Three Forks model and as expected, the results are very different.
from the earlier model. This “new” model requires about 147 new wells per month from July 2015 to Dec 2016 to keep output from declining.
Note that Ron has been telling me this for months, now I agree, if the assumption that new well EUR has remained relatively constant over the 2008 to 2014 period is correct. We can only guess as to what the actual recovery from the average Bakken/Three Forks well will be.
If we assume an average of 147 new wells per month are added each month from April 2015 to Dec 2019 and EUR begins to decrease in June 2015 and reaches a maximum annual rate of EUR decrease of 8% in June 2016 we get the scenario below (optimistic because debt issues may not allow this level of new wells in the future).
Economically recoverable resources are about 6 Gb through 2030 under the oil price assumptions in the chart. I have raised OPEX and other costs to $12/b (previously I used $8/b) and transport costs were raised to $14/b (from $12/b before), OPEX is assumed to rise at a real rate of 3% per year, real well cost starts at $8.1 million and it is assumed to increase at a real rate of 3% per year starting in Jan 2016. The real discount rate is 7% (10% nominal assuming 3% inflation), royalties and taxes are 26.5% of wellhead revenue.
Per recent conversation and what’s the Bakken constituent content and Jeffrey’s magical chart of distribution yield per API rating . . . .
I suggested cutting gasoline usage is somewhat meaningless (beyond China just consuming whatever you cut) — in that the theory of cutting gasoline usage reduces crude oil consumption is not proven. If you cut gasoline usage you do not particularly affect diesel and jet fuel usage, which require the same amount of crude to be refined in order to achieve their required quantity.
The rebuttals were well you can make diesel from any carbon. True, and you can make crude oil from methane. But you don’t and won’t. Too energy intensive.
And Jeffrey’s suggestion which I elaborated on . . . if you are looking for middle distillates and can’t get them from shale oil, you stop buying shale oil and let it accumulate in storage, and use imported, diesel/kerosene rich imports. My elaboration . . . since reducing gasoline consumption doesn’t reduce diesel consumption, then you have no impact on crude oil consumption. You’ll still have to refine crude and balloon gasoline storage.
Well lo and behold, this from the oil refinery wiki:
Oil refining in the United States[edit]
In the 19th century, refineries in the U.S. processed crude oil primarily to recover the kerosene. There was no market for the more volatile fraction, including gasoline, which was considered waste and was often dumped directly into the nearest river.
The rebuttals were well you can make diesel from any carbon.
That was in the relatively long term, so focusing only on that is misleading. In the short term refineries can make modest adjustments to their output product mix fairly easily and cheaply, and gasoline can be substituted for diesel used to move people and freight. In the longer term refineries, shippers and drivers can make larger adjustments.
Uhhh, we need a real oil refinery Chem Eng. here (instead of a very rusty physical chemist),
but my take is that tweaking a big distillation column more than 5% or maybe 10% is an invitation to trouble. The columns have bubble trays with cap sizes, etc., outlets welded into certain places along the column, associated heat exchangers and reflux loop; all calculated around mass flow rates and temperature based upon what the cuts are from the planned feedstock (que Jeffery’s chart of fractions vs. API, though also note the “dumbbell crudes” situation, where two fluids at the same API may have vastly different amounts of any given fraction).
There are also crazy issues like keeping flow rate high enough to move fouling particle out of the column and associated heat exchangers to avoid premature plugging, or some contaminant like nitrogen in a new crude causing unwanted polymerization thence clogging, etc.
If you cut back on the content of something coming out (either one thing a new crude is low in, or everything that a new crude has except what you want), you have to slow down everything, which screws with the heat flow and the mass flow, which screws with the efficiency of the bubble trays separation ability. You can only tune your heat exchangers, etc. a certain amount before you end up hiring some hot shot consultants to revamp the refinery, then a bunch of welders and fabricators.
Read the PDF down at the bottom of this linked page for a taste of the issues:
http://www.revamps.com/articles/consider-retrofits-to-handle-highviscosity-crudes/
This PDF is about modeling distillation:
http://razifar.com/cariboost_files/Some_20Practical_20Aspects_20Of_20Modeling_20Crude_20Oil_20Distillation.pdf
from above:
“The product final boiling points are controlled by draw rate, not fractionation”
translation: what I said above, what Watcher said in his post above:
a chain is only as strong as its weakest link.
n.b. if you slow your refinery down to a new weakest link for no good reason, then your utilization rate gets bad, economics goes to hell, and the guy(s) with Profit & Loss responsibility above you fires you.
This:
http://www.turnermason.com/blog/2013/07/16/no-free-lunch-refiners-have-to-invest-to-take-advantage-of-advantaged-crudes/
says Flint Hills spent $250 million to change their Corpus Christi plant to be able to run Eagle Ford crude and condensate.
repost of:
U.S. refiners turn to tanker trucks to avoid ‘dumbbell’ crudes
http://www.reuters.com/article/2015/03/23/us-usa-refiners-trucks-analysis-iduskbn0mj09520150323
“In a pressing quest to secure the best possible crude, U.S. refiners are increasingly going straight to the source.
Firms such as Marathon Petroleum Corp and Delek U.S. Holdings are buying up tanker trucks and extending local pipeline networks in order to get more oil directly from the wellhead, seeking to cut back on blended crude cocktails they say can leave a foul aftertaste. …”
tweaking a big distillation column more than 5% or maybe 10% is an invitation to trouble.
That’s what I meant by “In the short term refineries can make modest adjustments to their output product mix”.
On the other hand, 10% would be a pretty meaningful change in allocation.
actually you’re doing good. Chem E’s just by order tanks from catalogs anyway
I was trained in a plant with a distillation unit (part of my basic training back in the 70’s), and I was allowed to play with it to tune my computer models (those were the early days of computer modeling of plants, and my boss knew zero about them, so I had a free hand even though I was a rookie).
The distillation unit can be forced to make more of a given product. The ability to do so is enhanced if the overall capacity is reduced, or there’s excess heat exchanger and overhead cooling capacity.
The feed can also be modified upstream of the distillation unit feed. This can be done using a brute force approach running the crude through a desalter (heater treater train) to drive the light ends off, which of course leads to a richer feed to an NGL recovery unit (which in turn may choke on it unless that hot gas is cooled and fed to a knockout drum).
When I was being trained I was encouraged to dream up these schemes, run the models, and if possible test the plant a bit. But I had a very easy going environment. I remember one time I cooled the top too much, drove pressure down, which led to excess boil off at the bottom. This dropped the fluid level, the alarms went off, and the plant automation system went into full emergency shut down.
Nowadays the models are slicker, and I can think of a few low cost solutions they can put in within 30 months to help them process more light crude. A simple stabilizer sounds like a no brainer. As I wrote before, if I wanted to capture more sales to the USA I would strip the crude before it gets sent to the USA. This would allow the imports to match the light USA blends.
LOSING CONTROL can be harmful to ones financial health,
Most folks in here know me as the so-called Gold-Silver Bug. That being said, I haven’t posted much on the subject over the past several months… even though I believe its highly relative to the oil market. We must remember, ENERGY is the DRIVER, while FINANCE is supposed to STEER the economy.
Just wanted to share a little TID BIT of info. I speak to some very interesting folks in precious metal and financial industry. I chat with someone (regularly) who was very well connected in the start of the great financial derivatives market in the 1990’s. Let’s just say, he knows a great deal about the FRAUD called Derivatives.
Anyhow, the European and U.S. Bond markets cracked last week Wednesday. Ever since then, we see serious volatility in early market trading than the massive liquidity comes in to save the day. Well, according to some interesting sources there is a real threat of a lack of liquidity going forward and this may impact the markets in ways that no one is quite prepared.
I truly believe all the nice charts and graphs showing a subtle decline in U.S. Shale Oil as well as Global oil production will be overly optimistic. I don’t think folks really understand just how propped up and highly leveraged these markets truly are.
When the day comes that the U.S. Treasuries fail to find a BID or the broader stock markets open and we see liquidity dry up and blow away… the next day, the U.S. will be a much different place. Unfortunately, the U.S. financial system died in 2008, and all the Fed and Member banks have done is prop it up with more and more lousy paper.
This will end badly… and probably virtually overnight. At that point, it will be interesting to see just how much capital the Shale Oil & Gas Industry will be able to access to continue the DRILLING TREADMILL.
steve
When the day comes that the U.S. Treasuries fail to find a BID or the broader stock markets open and we see liquidity dry up and blow away… the next day, the U.S. will be a much different place. Unfortunately, the U.S. financial system died in 2008, and all the Fed and Member banks have done is prop it up with more and more lousy paper.
Why would the Fed allow Treasuries to find no bid? And if HFT engines allowed the stock market to crash 90%, why would not a president, any president, issue an executive order restoring prices to their previous level by law and deny anyone who complains access to courts.
Money . . . numbers on a screen . . . will never end this. The folks, the zillions of folks looking for this particular apocalypse because they can see that the system has completely departed normalcy, somehow those same folks can’t make the intellectual leap to recognize that if the system is completely departed from normalcy, there is no reason at all why what I just said could not happen.
Watcher,
I didn’t say the Fed would stop printing and propping. But as you are firmly aware there is this competing organization called the BRICS AIIB Bank. At some point time, the Chinese will announce they have something north of 10,000 metric tons (maybe 15,000+ mt) of gold and that should do wonders for the nitwits who think gold is something you put around your neck.
Regardless, I count on the Fed and member banks continuing business as usual. However, the Chinese and Russians know the U.S. Dollar’s days are numbered. Which means, at some point, the Fed can print as much Crap Federal Reserve Notes as it wishes, but it will not be able to prop up the Dollar any longer.
By the way Watcher you said this: “And if HFT engines allowed the stock market to crash 90%, why would not a president, any president, issue an executive order restoring prices to their previous level by law and deny anyone who complains access to courts.”
Watcher, while you have provided some excellent comments here, this is not one of them. You of all people should realize the Stock Market is nothing more than a Ponzi Scheme, worse than 2007. How can the President order a return to high values if the values aren’t worth it?? LOL
Probably by 2020, Americans will realize what it is to live as a THIRD WORLD COUNTRY.
steve
Watcher – can you let this go unchallenged? From SRS – “You [Watcher] of all people should realize the Stock Market is nothing more than a Ponzi Scheme, worse than 2007.”
The stock market it is the value of most of the large businesses in the US. So, if someone “gave” you all the stock in Coca Cola, you would reject it since it is worthless? GE, McDonalds, Facebook, Tesla, Apple, Proctor & Gamble, Johnson & Johnson, Exxon and on and on with thousands of names. Mostly all owned by retirement plans.
“Ponzi Scheme” – Probably the most ridiculous statement I have ever seen in print.
It’s like Rush Limbaugh says. “It’s best for me not to say much about some things, because, of course, once I have spoken there’s nothing more to be said.”
haha
Besides which, if oil scarcity arrives and denies P&G and Coke the ability to get product to market, then indeed their prices do collapse.
But that’s not the point. The point is money is invented. You can redefine it anyway you want. Things are worth NOT an analysis of net present value of future flow of money. They are worth, somewhat precisely, what someone is willing and able to pay for it.
So the prices fall 90%. The prez looks around the table and says “this shall not stand”. I’ll craft his executive order for him.
“I hereby declare martial law, and as Commander in Chief I order the following steps. The Federal Reserve will purchase one share of stock in all companies of the S&P 500. The price paid for each share will be its price last Friday. The seller selected will be from a cross section of major brokerages, who will select from their clients at random to sell 1 share of their holdings at this premium price. The Fed is willing and able to execute these transactions and define a new price.
This will restore all prices to their level of last Friday. Trading will then resume with a regulatory imposition of no downticks as a rule. Buying and selling of shares may resume but no transaction can take place at a lower price than the last.
All short sales open at close of business last Friday will be closed out at that price. No securities lawsuits will be permitted for the forseeable futures.
It is my intention that martial law will remain in place for no more than 90 days, but this is not a hard limit.”
That should cover most of it. If anyone finds a loophole, they’ll be arrested and assets confiscated. I guarantee you no one will complain about having their asset prices restored. The shorts who hoped for a windfall will get nothing.
There’s nothing in what I just laid out particularly different from abrogating mark-to-market, which has already been done (and remains abrogated).
I agree with Watcher. Even before declaring martial law, in fact I believe right now it is in the National Interest to keep the ball rolling by whatever means possible. Preferably with a little discretion to allow everyone there plausible deniability.
As someone said awhile back its a game of last one standing and if the BRICS challenge the dollar in any meaningful way it will be considered an act of war so I don’t believe they will do it.
I read that Russia and Chinas position is to prepare for war but do everything possible to avoid it.
I think there are problems with the state theory or constitutional theory of money too.
If only things were as simplistic as the various monetary theorists believe they are, we could eliminate all the chaos and uncertainty from human existence.
“This will restore all prices to their level of last Friday. Trading will then resume with a regulatory imposition of no downticks as a rule. Buying and selling of shares may resume but no transaction can take place at a lower price than the last.”
That would not work. There would be no market and foreign capital investment would quickly halt. There is no need to declare martial law, or for an executive order. Its very likely the US would follow Japan, the Fed will do the buying of stocks to prop them up with more QE. However, if we look at Japan it has not helped their economy. It been stagnate for over 25 years, but appears to be slow reaching its limits, as Japan need ever larger amounts of QE in a shorter period to keep it afloat. Sooner or later they will need start increasing QE 10x for each cycle and this will unleash the hyper-inflation genie. Once Japan goes under, the rest of the industrialized world will have a tough time continuing there own QE programs.
Proping up the stock market would not prevent massive unemployment. Companies will continue to layoff workers if the don’t need the production or labor. Despite that Stock prices have more than doubled since 2009, hiring has remain virtually non-existent. The US is moving towards automation which needs much fewer workers and companies prefer stock buybacks than expansion. The stock market is not the real economy, No matter how much manipulation a gov’t takes on the stock market will not save the real economy. People can not spend/consume resources that don’t have.
For the last 15 to 20 years the US economy managed BAU but substituting real production with debt. The debt bubble can’t really grow further, so the US economy is in a permanent state of stagnation and nothing the gov’t can do will prevent an collapse when it unfolds. At best they can stretch it out for a while. The US economy has been in a state of decline since the 1980’s. US Manufacturing Peaked in 1979, and by 1987, the US switched from a net creditor to a net debtor. Debt is being used to hide the economic decline.
FWIW: energy is “real” money, Without an ever increasing energy supply the “real” economy can not grow. When the energy supply shrinks, so will the “real” economy. Energy is needed for production, nothing can be produced, or shipped without energy. This should be extremely obvious.
The debt bubble can’t really grow further, so the US economy is in a permanent state of stagnation and nothing the gov’t can do will prevent an collapse when it unfolds.
A conservative investor would steer clear of both stocks and bonds right now.
But those with excess cash keep putting money into them, presumably because they don’t see other good investments.
At what point do they decide these stocks and bonds are worthless and decide to either not invest in anything or to switch to other investments?
Seems like as long as they put their capital into overvalued investments and don’t sell those investments, the bubbles will keep growing.
At what point do they decide something else has real value? Will they start buying up water, fertile land, and preservable food stuffs?
I am curious when investors are going to pull out. They should have done so by now if they were value investors.
What’s going to trigger a stock market and bond market collapse?
clueless,
I’ll respond to you… if you don’t mind. Anyone who follows the broader stock markets besides the typical nitwit American who believes everything coming out of MSM, realizes the Dow & S&P500 are ready for one hell of a CLIFF DIVE.
Now, this might not happen tomorrow, next week or next month, but it’s coming. The U.S. Stock market is so overvalued and oversold, the forces of gravity will cut valuations like a sledge hammer.
The U.S. Stock Market, Treasury Market and Retirement Market are all PONZI SCHEMES.
Now, Watcher may be correct that the Magicians at the FED and US GOVT will fight like hell to continue propping it up, but this is not sustainable over a long time period.
The GREAT FINANCIAL ENEMA is coming. Grab your cherry cola and popcorn.
steve
Almost everything that everybody owns is purchased with money. And almost all of that money came from wages. And almost all of that money came from corporations that paid wages. [Generically] – How did you buy your house? How did you buy your car? How do you pay for food? How do you pay for clothes? How do you pay for almost everything? From wages? Which almost all come from corporations. Which almost all have value AND WHICH ARE NOT PONZI SCHEMES!! WTF – I think that I have discovered the PERFECT definition of STUPID.
Clueless,
For starters you can watch the video below by Ray Dalio
http://www.economicprinciples.org/
And read the report below from Bank of England on “Money creation in the modern Economy”
http://www.bankofengland.co.uk/publications/Documents/quarterlybulletin/2014/qb14q1prereleasemoneycreation.pdf
Rune,
I should know better. One can’t debate a PROPAGANDA Mentality with LOGIC. All we can do is wait for the fundamentals to kick that finally pushes the system over the cliff.
Then I would imagine these folks will have to WAKE UP and smell the coffee.
steve
Just ignore him ClueLess,
I’ll bet your net worth is more than 10 times that of Steve’s. Those that have failed in life commonly justify their mistakes with this kind of nonsense wishing it on others. That being true, I’m sure Steve lives a “FINANCIAL ENEMA” everyday.
Oh heavens it’s not that bad.
There are a lot of people walking around who flat out know from a lifetime of experience that what they see around them is not the money world they grew up in.
The rants then unfold and anger and, frankly, flailing for a “solution” via gold or bitcoin or shorting this or that.
Right about here someone is supposed to start a paragraph as “what they don’t realize is” or “what they don’t understand is” or “what they get wrong is” and there is no need.
Oil scarcity has forced all of these measures to . . . as a guy above just said, keep the ball rolling. Keep the wheels turning. Redefine rules, break them, create new ones . . . do whatever it takes to keep the wheels turning. As FASB said when they erased mark to market . . . “enforcing this standard would benefit no one”.
Similarly, embracing reality and informing the public of it . . . would benefit no one. Letting the wheels stop turning helps who?
Fair play that kills many people is no longer the principled thing to admire or pursue.
But that which is inevitable is inevitable. The Fed will try to print oil, but it can’t be printed. They are just buying time, praying for a miracle (haha in a foxhole) and if you were sitting on the FOMC, you would do the same thing. Flail and invent new things like QE . . . to keep the ball rolling and hope some miracle (rather than the equally probable disaster) uses that time bought to unfold.
Depending on how malleable and adaptive the system is, it may start ‘flipping poles’ and inventing new tricks and responses to better ride the peak oil shrinkage downslope.
If it can create new prices, new decrees, etc., perhaps it can create new policies, salaries, job fields, democratic adjustments, and better, maybe somehow ‘inverted’ financial/political responses to the realities of diminishing oil, etc., supplies and increasing environmental dangers.
Hey clueless I like your name and I would agree that you are in fact clueless. Stocks are overvalued even when using zero interest rates (Gibson’s Paradox). But bonds really are the biggest ponzi in the history of man so what happens to stocks when bonds don’t get a bid like is now starting to happen around the globe? Do you really think the Fed controls the bond market long term? They call it QE but it’s true definition is counterfieting and it will fail.
There is no long term. Because of oil.
The Fed can buy as many bonds as it wants and at any price it wants to pay.
Who would stop them?
History
Watcher,
The basic mechanism for the worldwide bond bubble is the trade surplus of emerging countries, which is invested and sterilized by central banks in mostly Treasuries. So worldwide central banks (China, Japan, Brazil, India,….) buy Treasuries and save this money on behalf of their citizens. However, these investments are never meant to be spent, hence the term ‘sterilized’. When oil prices and other import goods rise, emerging countries have less surplus and can spend less money on Treasuries. This is exactly now the case. When the oil price rises, less money is available for Treasuries and interest rates rise and the dollar falls. If the FED would do too much QE on its own, the dollar would fall and this would be very inflationary. So there is a limit for the FED to do QE. It is much more elegant that foreign central banks sterilize Treasuries. The question is how long can they do it. A low oil price certainly helps.
Sterilization has to do with controlling the net injection of money by selling one part of the yield curve as another is bought. You have your definition wrong.
A long end purchase is sterilized by a short end sale. Or vice versa.
Heads up people, been watching the US budget deficit. Month after month it is missing CBO projected target. I suspect this year will be $500B or so.
This is paper that was getting scarce before and a reason for suspending QE. This week’s auctions do appear to say foreign CBs are buying US paper at auction (the Fed is not allowed to buy at auction, it must buy from the primary dealers when QE is active).
Watcher,
What you are referring to …by selling one part of the yield curve as another is bought…. has been done by the FED years ago and is called operation twist. This does not increase the amount of bonds, yet adjusts the shape of the yield curve and is neutral to the dollar. Sterilization on the other side does increase the amount of outstanding bonds, yet as the bonds are bought by a foreign central bank, it actually strengthens the dollar – and lowers the currency of the buyer. I stick to my definition of sterilization of bonds.
We’re running out of replies Heinrich. You understand Twist so you should understand sterilization, but we won’t dwell on this because it’s actually another of those definitions that didn’t exist 10 yrs ago (like QE).
Clueless wrote:
“Almost everything that everybody owns is purchased with money. And almost all of that money came from wages. And almost all of that money came from corporations that paid wages.”
Unfortunately, most if its was bought using debt, or future wages.
Clueless wrote:
“How did you buy your house? How did you buy your car? How do you pay for food? How do you pay for clothes? How do you pay for almost everything? ”
Not wages, but debt. Very few people buy homes or cars using cash. Most borrow to pay for these items.
“Which almost all come from corporations. Which almost all have value AND WHICH ARE NOT PONZI SCHEMES!! ”
“had value” would be more appropriate. Corporations have been using debt. Since the 2008 crisis, companies propped up stocks with buybacks, financed with…. DEBT!
The executives of public traded companies are rewarded by keeping stock prices high. So rather than make better products or services, its just easier to borrow and issue stockbuy backs. Its pretty close to a Ponzi scheme.
http://fortune.com/2015/02/11/stock-buyback-binge/
https://fortunedotcom.files.wordpress.com/2015/02/buybacks1.gif
Corporate Debt:
http://3.bp.blogspot.com/-5FVlwP0VUU0/VKnQUUygU2I/AAAAAAAAP-E/6FHIXOumSuE/s1600/Screen%2BShot%2B2015-01-04%2Bat%2B7.23.49%2BPM.png
Clueless, I suggest you do a bit study on different kinds of money – M0, M1, M2 and M3. Physical volumes of all the things do not change much in a short period of time (say, one year) but money (especially, M2 and M3) could increase a lot during the same period. Hence, the idea of current financial engineering conducted by central bankers being similar to a Ponzi Scheme is not without merits.
The U.S. Stock market is so overvalued and oversold,…
Don’t you mean “overbought”?
Ron,
LOL… that’s my Archie Bunker syndrome. Yeah… OVERBOUGHT…
steve
Steve,
China will back their currency with gold? Never going to happen. They have a fiat money just like everyone else. Why the hell would they ever back their currency with gold? It would be a death sentence for their economy if they did. You don’t really understand money if you think otherwise. The yuan would become so overvalued to other currencies they couldn’t export anything they manufacture. If they back it with gold then they can’t print all the yuan they need to keep all their ponzi going. Or do you believe the US dollar is the only ponzi out there?
SAWDUST,
I never said the Chinese would back their currency with Gold, but instead there is rumor of Gold Trade Notes. Regardless, there is good reason why the Chinese Govt continues to acquire a great deal of gold quietly. There was a brief announcement earlier this year that the Chinese may finally release their official gold holdings in May, but that is now postponed for whatever reason.
Again, I see no reason why the Chinese are acquiring so much gold if they don’t have plans for it. This is also true for Russia. Anyhow, the days of the U.S. Dollar world reserve status is coming to an end.
Lastly, STOCKS, BONDS and most PAPER ASSETS are based on the economic principle of NET PRESENT VALUE. This is sort of a financial time machine. The market calculates future earnings and sets a price today. What happens when U.S. Shale oil production finally heads south in earnest.. along with the rest of the world?
How will the fall in oil production impact all that highly leveraged paper garbage masquerading as ASSETS??
steve
How will the fall in oil production impact all that highly leveraged paper garbage masquerading as ASSETS??
There is a logical alternative to paper currency based on faith? Really, people talk about fiat currency as if there was some kind of an alternative, something else they could choose. If so then it would behoove you to tell us what it is and how it would work.
Ron,
Going back to sound money such as gold will likely be impossible as it will be to run Dallas, LA, Manhattan, Chicago or whatever other metropolis on say half of the oil production we are using today. Of course, as production continues to decline, the situation will likely become even more dire for these cities that can only survive on plentiful HIGH EROI ENERGY.
I really don’t know what would work to tell you the truth. There have been several alternative monetary systems using some sort of physical backing (Gold-Silver-Oil-etc) thrown around in the precious metal community, but I have no faith on whether they would work.
That being said, I do know that GOLD & SILVER have been high quality stores of value and money for thousands of years. The reason I trust gold or silver is due to the ECONOMIC ENERGY locked in each 1 oz coin. A certain amount of energy in all forms and in all stages went into the production each coin of gold or silver.
Basically, its bought and paid for economic energy, whereas the U.S. Dollar and most paper assets are ENERGY IOU’s. Now, the U.S. Dollar fiat monetary regime worked hunky-dory since 1971 when the world continued to increase global oil production (and debt). However, the peak and decline of Shale & Global Oil production will be a BEE-OTCH to this highly leveraged paper system.
Again… RON, I really don’t know what kind of alternative monetary system that could work, but I do know what assets will hold (or increase) their value in the future while most physical and paper assets will decline.
I believe the U.S. Dollar or U.S. Treasury and or broader stock markets will have a Bear Stearns-Lehman Brothers event. One day the stock price is over $100, and the next… you can’t find a buyer at $2.
Steve
Steve, only a tiny fraction of all money exist in paper currency. Most of it is just a bank computer entry in thousands of banks around the world. And it is transferable via electronic signal, in milliseconds, between banks though they may be on the other side of the world.
That would not be possible with any physical form of money, be it shells, rocks or precious metals.
Ron,
Yup… that’s the problem. Electronic Digits. Again, I never said a physical backed monetary system would work. Rather I said most paper and physical assets will decline in a peak oil environment. Whereas, Gold and Silver will hold (or increase) their value.
BIG DIFFERENCE.
steve
Steve,
I bought into the gold/silver/precious metal bug when I first started reading about peak oil and finance.
After “warning” my family and friends about fiat currencies….I now feel like an idiot. Not surprisingly they don’t care about my opinion now!….LOL!!!
All that gold and silver stuff is complete bullshit.
The unit of currency doesn’t have to have hard “value”. As if silly rocks have value.
It simply has to be trusted enough that you can take it to a video store and buy a porn movie…Try that with a gold nugget…LOL!!!
Paper and electronic digits work fine as long as you can trust the integrity of the system.
Zerohedge and all these gold bug sites are nuts.
Lesson learned!!
My Post is my attempt to try to help others to not make the same mistakes I made:
Do not scare your friends and family by screaming about fiat currencies. You will be labelled as the nutbag on the family tree…FOREVER…LOL!
Fiat currencies work great !!! (excluding inflation/deflation)….LOL!!!!
The gold bugs, the Austrians, the monetarists, they’re all looking for some silver bullet to slay the monetary monster, to put monetary policy on auto-pilot.
This sort of magical thinking, when put in practice, has invariably had disastrous consequences.
John Kenneth Galbraith, writing in Money: Whence It Came, Where It Went, warns of the magical thinking of the various schools of monetary Utopianism:
Galbraith goes on to explain how Keynsian monetary theory also ended up being vitiated.
Despite what the monetary Utopians claim, there really is no to way remove humans, along with everything that implies, from the monetary equation or from monetary policy making.
This of course doesn’t preclude evangelists from the various schools of monetary Utopianism — the latest I suppose being MMT — from proclaiming their version of truth as being self-evident and beyond dispute.
Ron dismantles Ron Paul and the other gold bugs in one post.
I never thought of that. You couldn’t ship the gold fast enough.
Also running a trade deficit on the gold standard would mean you were effectively exporting your gold supply.
I think Karl Denningers “One Dollar Of Capital” is the best system I have seen to structure a financial system.
Karl thinks peak oilers don’t understand thermodynamics or chemistry so his idea might not be popular here. Hydrocarbons are just a battery, doesn’t matter where they come from.
I’ve never seen him comment on flow rate.
Let the games begin!
Boltzmann Brain IV.
So, you feel like you got burned buying precious metals. I understand that. However, your assumption that precious metals have no fundamental need going forward is typical of those who forget 2,000 years worth of history.
Again, the Chinese & Indians are acquiring gold hand over fist. Now, if the Chinese or Russians weren’t adding gold to their reserves, then maybe you might be correct. But, we see quite the opposite.
The mentality in the WEST is to believe in PAPER GARBAGE. That’s fine with me. The next great financial shock will wake up the living dead. Assumptions change all the time…. however, the collapse of the U.S. Dollar and Treasury market should do wonders for folks who have faith in paper.
steve
“…the point of money is that it makes intermediation easy…
Intermediation… is the process by which other people insert themselves between the producer and the consumer of any good or service, and take a cut of the proceeds of the transaction. That’s very easy to do in a money economy, because—as we all know from personal experience—the intermediaries can simply charge fees for whatever service they claim to provide, and then cash in those fees for whatever goods and services they happen to want… Money is a system of arbitrary tokens used to facilitate exchange, but it’s also… the framework of laws, institutions, and power relationships that creates the tokens, defines their official value, and mandates that they be used for certain classes of economic exchange. Once the use of money is required for any purpose, the people who control the framework—whether those people are government officials, bankers, or what have you—get to decide the terms on which everyone else gets access to money, which amounts to effective control over everyone else… ” ~ John Michael Greer
Thank you, John…
I sort of skimmed this kind of thing in my previous comment under a previous/recent article hereon using the ‘Kid and Cae-Dad’ dialogue.
When we talk about money– gold/silver/shells/tally-sticks– (or is that currency?) we need also to talk about who/what is deciding how it works. And we need to talk about it from an anarchic perspective too.
“Until you change the way money works, you change nothing.” ~ Michael Ruppert
Caelan MacIntyre,
To reiterate what I said back up the thread, I think there are also problems with the state theory or constitutional theory of money.
Don’t tell the Marxists or the neocons this, or for that matter the adherents of any political doctrine based on Fichte’s political philosophy, but there are limits to what can be achieved with state violence.
If only things were as simplistic as the various monetary theorists believe they are, we could eliminate all the chaos and uncertainty from human existence.
Steve,
I have no doubt that metal has value in an industrial capacity or that humans may value certain metals.
My wife loves gold, diamonds, silver and the like. My wallet doesn’t. LOL!!!
I have no doubt you could run a money system on these things.
As Ron points out, with the internet and the fact that transactions take place in milliseconds, these units of currency are no longer plausible.
If you can get past Denninger’s guns, birther and climate change nonsense, his “One Dollar of Capital” idea is pretty good IMO.
and I am an expert in converting world economies to new financial systems BTW!! LOL!!!!!
In Denninger’s system every dollar of commercial lending must be backed by a dollar of capital (not gold). Everything must be marked to market daily.
The money system doesn’t have to change. But banks can’t inflate at will by expending credit out of thing air. They must have the capital to back it up.
If they make bad decisions, they eat it. Not the citizens.
Note this is not 100% reserve banking.
thanks!
seems like the Chinese like US Treasuries as well as gold..
http://www.bloomberg.com/news/articles/2015-05-15/china-s-holdings-of-treasuries-rise-for-first-time-since-august
1.00 ZWD = 0.00276319 USD
0.00276319 USD times 390 equals 1.05 usd.
How many Zimbabwean dollars equals one US dollar? Answer: 390
Ten dollars, 3900 zwd
100 usd, 39,000 zwd.
One troy ounce of gold is 1223 dollars, so you will need 390 times 1223 to have enough Zimbabwean dollars to buy an ounce of gold.
That would be 476,970 Zimbabwean dollars.
Good thing there are one hundred trillion Zimbabwean dollar notes, you could use one one hundred trillion dollar Zimbabwean note to buy an ounce of gold and receive 99,999,999,520,030 Zimbabwean dollars in change.
Those Zimbabwean one hundred trillion dollar notes are the way to go when it comes to cash on hand.
Fiat currencies can really be the answer to all of those financial problems.
Just one one hundred trillion dollar note from Zimbabwe would pay off the US national debt in a heartbeat and have 83 trillion dollars remaining to spend some way.
What difference does it make if the dollars are from Zimbabwe or the US? It’s all paper and digits, it really wouldn’t matter that much.
The US Treasury can buy one on Ebay for 21.50 usd, so they should really buy some and balance the budget overnight.
You could buy everything on the planet with those 100 trillion dollar Zimbabwean notes.
Thanks for the post Ron.
A quick update of 2 graphs.
My impression is that the so-called “fracklog” is dropping as fast as never before : if I count correctly, about 124 wells were spudded in March, while just over 180 wells were starting production. What is strange is that this is different from what Helms is mentioning (he mentioned 900 wells in Feb, and 880 wells in March spudded but not completed, a drop in fracklog of 20 wells). I think the drop in the fracklog is closer to 70.
And graph 2) (keeping them below 50 kb)
Looks like more than 50% of production is from wells less than 15 months old.
With low recovery amounts as shown in your graph, the cost of drilling and fracking has to fall considerably to make economic sense. At $40 per barrel it barely covers the cost of the original well in ten years.
A big fracklog is not something new. In fact there was more than 600 wells waiting on completion in the Bakken in 2014.
From North Dakota’s DMR presentation:
Enno,
Looking at the dates for when wells were spudded, more than 90 of the wells that were reported to have started to flow in March 2015, were spudded in September 2014 or earlier. That according to your data tables based on NDIC.
If shale companies are given the choice to borrow more to drill or conserve cash/pay down debt, almost all will borrow more and drill.
Most of the guys running these companies are gamblers and have lived on the financial edge at various times in their lives. They have drilling fever. Does not matter much if it makes financial sense. As long as they can get their hands on the $$ they will drill and complete the well. They have a huge number of locations out there and by golly they are going to drill them until the banks and investors say they can’t. Drilling is the way they achieve their “high”.
Just operating existing wells is boring. Ever notice how 95% of the shale conference calls and investor presentations focus on drilling, less than 5% on operations? Just operating existing production is boring to Wall Street too. It is much tougher to market existing production where the production and financial parameters are pretty much known. The possibility of a “gusher” is always easier to market. The oil business has been this way for 150 years.
I wonder what the long term business plans of companies like Continental, Whiting, etc. are? Do they envision a time when they will become income generating companies that pay dividends? Once they have drilled up their US shale locations, where are they headed next? What will they look like in 2025?
FWIIW
Shallow,..and others taking an interest
I updated my estimate on cash flow for Q1 2015 for Bakken(ND).
Assumptions average well cost $8.5M, added producing wells as per NDIC statistics, which may vary month from month from other sources, but the total over time should be close irrespective of how the counting is done.
For Q1 2015 the companies in Bakken had an estimated total negative cash flow of about $2Billion!
Rune,
Could you summarize your analysis?
Average: numbers of wells per day, drilling vs completion cost, gross oil price received, opex?
Nick,
I just did.
Gross oil price is WTI (monthly).
Flow as per NDIC reports.
Average well cost is from spud to flow (which includes drilling and completion).
OPEX (including transport), financial costs, royalties and taxes as stated in my previous posts.
http://fractionalflow.com/2015/03/21/is-the-red-queen-outrunning-bakken-lto-extraction/
Rune,
I think it would be helpful to give the actual average numbers for each of those basic parameters.
Nick,
Could you pls be more specific?
Something like this (these numbers are randomly made up):
Wells drilled: 360
Completed: 300
Average overall drill cost, including completion: $8.4M
Avg completion cost: $4.2M
Bbls produced: 100M
Average gross oil price received: $40
Avg opex/bbl, including royalties & taxes: $10
Other? Admin & overhead? Interest? Dividends?
Nick,
If you read Ron’s post, the comments here and looked at his figures and my post I linked to, you would have most of those figures.
Apart from that you may have a look at companies’ quarterly financial statements and their 10-Ks.
Well, could you just show the calculations that produced $2B in losses?
Nick,
I said nothing about losses.
You have all the data to run the estimates yourself.
Nick G. I think in previous posts I summarized the cash burn of both Whiting Petroleum and Continental Resources. Neither breakdown Bakken financials from other plays in their 10Q from the first quarter 2015. They are number 1 and 2 in terms of net production in the Bakken, I believe.
I will try to look at those again later and give you exact numbers, but as I recall, each burnt about 3/4 of a billion dollars in Q1 2015. That is for all plays, but Bakken makes up the vast majority for both. I think combined average production for those two was around 340,000 BOEPD in all plays. Whiting is about 90% oil and Continental is about 70%.
Again, I’m not in a good place to look it up right now but will. The above is from memory.
It would not surprise me if Rune’s $2 billion cash burn figure in the Bakken is conservative.
I am positive that CLR borrowed 790 million on its line of credit in Q1 of 2015 and another 250 million on its line of credit in April, 2015.
Whiting issued over one billion in common stock and convertible notes.
As I stated recently, Continental is on pace in 2015 to borrow the equivalent of 35% of the State of Oklahoma budget for FY 2014-2015. That is even with cutting rigs by over half. Only an oil price spike will cause a different result.
Shallow,
I hold my $2B (cash burn for Q1 15 for Bakken (ND)) to be conservative. A more detailed analysis (and thus time consuming) would be preferred.
FWIIW I also use a metric (amongst several) for leverage (total debt on net cash flow) and it has so far not been higher than it was for March 15 (this is based on estimates as from Jan 2009).
Rune, I believe you and like Shallow, am surprised it is not more. I can assure you there is at least that much negative cash flow from the Eagle Ford, 1st quarter 2015, and more. The LTO industry keeps writing checks it cannot cover.
At the risk of pissing people off, the speculating about how many Bakken wells its going to take each month to keep production levels level is like sitting on the couch watching TV while the house burns down. This shale stuff is a financial disaster unfolding before our very eyes. I have no idea how the shale industry is going to survive the next 12 months much less pay 300 billion dollars of debt off.
What am I missing?
Mike
If prices rise sharply, all is well.
If not, then late investors (who are piling in with senior positions) get returns, and early investors get diluted or wiped out.
There’s an enormous amount of cash floating around looking for high ROI, even with large risks.
Mike,
My focus for some time has been what cash will the companies have available (from operations and external funding) for well manufacturing and how will they service their growing total debt.
130ish fracks should cost what, almost 1.3 billion dollars/month.
Someone is lending that. These are serious numbers.
Nick, if prices rise sharply is yet another hypothetical and even if they do I personally don’t believe all is well. I know a little bit about well economics, decline rates, and managing oil and gas revenue; I don’t see how these shale companies can continue to provide a valuable source of energy to America under mounting, massive debt loads. In my opinion, that’s what we should be worried about.
Mike
Rune, I know precisely what your focus is on, and why, and I am grateful for your work. I personally believe its time to declare peak oil production worldwide, or whatever, and move on to what’s next. If LTO production is so bloody important to America, Americans better be worried about how the shale oil industry is going to survive. The US shale industry has NOT been a financial success story; anyone that believes that has a bad case of debt denial.
Thank you again for leading the way on this issue. It’s important.
Mike
Hi Mike,
I would think the wheels fall off this train(LTO production) at some point for the reasons given by Rune, Shallow Sands, and you.
At some point output falls and oil prices increase, then LTO production might increase. You would be able to guess better than me because you have seen busts before, but if oil goes to $85/b and stays there wouldn’t output stabilize at some lower level?
Eventually output falls to the point where oil prices go back to $100/b (maybe by 2017?) and LTO output slowly increases or at least stops decreasing.
If a bunch of these companies go belly up, won’t some of the bigger companies swoop in and buy up some of the better leases?
Dennis, I don’t know what the price of oil is going to do in the future. I believe very strongly, however, that the sustained period of high price stability the shale oil industry wallowed in for 7 years is over. I believe that significantly changes what we can expect, or predict from the LTO industry in the future.
The LTO industry is in no way self sufficient, as evidenced by the debt it has and it’s current income situation (Rune). How much swooping occurs, how many more wells get drilled, how many more un-frac’ed wells get frac’ed all depends on where the money is going to come from outside the LTO industry.
Mr. Edpas down hole makes a valid point about the LTO industry. It has previously been “rewarded” by an abundance of inexpensive money to borrow; the price for that has been the booking of reserves. How much longer can that precarious relationship go on in the price environment we’re in? At the moment far more oil inventory for those shale guys is going out the back door, than is coming in the front door.
Mike
Shallow. That is most likely exactly the psychology at work here. True to the founding myths of the American project. LTO/OilSands looks to me like a high tide mark in this idea of the limitless continent given by God for ruthless exploitation/despoilation…
Probably no one has summed up the United States’s secular religion, which is still very much with us today, more succinctly than Joseph Priestly, Thomas Jefferson’s long-time friend and correspondent:
More recently Andrew Carnegie articulated the same national faith when, after acclaiming the rise of man from lower to higher forms, he declared: “Nor is there any conceivable end to his march to perfection.”
In 1939, Charles E. Merriam of the University of Chicago, the dean of American political scientists, wrote in “The New Democacy and the New Despotism”: “There is a constant trend in human affairs toward the perfectibility of mankind. This was plainly stated at the time of the French Revolution and has been reasserted ever since that time, and with increasing plausibility.”
As Reinhold Niebuhr notes in The Irony of American History, the “descent from Puritanism to Yankeeism in America was a fairly rapid one.”
Or as Robert H. Nelson put it in Economics as Religion:
shallow sand said:
Where’s the hope for a glorious future in that?
Speculation is characterized by its almost exclusive insistence on prophecy as distinguished from the more old-fashioned appeal to the past.
Speculation raises its technique of making statements in the form of predictions to a height of efficiency of method and absurdity of content because there is hardly a better way to avoid discussion than by releasing an argument from the control of the present and by saying that only the future can reveal its merits.
I reviewed the short term energy outlook tables and it seems to me the production forecast for several countries (Argentina, Colombia, others) is too high. These are countries with fairly marginal fields, the production and oil price forecast don’t match.
Flow is collateral.
An interesting development. According to NASA, so far each of the first four months of this year was the second warmest among the same months on record.
January 2015 was the second warmest after January 2007. February 2015 was the second warmest after February 1998. March 2015 was the second warmest after March 2010. April 2015 was the second warmest after April 2010.
Together, the first four months of this year were the warmest first four months for any year on the record. The first four months of 2015 had an average temperature 0.79C higher than the first four months of 1951-1980, 0.1525C higher than the first four months of 2014 (the warmest year) and 0.015C higher than 2010 (the second warmest year).
bunch of egghead rocket scientists. what do they know….
If all they are going to do is give us bad news, we should cut their funding.
I agree, but it’s very hard some days to tell reality from lies with all the bull being presented in the whole climate change theory. Yes I understand that pretty much every major science group believes in man made climate change. But I’m also informed enough to know that all of these groups exist because of funding they get to agree with the theory. So who can you really believe? Case in point, check out in some detail the stated data that is supposed to have made January 2015 the second warmest January ever. In the big picture, it’s easy to see that Alaska is shown a very, very warm January. Ok, now check the actual weather for the month of January in every major city in Alaska. It was almost 2 degrees colder than average across the board in all the cities. This just under 5 degree difference is simply huge…how could NASA get the measurements so wrong? Did they do it deliberately (as equipment error would not produce the gradual errors anybody taking a deeper look at the data can see)?
Wonderful piece of misleading bull shit.
The problem probaly lies here:
http://www.newyorker.com/humor/borowitz-report/scientists-earth-endangered-by-new-strain-of-fact-resistant-humans?mbid=social_twitter
But I’m also informed enough to know that all of these groups exist because of funding they get to agree with the theory.
Yeah you are so right! How could anyone possibly trust SciAm?! Look at the stuff they make up!
http://www.scientificamerican.com/article/dark-money-funds-climate-change-denial-effort/
Scientific American lost a lot of credibility after it published Dr. Mann´s “False Hope”. I critiqued this article in my blog if you care to read it. I also find their website has a lot of simple minded propaganda.
I have subscribed to Sci Am for years, and I saw a pretty strong shift in editorial policy a few years ago. This coincided with the naming of a new editor, who in turn works for a Nature Publications general editor who has a really extreme political position. As far as I´m concerned the Nature publications are tainted. It´s subtle. Similar to the neocon warmongering we see in The Economist and the NY Times. Nature publications has a gig to promote global warming hysteria, which in turn is used as a political Trojan Horse by the extreme left. It´s really interesting to see how these things get done.
“Scientific American lost a lot of credibility after it published Dr. Mann´s “False Hope”.”
You lost all credibility with that statement.
“Nature publications has a gig to promote global warming hysteria”
Nature publications have gig to publish actual science. That’s why all the denial shows up in blogs by people like Watts, who took 7 years to flunk out of college, and not in the PNAS.
Here’s a list of
A) National and International Scientific Organizations That Hold the Position That Climate Change Is Not Caused by Human Action
—
B) National and international Scientific Organizations That Hold the Position That Climate Change Has Been Caused by Human Action.
Academia Chilena de Ciencias, Chile Academia das Ciencias de Lisboa, Portugal Academia de Ciencias de la República Dominicana Academia de Ciencias Físicas, Matemáticas y Naturales de VenezuelaAcademia de Ciencias Medicas, Fisicas y Naturales de Guatemala Academia Mexicana de Ciencias,Mexico Academia Nacional de Ciencias de Bolivia Academia Nacional de Ciencias del Peru Académie des Sciences et Techniques du Sénégal Académie des Sciences, France Academies of Arts, Humanities and Sciences of Canada Academy of AthensAcademy of Science of Mozambique Academy of Science of South Africa Academy of Sciences for the Developing World (TWAS) Academy of Sciences Malaysia Academy of Sciences of Moldova Academy of Sciences of the Czech Republic Academy of Sciences of the Islamic Republic of Iran Academy of Scientific Research and Technology, Egypt Academy of the Royal Society of New Zealand Accademia Nazionale dei Lincei, Italy Africa Centre for Climate and Earth Systems Science African Academy of Sciences Albanian Academy of Sciences Amazon Environmental Research Institute American Academy of Pediatrics American Anthropological Association American Association for the Advancement of Science American Association of State Climatologists (AASC)American Association of Wildlife Veterinarians American Astronomical Society American Chemical Society American College of Preventive Medicine American Fisheries Society American Geophysical Union American Institute of Biological Sciences American Institute of Physics American Meteorological Society American Physical Society American Public Health Association American Quaternary Association American Society for Microbiology American Society of Agronomy American Society of Civil Engineers American Society of Plant Biologists American Statistical Association Association of Ecosystem Research Centers Australian Academy of Science Australian Bureau of Meteorology Australian Coral Reef Society Australian Institute of Marine Science Australian Institute of Physics Australian Marine Sciences Association Australian Medical Association Australian Meteorological and Oceanographic Society Bangladesh Academy of Sciences Botanical Society of America Brazilian Academy of Sciences British Antarctic Survey Bulgarian Academy of Sciences California Academy of SciencesCameroon Academy of Sciences Canadian Association of Physicists Canadian Foundation for Climate and Atmospheric Sciences Canadian Geophysical Union Canadian Meteorological and Oceanographic Society Canadian Society of Soil Science Canadian Society of Zoologists Caribbean Academy of Sciences views Center for International Forestry Research Chinese Academy of SciencesColombian Academy of Exact, Physical and Natural Sciences Commonwealth Scientific and Industrial Research Organization (CSIRO) (Australia) Consultative Group on International Agricultural Research Croatian Academy of Arts and Sciences Crop Science Society of America Cuban Academy of Sciences Delegation of the Finnish Academies of Science and Letters Ecological Society of America Ecological Society of Australia Environmental Protection Agency European Academy of Sciences and Arts European Federation of Geologists European Geosciences Union European Physical Society European Science Foundation Federation of American Scientists French Academy of Sciences Geological Society of America Geological Society of Australia Geological Society of London Georgian Academy of Sciences German Academy of Natural Scientists Leopoldina Ghana Academy of Arts and Sciences Indian National Science AcademyIndonesian Academy of Sciences Institute of Ecology and Environmental Management Institute of Marine Engineering, Science and Technology Institute of Professional Engineers New Zealand Institution of Mechanical Engineers, UK InterAcademy Council International Alliance of Research Universities International Arctic Science Committee International Association for Great Lakes Research International Council for Science International Council of Academies of Engineering and Technological Sciences International Research Institute for Climate and Society International Union for Quaternary Research International Union of Geodesy and Geophysics International Union of Pure and Applied Physics Islamic World Academy of Sciences Israel Academy of Sciences and Humanities Kenya National Academy of Sciences Korean Academy of Science and Technology Kosovo Academy of Sciences and Arts l’Académie des Sciences et Techniques du Sénégal Latin American Academy of Sciences Latvian Academy of Sciences Lithuanian Academy of SciencesMadagascar National Academy of Arts, Letters, and SciencesMauritius Academy of Science and Technology Montenegrin Academy of Sciences and Arts National Academy of Exact, Physical and Natural Sciences, Argentina National Academy of Sciences of Armenia National Academy of Sciences of the Kyrgyz Republic National Academy of Sciences, Sri Lanka National Academy of Sciences, United States of America National Aeronautics and Space Administration National Association of Geoscience Teachers National Association of State Foresters National Center for Atmospheric Research National Council of Engineers Australia National Institute of Water & Atmospheric Research, New Zealand National Oceanic and Atmospheric Administration National Research Council National Science Foundation Natural England Natural Environment Research Council, UK Natural Science Collections Alliance Network of African Science Academies New York Academy of Sciences Nicaraguan Academy of Sciences Nigerian Academy of Sciences Norwegian Academy of Sciences and Letters Oklahoma Climatological Survey Organization of Biological Field Stations Pakistan Academy of Sciences Palestine Academy for Science and Technology Pew Center on Global Climate Change Polish Academy of Sciences Romanian Academy Royal Academies for Science and the Arts of Belgium Royal Academy of Exact, Physical and Natural Sciences of Spain Royal Astronomical Society, UK Royal Danish Academy of Sciences and Letters Royal Irish Academy Royal Meteorological Society (UK) Royal Netherlands Academy of Arts and Sciences Royal Netherlands Institute for Sea Research Royal Scientific Society of Jordan Royal Society of Canada Royal Society of Chemistry, UK Royal Society of the United Kingdom Royal Swedish Academy of Sciences Russian Academy of Sciences Science and Technology, Australia Science Council of Japan Scientific Committee on Antarctic Research Scientific Committee on Solar-Terrestrial Physics Scripps Institution of Oceanography Serbian Academy of Sciences and Arts Slovak Academy of Sciences Slovenian Academy of Sciences and Arts Society for Ecological Restoration International Society for Industrial and Applied Mathematics Society of American Foresters Society of Biology (UK) Society of Systematic Biologists Soil Science Society of America Sudan Academy of SciencesSudanese National Academy of Science Tanzania Academy of Sciences The Wildlife Society (international) Turkish Academy of Sciences Uganda National Academy of Sciences Union of German Academies of Sciences and Humanities United Nations Intergovernmental Panel on Climate Change University Corporation for Atmospheric Research Woods Hole Oceanographic Institution World Association of Zoos and Aquariums World Federation of Public Health Associations World Forestry Congress World Health Organization World Meteorological OrganizationZambia Academy of Sciences Zimbabwe Academy of Sciences
http://opr.ca.gov/s_listoforganizations.php
Don’t clutter, please. Those organizations weren’t addressing the fact that Sci Am is publishing Mann’s pseudo scientific babble.
Those people all accept Mann’s works. While conservatives are in denial, higher life forms are well aware of warming.
Climate change boosts a migratory insect pest
http://www.sciencedaily.com/releases/2015/05/150513145636.htm
Global Warming Brings Earlier Spring Flowers
http://www.livescience.com/26328-global-warming-brings-earlier-spring-flowers.html
Climate change, increasing temperatures alter bird migration patterns
http://www.sciencedaily.com/releases/2012/02/120223142642.htm
UCSB Study Finds Marine Life Moving Poleward Faster Than Terrestrial Counterparts in Response to Climate Change
http://www.ia.ucsb.edu/pa/display.aspx?pkey=3079
Are potato leafhoppers smarter than climate deniers?
“I AM INFORMED!”
and hilarious 🙂
So let’s collapse this civilization. I’m in. You?
Collapse-a-licious
A podcast I frequently listen to.
Some very interesting guests.
Yes, and Alex Smith is a good, smooth host, maybe even impeccable.
Ron Patterson/This blog should present a kind of placeholder article whereby the comment section would then investigate, discuss, deliberate on, hash/flesh-out and then vote on the best of the best of informational resources– say, a top 10 or 20, maybe with some satellite and special categories and exceptions, etc.– on/of/for the blog’s general topics of peak oil, energy, and related issues.
The results could then fill the placeholder and become the article.
Hi Rob,
Which part of “global” do I need to explain? 🙂
dang it, after reading Rob’s informed comment, I realized I forgot to add my “sarc on” notification. I apologize to the group.
”
By Miriam KramerMay 01, 2015
A two-year NASA authorization bill that a House committee approved on Thursday would cut more than $300 million from the agency’s Earth science programs, and people are not happy about it. Everyone from NASA administrator Charles Bolden to President Obama’s science advisor are lining up to slam Republican-sponsored cuts contained in the bill, which was approved by the House Science, Space, and Technology Committee along party lines.
The committee’s stated rationale for the Republican-sponsored bill includes allowing NASA to focus more on exploring space, not studying Earth, even though the latter has been part of NASA’s mission statement since its establishment in 1958. Some members of Congress, notably Republican Senator and presidential candidate Ted Cruz of Texas, have recently criticized NASA for losing sight of its plan for the future. ”
http://mashable.com/2015/05/01/nasa-budget-cuts-earth-science/
Yes, the earth is warming, the science is solid and quite simple actually. Anyone who ever ran an infrared spectrograph and UV/VIS spectrometer would know for certain how it works.
What is not simple are the effects of the feedbacks, those are the really dangerous ones, unknown in their response rates and interactions. The other complication is the big negative factor from coal and dirty oil burning, that is shading the earth from a large global warming effect. Hansen recommended slowly cutting back on coal burning rather than quickly due to the short life of SOx and particulates in the atmosphere causing rapid changes. I doubt if coal burning would be reduced quickly anyway, so the northern temperate regions especially will enjoy diminished warming for a while.
Last year the El Niño climate phenomenon had a semi appearance in the Pacific. I believe the Japanese meteo agency declared it was taking place, NOAA said it was borderline. The anchovies fishing season was below normal, this qualified 2014 as an El Niño year. But it never developed the wind oscillation which reverses wind flow from the Eastern Pacific towards Peru.
This year conditions point towards a full El Niño, in full swing by the end of the year. So if we add the lingering heat from last year to this year’s energy release, 2015 should be very warm.
On the other hand, the sun is slightly weaker, and Antarctica has had record sea ice cover. Antarctica is so choked with ice the Australians may have to abandon their base (located in the area where the Australians aboard the Russian ship got stuck last Antarctic summer). These two should help keep the temperature from going up even higher. By 2016 we should be back down, and 2017 should be colder. The trend is towards a warmer surface, but the pace is much lower than projected by climate models at this point in time.
Thus I think the depletion of fossil fuels remains the item to focus on (I study both, but I think peak fossil isn’t given the attention it merits). The two items converge and point towards the desirability of energy efficiency and the pragmatic investment in renewables, of which the Congo River hydropower system seems to give the best economic yield.
For more info go to the Discussion and Comparison of recent conditions here:
http://www.esrl.noaa.gov/psd/enso/mei/index.html
In case anyone is confused by the expanding sea ice, data confirms these three factors:
Antarctica is warming
Antarctic sea ice extent is increasing
Antarctic land Ice mass is decreasing
Overall Antarctic is melting not growing
http://ossfoundation.us/projects/environment/global-warming/antarctic-ice-melt
The PIG is disintegrating before our eyes.
The Continent is losing mass big time.
GRACE has beed valuable in tracking this.
Interestingly not all of Antarctica is warming. I have access to the Hadley temperature grid and I’m seeing the peripheral stations outside the Antarctic Peninsula with steady or dropping temperature. the South Pole station is warming, up to something like minus 50 or a crazy number like that.
So the main impact seems to be in West Antarctica. Other than that sector, the continent seems to be isolating itself, and it may be entering a cooling period. That would really help extend sea ice and increase albedo. And that would be great news.
I don’t know why I bother–it really only serves to cause my blood pressure to rise, but in an effort to stamp out the massive amount of ignorance that seems to now pervade this blog:
Gravity data show that Antarctic ice sheet is melting increasingly faster
Researchers ‘weighed’ Antarctica’s ice sheet using gravitational satellite data and found that during the past decade, Antarctica’s massive ice sheet lost twice the amount of ice in its western portion compared with what it accumulated in the east. Their conclusion — the southern continent’s ice cap is melting ever faster.
http://www.sciencedaily.com/releases/2015/04/150430191140.htm
Antarctic ice shelves rapidly thinning
A new study has revealed that the thickness of Antarctica’s floating ice shelves has recently decreased by as much as 18 percent in certain areas over nearly two decades, providing new insights on how the Antarctic ice sheet is responding to climate change.
http://www.sciencedaily.com/releases/2015/03/150326151432.htm
Antarctic sea level rising faster than global rate
A new study of satellite data from the last 19 years reveals that fresh water from melting glaciers has caused the sea level around the coast of Antarctica to rise by 2cm more than the global average of 6cm. Researchers detected the rapid rise in sea-level by studying satellite scans of a region that spans more than a million square kilometers. The melting of the Antarctic ice sheet and the thinning of floating ice shelves has contributed an excess of around 350 gigatonnes of freshwater to the surrounding ocean.
http://www.sciencedaily.com/releases/2014/08/140831150207.htm
Given the addition of 350 gigatonnes of freshwater to the surrounding ocean, does it surprise anyone that sea ice is expanding around Antarctica?
Best,
Tom
This is all very tough to get right, but I think I’ve finally got it correct after listening to the noted climate change experts for the last few years. The lack of expected ice that didn’t form in Antarctica was due to the global warming, which, of course, for some unexplainable reason causes terrible freezing in some parts of the world, like the northeast US just this last winter, or the winter before that as well. So in other words all those billion dollar climate models weren’t really wrong when the global warming failed to live up to predictions. No, turns out we were the wrong ones, because the models successfully described how the warming of the planet would lead to the cooling of the planet because of the warming of the planet. Got it? Obviously we are in very perilous peril. Our beloved climate models tell us that either the global warming is gonna bring us all to our creator, or the the ice and snow will. Still following me here? Good, because this is exactly the type of reasoning that’s going to be used when the political elites come knocking to collect a carbon footprint tax from all of us.
Please share some of what you’re smoking
When ice melt, it prodeuces ice water. That is cold, just above the melt point of ice. This water pours down the hills and into the water. There it floats on the surface, since it has lower density because of no salt in it.
Now, cold water freezes faster than warm water. So when winter come, the Antarctic sea ice get bigger than before. It really is that simple.
But the denialists only read “increasing Antarctic ice” and figures it must be land ice.
I suggest you look up the data before you make such statements. The ocean around Antarctica is salty. There’s no “fresh water layer”. Antarctic sea water has slightly less salt than the world’s average because there’s less evaporation, because the formation of sea ice acts as a fractionation process which drives cold salty water in a deep water current, away from the continent. Fresh water from melting land ice is a minor contributor, basically because most of the melting takes place in West Antarctica, and that water eventually has to flow through the Drake Passage.
Antarctica’s climate is very complex, and fascinating. And it’s possible it may help slow down warming, which is a big plus. This is an El Niño year, if by miracle the Antarctic sea ice surface keeps increasing we may have a really nice negative feedback starting to kick in.
http://www.theguardian.com/environment/2014/oct/09/why-is-antarctic-sea-ice-at-record-levels-despite-global-warming
Please read what I write, before you make such statements.
There is no fresh water layer around Antarctica. Correct. But the ice on shore is salt free. When the land ice melts, it pours downhill and out onto the oceanic water. Since the ice-water is salt free, it will float on top (lesser density). it is colder, so the freezing will get a head start.
After that ice melt away in spring,it get mixed up with the salty water and “disapear”.
The point is not the salinity of the water, but that the antarctic ocean surface get an injection of coldness from the melting land ices.
Or do you have another theory about where the ice cold melt water goes?
Tom, if it causes your blood pressure to rise then you really need to take yoga lessons. I study climatology and the “peak oil” topic because they happen to be linked. Both tell us we need to emphasize efficiency and work to make non fossil fuel energy more affordable.
Both subjects require a detailed look, and avoiding dogma and preconceived ideas. I think most of us know agencies such as the EIA deliver a subpar product biased by a political agenda. The same applies to the global warming issue. “Antarctica melts” isn’t good enough. The key is to understand it’s a continent, and it has variety. We shouldnt lump Florida with Minnesota when we discuss the climate. Some of the climate propaganda emphasizes the West Antarctic Peninsula, which extends very far to the North. As it turns out the trend in that peninsula isn’t the same as the trend in East Antarctica. As an engineer who happens to be trained in oceanography I can readily see that a larger sea ice extent around Antarctica has a very positive impact. It increases ice albedo. Increased albedo is extremely useful because it helps the planet reflect incoming visible light as visible light, rather than being absorbed and converted to short wave, which does get absorbed by greenhouse gases. In other words, the growing sea ice is a negative feedback, and it’s really useful.
Here´s a couple of temperature plots from Antarctica so you can see the temperature trend I´ve mentioned. These grid cells were picked on opposite sides of the continent, are located on the coast. The thing I want you to understand is that climate issues are incredibly fine grained, generalizing doesn´t help gain a proper understanding. The same applies to peak oil issues, there are tons of experts out there who seem to miss their calls because they look at the information from 10,000 meters and can´t see the way the smaller gears turn.
Hi Fernando,
The problem with only a fine grained analysis is that there are potentially an infinite number of points one could look at and it is subject to cherry picking the two data points that confirm the story you would like to tell.
It also results in silly complaints that a general circulation model doesn’t reproduce reality in every location with 100% accuracy.
Dennis, it doesn’t need to be that fine grained. Let me ask you, did you know the Hadley Center data can be seen using Google Earth? If you download the grid you can click on any cell, and it plots the temperature anomaly.
I must have read over 50 papers about Antarctica’s climate, but what really helps to put it all together is to learn Antarctic geography and tour the data.
Down load the data, circle around Antarctica and you will see the warming trend is heterogeneous.
It’s the same with oil production. Or do you think North Dakota is the same as Alberta even though they are really close?
Hi Fernando,
I think the averages are more interesting than the fluctuations, when you get too fine grained you end up with noise rather than signal. The average temperature for Antarctica and the average loss of ice mass and the total sea ice area averaged over the year for the planet, those are the interesting questions from my perspective.
To each his own, I guess. If I average the Alberta heavy oil and the Bakken I get a really nice oil, don’t i?
Hi Fernando,
I separate things where it makes sense, if dividing Antarctica up in the way you have chosen makes sense that is fine, I don’t follow it closely. If one is going to argue that albedo is important (and I agree that it is), wouldn’t looking at changes in global sea ice make more sense averaged over the annual cycle?
You have noticed that I do analyze different areas differently, such as the Bakken, Eagle Ford, a separate model for extra heavy oil from conventional?
You also see my point that most people don’t bother to pull up specific weather stations and one could look around at the thousands of different points in the Hadley database and find the two that tell the story that they would like to tell?
If not, oh well. For climate change global averages are more interesting data points especially the 25 year trend, at least to me.
Hi Dennis,
A 25 year trend?
How about a 35 year trend of ZERO.
http://www.drroyspencer.com/wp-content/uploads/UAH_LT_1979_thru_April_2015_v61.png
Dennis, the ICE INDUCED albedo is increasing. This is simply because the Antarctic sea ice is located AROUND the continent, and this puts it further to the North, where the incidence angle is greater, and it´s all open ocean (ocean has a very low albedo).
The Arctic ice, on the other hand, is mainly located in an ocean basin right at the pole. As it turns out, the main ice surface being lost is in the Barents, the Kara, and the Sea of Okhost. When we look at the impact, the Antarctic ice gain is more positive than the Arctic loss, with regards to total surface as well as total albedo and ability to reflect sunlight. IF this trend continues this will be a very positive development.
Regarding Antarctica, I happen to study it because I find a lot of misinformation. So I got me the Hadley data, and I also have access to the data from something like 50 Argo buoys floating around Antarctica. This means I can see the temperature profiles. I´ve familiarized myself with what goes on enough to tell that we get a lot of bs . Antarctica IS losing ice mass, but that´s mostly in a small sector in Western Antarctica.
I don´t know how many times I have to repeat it: Global warming is a problem, but it´s not as serious as many of you think. Even if we constrain ourselves to climate orthodoxy as preached by the IPCC, the fossil fuel resources aren´t enough to justify their extreme projections. This means a lot of the hysteria and fear mongering are empty words.
“The Larsen B ice shelf existed for 12,000 years before it fell apart in 2002, separate studies showed. The ice shelf is on the Antarctica Peninsula, the strip of land that juts northward toward South America. Larsen B is about half the size of Rhode Island, some 625 square miles (1,600 square kilometers).
Because the ice shelf is already in the ocean, its breakup won’t further boost sea level rise. But Khazendar and his co-authors also discovered that the glaciers feeding into Larsen B’s remaining ice shelf have dramatically thinned since 2002.
“What matters is how much more ice the glaciers will dump into the ocean once this ice shelf is removed,” Khazendar said. “Some of these glaciers are most likely already contributing to sea level rise because they are in the process of accelerating and thinning.”
The Leppard and Flask glaciers thinned by 65 to 72 feet (20 to 22 meters) between 2002 and 2011, the new study reported. The fastest-moving part of Flask Glacier sped up by 36 percent, to a speed of 2,300 feet (700 m) a year.
The glaciers that were behind the vanished section of the Larsen B ice shelf sped up by as much as 8 times their former rate after the ice crumbled over a six-week period in 2002, earlier studies showed.
The northwestern part of the Larsen B ice shelf is also becoming more fragmented, the researchers said. But the southeastern part is cracking up. A huge rift has appeared just 7.5 miles (12 km) from the grounding line, where the ice loses contact with the ground and starts floating on the ocean, the study reported. This crack marks where the ice shelf may start to break apart, the researchers said.
The Antarctica Peninsula is one of the world’s fastest-warming places, with an average rise in air temperature of 5 degrees Fahrenheit (2.8 degrees Celsius) in the past 50 years, according to the British Antarctic Survey. This March, the northern tip of the peninsula set an unofficial heat record of slightly above 63 F (17 C).
Researchers think the surface warming is melting the ice shelves, triggering a cascade of events that eventually leads them to catastrophically collapse. But recent research also points to melting from below, from warmer ocean water.”
http://www.livescience.com/50850-antarctica-larsen-ice-shelf-collapsing.html
Here´s the Hadley Center grid temperature over the Larsen shelf. You reach your own conclusions. Note the latitude is South 67.5. The buoys show the water temperature ranges from close to minus 2 degrees Centigrade to as high as 2.5 degrees Centigrade about 200 meters below the surface as the Circumpolar current passes to the north, heading East, around the West Antarctic Peninsula. The “melting spot” (meaning the area that´s losing a lot of ice) is mostly limited to West Antarctica, a little bit south of the peninsula, onshore from the Admunsen Sea.
A Rare Mid-Year El Niño Event Is Strengthening
The robust El Niño event anticipated for more than a year is finally coming to fruition, according to the latest observations and forecasts. NOAA’s latest monthly analysis, issued on Thursday morning, continues the El Niño Advisory already in effect and calls for a 90% chance of El Niño conditions persisting through the summer, with a greater-than-80% chance they will continue through the end of 2015. These are the highest probabilities yet for the current event, and a sign of increased forecaster confidence–despite the fact that we’re in northern spring, the very time when El Niño outlooks are most uncertain.
http://www.wunderground.com/blog/JeffMasters/comment.html?entrynum=2989
I wonder if that means that summer rain is possible here in California?
got a little bit in So Cal today
Yes. I have an app with a display showing worldwide weather, and I’ve noticed periodic rainfall over Southern California over the last few days.
The data shows we are having a “multiple year” event, which is rare but isn’t unique. I mention this because Trentberth issued a statement saying the current two year event was unique (which it isn’t). The detailed buoy temperature data shows large volumes of warm water moving East from the Pacific waters near Papua New Guinea towards the Peruvian coast. This water releases heat to the atmosphere, and the phenomenon reverses wind flow.
The unusual aspect I’ve noticed is that we’ve seen some reversed wind flow bursts (reversed means blowing due East towards South America), but not the steady winds needed for a full bore southern oscillation. Also, the pacific waters off Papua are now colder than average. This means the heat engine needed to drive a strong event (like in 1998) isn’t fully supported with excess heat. Thus this event has a broad base with a flat top. It releases a lot of energy, but it doesn’t do it in a sharp peak like in 1998 or 2010. This will be known as the 2014-2015 El Niño.
I am maintaining a top ten list of all times. On this list you can see what years are on the top ten warm year globally. For every year. I notice that since 1986 ever year except the two following the Mount Pinatubo volcanic eruption made it to the top ten list. We live in an era of constant record setting.
Link here: http://utsikten.blog.se/files/2015/02/weatherbars.png
Warning: BIG graphic.
Local effects of warming which we are experiencing, now. El Nino will exacerbate everything.
I ordered a Honda water pump last week in order to water some remote gardens from a pond this summer. It is too far to take our water from the house well, or river. Usually, I put my dock in the river around June, and still encounter 1 or 2 freshets and snow-melt events that cause me to take emergency actions to ‘save the dock’. This means a 1″ line around a big cedar tree and the anchors still get moved.
Here, on the coast of BC we have dick all snow on the mountains. It looks like August. Another thing is the winds. Usually, we get a southeaster followed by a strong westerly. It can be 40kts each direction this time of year, stronger in the shoulder months. June is usually wet. We then get strong westerlies in July. I don’t keep records but the salmon migrations start to show up around the middle of July, just when the big westerlies hit and I can’t fish. Sometimes, I can’t get my boat out for two weeks….35 kts every day. (I have a 16′ skiff and the water is beyond rough where I live….big big fetch and tides.) This year the winds have already been blowing for over a week. It is July wetaher right now!! The river is at July flows in May. I just checked the marine forecast and it is 30+kts for most of the next week. We never get this in May and June, or almost never….I guess.
Below, I have included a brief synopsis of what our winters are like with El Nino. Last year the local ski hill did not open. The year before it had the most snow of any ski resort in the world!!! They had to dig down to two story buildings.
The plus side is the sockeye migrations for the Fraser will pretty much go past my house….through a strait about a mile wide. They tend to stay out of US waters during El Nino years.
“During the winter of an El Niño event, the air temperature tends to be warm over most of Canada, with the greatest warming centred around Manitoba-western Ontario, where a temperature anomaly of up to +3 degrees Celcius (averaged over the last nine El Niño events) can be found (Hoerling et al., 1997; Shabbar and Khandekar, 1996). Southern Canada also tends to be drier during an El Niño winter (Shabbar et al., 1997). Southern British Columbia tends to receive less snow (Hsieh and Tang, 1999). “
I looked at the change in the number of wells per month in the Bakken versus the monthly production change for the period of July 2014 to March 2015. The correlation is not perfect but the change in monthly production roughly corresponds to the change in the number of producing wells per month. The response to change is fairly rapid.
Hawaii may set itself the goal of generating all of its electrical power by renewable electrical generation methods by 2045:
http://www.iflscience.com/environment/hawaii-wants-get-100-its-electricity-renewable-sources-2045
From the article, another tidbit:
“…it’s great to see that more and more governments are taking green energy and the environment seriously. Take Costa Rica, for example: Back in March, they announced that they had used only renewables to produce electricity for 75 days straight, which is certainly a remarkable achievement.”
Maybe they can get around the islands using Leafs, teslas, etc.
I wish them success.
I took these numbers from the 10Q of Whiting Petroleum and Continental Resources for Q1 2015.
Whiting Petroleum
Net cash from operating activities: $202,139,000
Net cash used in investing activities: $1,021,610,000
Net cash provided by financing activities: $847,286,000
Average net BOEPD: 166,930 80% oil
Continental Resources:
Net cash from operating activities: $522,190,000
Net cash used in investing activities:$1,278,404,000
Net cash provided by financing activities: $784,383,000
Average net BOEPD: 206,829 70% oil
So, as I indicated above, these two companies were cash flow negative in the amount of over $1,550,000,000 in the 90 day period contained in Q1 2015. I was light on what they produced, they almost produced 374,000 BOE per day from all plays.
I think these two companies are good proxies for the shale oil industry as a whole. I estimate they produced about 7% of “working interest LTO” in the United States in Q1 2015. So if we extrapolate this cash situation to the entire industry, I come up with the shale oil industry being cash flow negative in the approximate sum of $22 billion dollars in the 90 days from 1/1/15 to 3/31/15.
I’d really like to hear from those studying this closely as to whether I am looking at this correctly. I think it is a staggering figure. Maybe I have made an error? I am assuming LTO production after royalties of 4.1 million BOPD in Q1 2015 in the US.
Shale oil companies are “new economy” companies like many internet and technology companies.
They don’t really have any intention of ever earning money from operations, but that’s not really pertinent anyway since they aren’t valued based on their cash flow. They’re valued based on their past success of high growth and high yield and their future prospects of the same. In the case of internet and technology companies, they’re rewarded only so long as they can show quarterly growth in active users, subscribers, consumers, or what have you. Shale companies, on the other hand, are rewarded so long as they can show quarterly growth in proved reserves and production.
There’s a lot of merit in that comment. The analogy starts to weaken when it’s clear that industries that don’t feed people can indulge in pretense easier than those on whom life depends.
It’s kind of like when William of Ockham collided with the scholastics, no?
And now, 800 years later, the debate between the rationalists and empiricists rages on.
As the philosopher of science Stephen Toulmin put it in Cosmopolis:
We see signs of this philosophical conflict all around us, for instance with folks like Gail Tverberg in the rationalist camp, and folks like Mike and shallow sand in the empiricist camp.
Closely related to the mind-body split. And to the left-brain, right-brain split.
I don’t really see a conflict between symbolic models and empirical information, as long as they communicate and inform each other, as in the classical scientific method.
“Rationalist” is a funny term – my intuitive use of the word “rational” is related to mental health. I suppose that kind’ve fits: someone who’s too detached from reality is in trouble.
“I suppose that kind’ve fits: someone who’s too detached from reality is in trouble.” ~ Nick G
Like an entire culture, helped along, say, by those purveyors of EV perv who don’t actually own one, live in walkable neighborhoods, take the train, and own an internal combustion engine vehicle?
Apparently, the governpimps need car culture. No car culture; no drives to wage-slave jobs (that often don’t add anything to quality-of-life) to pickpocket the slave-wages (taxes/capitalist profit) that feed the pimps and their cronies (like ’employers’).
With that, less/no taxes; less cramming personal-empowerment-stripped people into city rabbit-hutches/chicken-coops and into dehumanizing/out-of-human-scale city environs; more relocalization where the food and land is; less transport infrastructure costs; more ecovillage spring-ups; more home-grown/produced food/basic necessities; greater self-/community-empowerment; less dependencies on external arrangements/imports/transport infrastructure/faceless corporations, etc….
And maybe, just maybe, bye-bye large-scale governpimps.
Sounds like a smooth transition to me.
To the true reality of Mother Earth, that include us, and her needs that include our real ones.
Cars, coercive, undemocratic governments or capitalist-mode-profit-industrialization are not birthrights; healthy environments and communities are.
Let’s get our priorities straight.
We see signs of this philosophical conflict all around us, for instance with folks like Gail Tverberg in the rationalist camp, and folks like Mike and shallow sand in the empiricist camp.
Me, I see monstrous traffic jams on the major thoroughfares all over the planet. I also see ecosystems that were formerly stable for thousands of years suddenly disintegrating everywhere I look…
We live in most interesting times, it’s not exactly the show I wanted to see but I do have front row seats.
People come in two categories.
Those who categorize people into two groups and those who don’t.
Yes, and I can speak for Caelan MacIntyre when I say that he agrees. ^u^
Uh, thanks, Puffalar, but I can speak for myself.
Watcher says:
This is an articulation of an extreme form of rationalism, known as Platonic realism or Platonic idealism.
The problem is that most of nature exists in a contiuum, and not in distinct categories. However, it is not possible for humans to think in terms of these infinite divisions, nor is social organization possible without the formation of human groups. So people place things and events into abstract categories.
Splitting contiuum into categories, nevertheless, is a distortion of reality. And furthermore, those with the power to do so normally create categories which serve their own interests and/or passions. This is where Ockham and the nominalist revolution enter the picture. Nominalism was subversive.
But Pope John XXII showed ’em. He wasn’t going to let anyone question his ontology, and so he excommunicated Ockham.
Shallow and FWIIW
I looked at some other companies in Bakken(ND) and available data suggests some of these to be cash flow neutral for Q1 2015.
Using date of first production as criteria for when a well was completed and started to flow, Continental with 79 and Whiting with 84 had the biggest portion of wells started in Q1 2015.
This out of a total of 495 wells for Q1 15.
So extrapolating from those 2 companies will likely overestimate the total cash burn.
Rune, thanks. I wondered if maybe Continental and Whiting had been more aggressive than others in the face of falling oil and natural gas prices.
What companies did you look at? I will try to look at some more this evening.
Shallow,
I looked at EOG and Statoil and primary indicator; new wells that started to produce in Q1.
Rune. As you likely know, the public companies do not split out their statements of cash flow by field. I was unable to find Statoil’s quarterly report, although I am sure it is out there somewhere. I think it being a foreign company with ADR’s in US might have something to do with it.
In any event, I looked at several non-integrated oil and gas company 10Q Q1 2015 to see how the did cash flow wise. All I found were cash flow negative big time.
These are from my notes, I invite all to double check me. Remember, these figures are not for Bakken only or US shale only, but from all of each company’s operations. I did have to adjust Anadarko with regard to the Tronix/Kerr-McGee settlement. I removed the effects of it from Anadarko’s numbers.
ConocoPhillips -$2,398,000,000
EOG-$863,013,000
Hess-$790,000,000
Marathon Oil-$1,133,000,000
Apache-$1,468,000,000
Anadarko-$1,219,000,000
Oasis Petroleum-$162,321,000
I suspicion pretty much any public E &P company was cash flow negative in Q1. It takes a few months to turn down or off the massive drilling campaign that went on in 2014.
Keep in mind all of the above are among the largest E & P with the exception of Oasis, which produces around 40 thousand BOEPD in the Bakken.
Proof that oil cannot stay at these levels for too many years without a drop in production? Even the best of the best got hammered in the first quarter of 2015.
Shallow,
My bad I should have been more specific.
As you point out companies do not split out financial results by field.
Which leaves the option to make an estimate by field based upon available data (the oil price is a known, various cost components, taxes and royalties).
This can then be compared to the companies’ financial reports.
For Bakken an estimate for each company is possible to be made from the number of wells started to produce any month, quarter (adjusted for WI, net wells) and likewise an estimate for the companies’ equity production.
This should result in an estimate that should be close and fit for the purpose on identifying trends and their magnitude. This is one way to break out estimates for various fields for a company.
It will never be 100% (if it is, it is luck!), but if it is close to 90% they provide some helpful insights.
(For Statoil in Bakken I have a model that is harmonized to their reporting of their Bakken equity production. Same can be done for any company. It will not be perfect, but should get reasonable close to see the important trends).
Based on Enno’s data sheets;
in Q1 15 EOG had production from 15 new wells
in Q1 15 Statoil had production from 11 new wells, 55 kb/d equity production (from Statoil) in Bakken
Rune, will be interesting to see what happens to EOG and Statoil production in Bakken the remainder of 2015, given the few completions. Marathon Oil also appears to have stopped bringing on new wells in the Bakken. They would be a good one to follow too, IMO.
Very interesting the differing strategy among the various companies, all of which are pretty big and assume have people employed full time trying to figure out what to do. Will be interesting to follow.
Thank you and everyone else for your analysis.
Hi Shallowsands,
I think it is clear that output will drop in the LTO plays, and if the estimated ultimate recovery (EUR) of new wells has not increased in 2013 and 2014 as I had been assuming, but instead the shape of the well profile changed to steeper during the first 12 months and then bending more sharply to slower decline in the later months (with overall EUR unchanged), the story changes.
If this “constant EUR” hypothesis is correct, then Ron’s estimate that at least 150 wells are needed to keep output flat for the next 6 months is correct. Longer term I get about 148 wells and 160 wells for the first month with a gradual decrease in the number of wells to 148 over 12 months or so for flat output.
My original thinking was that new well EUR had increased proportionally to the recent increases in the first 12 months of cumulative output relative to the 2008 to 2012 average new well.
Chart below with 120 wells from June 2015 to Feb 2025, oil prices as shown on right axis, ERR=economically recoverable resources.
I have raised OPEX and other costs to $12/b (previously I used $8/b) and transport costs were raised to $14/b (from $12/b before), OPEX is assumed to rise at a real rate of 3% per year, real well cost starts at $8.1 million and it is assumed to increase at a real rate of 3% per year starting in Jan 2016. The real discount rate is 7% (10% nominal assuming 3% inflation), royalties and taxes are 26.5% of wellhead revenue.
Dennis, who in the world said EUR’s were “constant?” Yikes. I’d like to remind everyone what the E in EUR stands for.
I am glad you have increased expenses, you are getting closer.
As I have said to you before, in spite of the misconception, not all shale wells are born equal, nor do they live the same, normal predictable lives. If you are using a mean weighted average for production over some time period for Bakken wells based on 4000 wells per year, that average is going be less for 1800 wells per year. Shallow and Jeff might have just shown us an example of how much steeper decline rates can actually be.
Mike
Hi Mike,
Thanks for the tip on costs. How much higher should I go on costs, I am trying to get as close as possible, would $15/b for OPEX plus G+A plus interest be too much? It is really not difficult to change these assumptions, Shallow sands keeps pushing me in the right direction, but at some point the estimate becomes unrealistically conservative.
I have used Rune Likvern’s original assumptions in his Red Queen model as my starting point, now I have increased OPEX and other costs by $4/b and transport costs by $2/b, added upfront money to well cost for P+A and have OPEX increasing by 3% per year and well costs also by 3% per year (both are 6% in nominal terms assuming 3% inflation rate).
Over the 2008 to 2012 period the average Bakken well’s EUR did not change by much from year to year. I am aware the the EUR is not constant, but it seemed to be on a plateau from 2008 to 2012.
The 30 month cumulative output was:
2008—139 kb
2009—127 kb
2010—141 kb
2011—139 kb
2012—133 kb
avg08-12—136 kb
Note that this average uses all wells from 2008 to 2012 and thus accounts for the change in number of wells added per year.
The “average well” is what is used in my Bakken model as an approximation as entering the data for 9000 wells would be rather time consuming.
Now in 2013 and 2014 we have less data, but based on the first 12 months of data for 2013 and 2014, it seemed that the new well EUR was increasing. I modified my model to account for this change by increasing the 2013 and 2014 well profiles by 10% for 2013 and 15% for 2014 based on changes in the first 12 months of cumulative output.
This was a mistake, I am now making the conservative estimate that the 2013 and 2014 new well EUR is roughly the same as the 2008 to 2012 average well. The shape of the well profile is higher and steeper over the first year and becomes flatter after 24 months, cumulative output is similar to pre-2012 wells at abandonment.
As the sweet spots get saturated with wells, the EUR will decrease as less productive areas are drilled more fully, I am guessing this will begin in 2015/2016 in the Bakken and Eagle Ford.
How quickly the EUR will decrease over time will depend on many factors, but I focus on the rate that new wells are added and assume if the rate of well completion is higher the rate of decrease in new well EUR will be higher.
For example if 1000 wells per year caused EUR to decrease at 4% per year, I would expect 2000 wells per year (new wells completed) to result in an 8%/year EUR decrease.
Hi Mike,
Yes there are big differences from well to well but the average well profile is what goes into the model, so if 100 wells are added in month 1, I assume all 100 wells are average wells, if 130 wells in month 2, all those wells are average wells also, then they are all just added up in a spreadsheet. The number of wells for past months is based on NDIC data, the well profile is based on past well output from NDIC data, then since the model works relatively closely for past Bakken output (also from the NDIC), I guess at the future number of wells added and assume the new well EUR will either not change, or it will decrease in some way in the future to make projections. Model for Jan 2011 to Jan 2017 with 120 wells per month added after June 2015 and an EUR decrease starting in June 2015 and reaching maximum annual rate of decrease of 7% per year in June 2016 (EUR falls from 330 kb in 2016 to 307 kb in 2017).
Ok so 150-160 wells per month was needed after all. Good with some knowledge sharing :).
Hi Freddy,
I was wrong, Ron was right. I had assumed the new well EUR had increased 16% since 2012, if EUR is about the same as the 2008-2012 average, then 150 wells is correct long term and 160 wells next month.
ZH is quoting Lynn Helms saying the completions in March were from Exxon, Conoco, Continental and Hess.
Shallow and more FWIIW
Using Enno’s data based upon detailed per well information (NDIC) there were 495 wells that started to produce during Q1 15.
Using NDIC total number of wells for Bakken/TF there were 470 net producing wells added during Q1 15 (this number has in the past been revised upwards with 2-5 wells).
Then there are dry holes, disposal wells etc.
A middle number would be 485 wells during Q1 15 at $8.5M would total about $4.1B for well manufacturing.
As of now a few things stand out;
1. The estimated negative cash flow of $2B for Q1 15.
2. The high number of producing wells added (485) in Q1 15 did not do much for total extraction. This is likely too early to conclude on, so we will have to await production figures for the next few months.
3. Most of the wells (like 80-90%) do not make commercial sense at present oil prices.
The game now is not about profitability.
Some companies are betting on a future higher oil price.
It is interesting that monthly production in the Bakken since last fall is essentially flat.
The ones hoping for higher oil prices need the higher oil prices in 2015 and 2016. Staying at this level until 2017 will doom the wells completed in 2014 and 2015, and also harm the early-mid 2016 wells in terms of profitability.
Oil price has become very stable since 5/1. Natural gas continues to be flat. Note that XTO and COP continue in the Bakken while MRO and EOG have virtually stopped. Very interesting the difference in strategy. Considering XOM has been bearish on future oil prices, what would explanation be for XTO having the most activity in Bakken?
Considering XOM has been bearish on future oil prices, what would explanation be for XTO having the most activity in Bakken?
Permission to resume activity in the Kara Sea before Rosneft calls PetroChina.
That would be cool.
Ron pointed out something about decline rates further up.
FWIIW, I had a closer look at Mountrail and all the wells started during 2014 had a high in December 2014 (no surprise there!) of about 119 kb/d.
By March 2015 these wells (those started in 2014) had collectively declined to about 84 kb/d.
That is a collective decline of 30% in 3 months!
Other vintages appear to exhibit steeper declines than expected.
Again we will have to wait and see and it may be due to temporarily shut in wells.
That’s diffusional decline for you!
I would like to see time series for the developments in watercut and Gas Oil Ratio.
Hi Paul,
The declines have become steeper of late over the first 12 months.
Notice how the 2012 average well falls below the 2008 to 2012 average well in the first 12 months, the average 2014 well has fallen below this 2008 to 2012 average well by 13 months, based on this chart an estimate of relatively fixed new well EUR for 2008 to 2014 may be correct.
Chart below with North Dakota Bakken Three/Forks average well profiles.
I know the following is merely anecdotal, but I wanted to give a shout out to Mike re Eagle Ford Shale.
Earlier in the week I read about Noble buying Rosetta Resources. I went on Texas RRC PDQ to take a quick glance at their production. Among others, I saw these two units in De Witt County. Obviously, the number of wells on each is significant, but the decline is still something to behold:
Rosetta Resources Operating LP, field name Eagleville (Eagle Ford 2)
Klotzman
1st production 11/11
Highest month 7/12 193,945 oil 280,331 gas
January 15 production 9,365 oil 16,635 gas
Klotzman Unit A
First production 12/12
Highest month 1/13 186,080 oil 133,742 gas
January, 2015 8,836 oil 11,285 gas.
Again, wonder how many wells on each lease.
About a 95% decline in 2.5 years for the Klotzman Lease (relative to monthly peak) and a 95% decline in 2 years for the Klotzman Unit A. In terms of exponential decline rates, these decline rates are in excess of 100%/year (about 120%/year and 150% per year* respectively).
I’m beginning to think that my estimate for an overall simple percentage decline rate from existing US C+C production of about 20%/year may be on the conservative side. In any case, in round numbers, at a 20%/year decline rate from existing production, we need about 2 MMBPD of new C+C production every single year–or the productive equivalent of a new Saudi Arabia every five years–just to maintain current production.
*At a 150%/year annual exponential decline rate, monthly production would fall by about 78% in one year (which would be the difference between exponential and simple percentage decline rates).
The Klotzman Unit has at least 7 wells and the Unit A 8; this meets current spacing standards in that field designation. These wells appear to be rather short lateral TMD and I didn’t bother looking at completion reports for all the frac stage BS. DeWitt is the Park Avenue for the EF from the standpoint of all the goodies that make shale fun and profitable; there are lots of 500,000 BOE wells in DeWitt, not so much elsewhere. DeWitt is way above average for well performance. Please remember that at 100 dollar oil prices it was taking 8 million dollar shale wells 160K BOE to pay out; y’all can be the judge of how many of the Klotzman wells are good wells. Yes, Shallow, a fella needs to be holding on to something when the decline of all these EF wells whooshes by you or you will get sucked away.
Re-frac’ing, by the way, in the EF has been a complete economic bust. There have already been numerous pilot attempts at secondary recovery using water and gas re-injection, none of which have caused any major press releases and have been abandoned. I think there is some serious rethinking of this down spacing hoopla because of very poor economics. Some of the whoopie stuff being said up hole about EOR, in the EF anyway, is way out in left field. Its good morning entertainment, though, way better than Morning Joe.
Keep up the good work, Shallow. Its all about money now.
Mike
Mike. Actually, these wells I referred to are probably some of the better EFS wells. They may have done ok financially given oil prices were high when they had their big months.
Just an illustration of how streep decline can be in EFS. Makes you wonder why they are still completing wells there now. Isn’t that a waste of shareholder $?
The companies I analyzed above all had positive cash flow from operations. Why wouldn’t they shut down the drilling and use some of that cash flow to pay off existing debt. And then when prices rise, start back up again?
The answer, of course, is that can only happen in the world of Internet oil. It takes us about 6 months lead time to drill a 1000′ well. Shale took off due to high stable price. It’s going to have a rough go with an unstable price, as Mike stated.
OTOH, KSA and the like don’t care so much if the price is $50 one quarter $100 a few quarters later, back to $75 or whatever. As long as 5 year average meets their needs, they will be fine.
Shallow, as I said, DeWitt County wells are generally pretty good; I would guess 42 of the top 50 highest CUMPROD wells in the EF trend are in DeWitt. Perhaps the decline on the Klotzman Units are steeper because of “down spacing?”
De-risked is a shale term, apparently not de-leveraged. I concur with you 100% that this would be THE time to be de-leveraging and strengthening my ability to borrow more money so when costs are at their lowest and prices are on their way back up I could make another run at it. Rune implies there is not a lot to de-leverage with, overall.
I think the financing of shale wells is so convoluted we will never understand how it is done completely. Or was done, because I don’t think there will be much more of it, except for some very big boys. Low price volatility will be the end of the shale boom. The party is over.
Mike
Hi Mike,
The cumulative output of the 8 wells in the Klotzman unit was about 200 bo per well over a 39 month period (though 6 of the 8 wells were completed 32 months before the latest data point in the PDQ (Feb 2015)). I didn’t find the gas output, but typically the Eagle Ford wells are 80% oil and 20% condensate, so as you said these wells look pretty good based on the 160 kboe to pay out. Though you may want to see payout earlier than 36 months (maybe 24?). I just double checked and using 6000 MCF=1boe, I get about 280 kboe/well for the 8 wells on the Klotzman lease.
I think the liquids ratio is actually more like 70-75 % (I assume you meant gas and not condensate) and 36 months to P/O works for me; it must be painful for those shale guys, however.
You’ve touched another raw nerve for me, gas to oil equivalents. In any economic analysis calculating that on a BTU basis is a neat little apples to oranges trick the shale oil industry likes to use. If we are evaluating the economics of the well the current ratio, apples to apples is about 24 MCF to 1 BO, IMO. Some of the Klotzman wells may have paid out but they are now dropping like a rock.
EUR’s do change, mostly downward. They have changed since October 2014, downward. Those long imaginary tails got a lot shorter.
Mr. Stehle’s comment down hole regarding Pioneer’s amazing 1.3 M BOE EUR’s in DeWitt County (same pasture as the Klotzman Units) can be answered in two words: false advertising.
People still believe that stuff, I guess. Wow.
http://www.ogj.com/articles/2014/05/eia-estimates-average-eagle-ford-eur-at-168-000-bbl-well.html
and a good engineer I have a lot of respect for here:
http://gswindell.com/sp158207.pdf. This paper is a little old, but still relevant, I think.
Mike
Hi Mike,
Thanks again.
Actually in the eagle Ford I focus more on oil rather than condensate and so I find the overall Eagle Ford ratio of crude to condensate which is about 80/20. I ignore natural gas altogether in my Eagle Ford analysis and look at the oil produced by Eagle Ford wells and model that and thin bump up the total to find C+C output by assuming that the crude to condensate ratio remains at its most recent level into the future. For the economics I should discount the condensate by some percentage (maybe 20%?), but have not done so yet, so my scenarios for the Eagle Ford are probably too optimistic.
In all of the economics of the wells I convert the natural gas (if it is not ignored completely) to the cash per MCF and just use any natural gas sales in the Bakken to offset OPEX. In the Eagle Ford I don’t look at natural gas at all, it is ignored completely and I focus on oil. Maybe the associated gas offsets the condensate issue (where I treat condensate like oil when it probably sells for less).
I use about 250 kb for the Eagle Ford EUR, and only oil is used in the economic analysis.
Hi Shallow sands,
You can find the number of wells on the lease by using the mapping tool with the leases id#. This does not gove you the starting dates of the wells, but shows how many wells have been drilled on the lease. I think completion reports can give you the starting dates for the wells, but figuring out actual well profiles is difficult on these multi-well leases.
Using the completion query on Klotzmann, lease # 09899 in district 2, there are 8 wells on the lease with completions “submitted” (I don’t really know what that means) Feb 2012(1 well), July 2012 (1 well) and 6 wells in October 2012. Looking further at the 6 wells submitted in Oct, 3 wells were completed in late May 2012, and 3 more completed in late June 2012 (the submitted dates should be ignored you have to dig deep to find the info.) This accounts for the output maximum in July 2012.
Also the 1st well was completed in Nov 2011 and the second well was completed in March 2012.
The cumulative output for these 8 wells is about 204 kb/well over 39 months, 6 of the 8 wells have been producing for about 32 months.
The fact is you can’t really trust Lynn Helms’ completion or backlog numbers. And don’t forget he was forecasting a 1% drop this month and for every month through to June/July, even when he has the data in front of him (though he probably has more important duties than accurately forecasting output, in his defence).
Yeah, that information emerged a few months ago . . . the data is all suspect.
Probably true in general of most things.
Also, check out this good Radio Ecoshock show about nuclear fallout and forest fires kicking it up again, as well as Tim Garret’s work on, ‘the convergence of Peak Oil, climate change, and economic distress – all in terms of the laws of Physics’.
Can’t post table…
Must… post… table… before… civilization… collapses… ^u’
(What table?)
It was a graph but not all that important. I had written a reply and the graph was part of the response, what I meant was that I had deleted the response because it didn’t make sense without the chart. Anyways I really should be off doing other things.
Fair enough, Fred. Incidentally, what are you doing? You mentioned something about underwater stuff.
Yep, I’m going to be spending a lot more time on my local reef, like the one described below to see and film staghorn coral reef ecosystems.
Along the Fort Lauderdale coast, a patch was found about 325 yards off Northeast 18th Street, another about 430 yards off Vista Park and one about 325 yards off the north end of the Bahia Mar Fort Lauderdale Beach Hotel, where A1A splits. Another patch stands about 540 yards off the center of John U. Lloyd Beach State Park. It is illegal to touch the coral.
I live about 6 miles from John U. Lloyd Beach State Park and can easily reach the reef with my kayak. I will try to get in better shape by diving on my home reefs before heading to reefs off the coast of Brazil. I will be hydro touring with a Lunocet Pro fin and free diving, no scuba tanks… I’ll try to get video documentary of the state of the reefs during my dives.
Very cool, Fred. I just looked up your location on the map and this Lunocet fin too. It looks fast.
Please let us know how it goes where you can. Did you write that you were going to produce a documentary film, and/or at least blog your findings?
What are you expecting to see and what do you think happens or will happen to the reefs when the water rises?
Did you write that you were going to produce a documentary film, and/or at least blog your findings?
Not quite sure where that will go but I will at least put up a blog and a Youtube video channel. I have a ways to go with the video production learning curve >;-)
As usual in my life I tend to spend long periods of just coasting along followed by burst of activity. I’m also launching a business and planning on spending about six months in Brazil from July to December and will also take my Go Pro and Fin to Brazil to explore reefs there as well.
“As usual in my life I tend to spend long periods of just coasting along followed by burst of activity.” ~ Fred Magyar
We’re two peas in a pod in that, graphics, mountain bikes, peak oil, and maybe a few other ways… Well, we are part of the human family afterall.
“I’m also launching a business and planning on spending about six months in Brazil from July to December and will also take my Go Pro and Fin to Brazil to explore reefs there as well.” ~ Fred Magyar
I’m envious. If you ever need a wage slave, feel free to let me know. I could hold your towel. And field questions from the media. And be your agent. We could travel the world, stay in posh eco-resorts and drive Teslas… poster-boys for the Nouveau Green…
Where was I? Oh ya…
But what do you expect to do and find exactly? Did you previously mention something about an interest in the health of that ecosystem, and stuff like coral bleaching, etc.?
Incidentally, I wear a light on my helmet and people keep asking me– relentlessly– if it’s a camera. I’ve started to say yes and have added that they are being netcasted right this very second– live– to an audience of over a million people…
“Do you have anything to say to the world?!”
I should get a Go Pro.
Ask Kunstler what happened to his Y2K predictions.
Where are his predictions here and where are your arguments regarding them? In other words, is Kunstler predicting anything in this case? Or is he simply telling us what he already knows and making some points based on that?
From what is understood, prediction, in an absolute sense, is impossible, perhaps because if one could make a prediction with absolute certainty, the one could take the necessary steps to change the outcome. Maybe this is what happened with Kunstler’s apparent Y2K prediction. ^u’
All the US gov needs to do is add the carbon tax to the price of a barrel of oil.
It could be like ten dollars per barrel. 20 million barrels consumed each day would generate 200 million dollars for the US gov.
365 days times 200,000,000 would provide 73 billion dollars each year, the oil industry could tap the money for some more operating and expense costs, the taxpayer would be on the hook, but it is the least they could do to help the oil industry from going belly up. The taxpayer can be an involuntary investor, in a way.
The oil companies could borrow money from the carbon tax fund to offset expenses and the loan then turned into a grant, pay the finance charges, voila, more money.
There really is no need to burn cash when a carbon tax would pay for those losses.
It’s only 73 billion per year, but it’s a start, the oil companies would not have to worry so much about well economics and too much borrowed money on the debit side of the ledger.
Carbon taxes to keep the oil companies afloat is the way to go.
Add another 25 cents per gallon to the price of gas to have another carbon depletion fund.
I am wondering what the next move from Saudi Arabia will be. If prices go back close to $100 then shale production will start rising again. The Saudi’s need to put fear in the markets, and mainly in the bankers and lenders heads, that they can just increase production whenever they like and get prices to drop into uneconomic areas once more.
As a result you have seen lots of stories about how Saudi can increase production. They have also produced over 10Mb/d over the last couple of months. Could that be a fake to show they can do it, so if they cut back the threat will always remain?
If demand catches up with supply, and prices rise, how can Saudi constrain the shale drillers from ramping up?
Suppose the Saudis had nothing to do with any of it.
I predict that Saudi Arabia will continue to ship their remaining supply of CNE (Cumulative Net Exports) at an accelerating rate of depletion.
Assuming a slight increase in Saudi liquids consumption (from 3.0 MMBPD in 2013 to 3.1 MMBPD in 2014) and taking the preliminary EIA estimate for Saudi total petroleum liquids + other liquids production at face value* (11.6 MMBPD in 2014 versus 11.5 MMBPD in 2005), 2014 Saudi net exports were down to about 8.5 MMBPD in 2014, versus 9.5 MMBPD in 2005. In other words, 2014 was the ninth year in a row that Saudi net exports were below their 2005 net export rate.
Based on the 2005 to 2014 rate of decline in the Saudi ECI Ratio (ratio of production to consumption), I estimate that Saudi post-2005 CNE will be on the order of about 60 Gb.
They shipped about 25 GB of net exports from 2006 to 2013 inclusive, and about 28 Gb through 2014.
Based on the foregoing, in 2014 Saudi Arabia shipped about 9% of their remaining estimated post-2005 CNE, versus about a 5% rate of depletion for 2006, AKA an accelerating rate of depletion in remaining post-2005 CNE.
*The EIA recently revised upward their Saudi production number for 2005 from 11.1 MMBPD to 11.5 MMBPD. Given this latest revision, Saudi production has basically been on an “Undulating Plateau” since 2005, with no material increase in production, given the evident margin of error in the data.
You don’t generally write your work in terms of annual predictions
However would I be correct in assuming the above implies saudi is doing an Egypt in about ten years?
It will be “Interesting.”
After reading a very good book about Saudi Arabia, “On Saudi Arabia,” I started characterizing Saudi Arabia as “Metastable,” i.e., superficially stable, but actually inherently unstable.
Meta-stable seems to go without saying!
And now for our irregularly-scheduled interlude…
Hayajan – Ya 7weneh
these guys are great. thanks. Did you see their version of Comfortably Numb?
Yes, they’re pretty good, and with nice videos too, and we can thank Jeffrey J. Brown, also, as I found them by accident in researching a little of Saudi Arabia from Jeffrey’s comment. (And I do like to go a fairly out of my way to find contemporary talent around the world, so it’s nice to catch one by accident.)
…Yes, the good sound of ‘Comfortably Numb’, in Arabic. ^u^
Gerd, the typical reaction is to change the price used in economic evaluations to cover the likelyhood that prices will drop. I don’t think we will see many companies gambling with a WTI price > $85 per barrel until the price has held 10 % above that figure for 1 to 2 years.
Saw this a couple days ago. from the EIA’s Annual Energy Outlook rather than the Short Term Energy Outlook.
U.S. EIA energy outlook 2015: Up to 70 GW of solar generation capacity could be installed through 2040
“In the coming decades, additions to U.S. electricity generation capacity are expected to be lower than in the recent past, according to the U.S. Energy Information Administration (EIA)’s latest Annual Energy Outlook 2015.
In EIA’s reference case, which reflects current laws and policies and does not include EPA’s proposed Clean Power Plan, US total generating capacity (including end-use generators like rooftop solar PV panels) will increase from 1,065 gigawatts (GW) in 2013 to 1,261 GW in 2040. ……[snip]
Reference case expects 31 GW of solar PV capacity to be deployed through 2040.”
According to data from the Wikipedia page Growth of photovoltaics, US installed capacity stands at over 18GW, more than 6GW having been added in 2014 alone. So these guys are expecting the growth of a potentially disruptive technology that, is experiencing good growth in manufacturing capacity and cost declines due to ongoing process improvements to decline relative to “the recent past”?
On the basis of what exactly?
If the US were to install 6 GW of solar PV per year for the next two years, the nation will be less than 1 GW short of the EIA’s reference case for 2040! In light of that, how realistic is their reference case?
Even if one does not buy into Tony Seba’s Clean Disruption ideas which, suggest an acceleration in the pace of PV deployment, even the EIA’s “High Economic Growth” case of 70 GW of solar PV still seems grossly pessimistic. Again, if one uses a steady rate (unlikely) of 6 GW per year, the US would hit 70 GW in less than 9 years, sometime in 2023, a full 17 years ahead of the EIA’s best case! What am I missing here?
There is something seriously wrong at the EIA!
No islandboy you are not missing anything. The EIA’s methods and data are shrouded in mystery and much like the Land of Oz seem to be mostly hot air and noise at times. There are also groups that try to hold back or disrupt solar and wind since they have or are supported by those who have vested interests in keeping the status quo as long as possible. Society is also full of memes that are not very realistic to begin with and do not get updated as reality changes ( and it is changing quickly).
Ton Seba may have presented a best case scenario but sometimes new technologies grow and/or push aside old technologies very quickly. The horse got displaced quickly by the noisy, smelly, not very practical automobile of the early 1900’s. The train pushed aside the canal. The airplane killed regular transoceanic passenger service by ships. Diesel locomotives quickly pushed aside steam locomotives. The trucking industry almost collapsed the railroad industry. All this happened in short spans of time. All of these technologies looked stupid, impractical and expensive when they started.
Now we have PV, solar thermal, high tech insulation, wind power, electric cars, new types of internal combustion engines. We all accept these things as normal.
Think about it, we can put a piece of modified silicon in the sun and get electricity from it. Not only that, it is practical and scalable. That is about as phenomenal as it gets. A piece of material just lays there and produces usable energy, quietly, no excess heat, no pollution. You would think people would be bowing down and thanking the gods for giving us something that could save us from ourselves. No, it’s just another tech thing and “How much does it cost?” Acting like spoiled princes and princesses.
People are out of touch with reality so why not the EIA?
Here is a factoid for you. It takes less than 300 families insulating and sealing their homes properly to make an oil or gas well unnecessary. Since there are over 100 million households in the US, those simple acts of conservation can really make a difference, and save lots of money too.
If they all consolidated trips and bought higher efficiency vehicles rather than those high end high power vehicles, all those shale oil wells could dry up ( or we would be oil independent).
They would rather spend huge amounts of money and keep the oil wars going rather than change their ways. Of course they don’t think that way.
On the other hand, there is another report from the same source that reinforces my belief that the EIA’s forecast from their Annual Energy Outlook is downright ridiculous.
IHS: Global solar PV capacity to reach nearly 500 GW in 2019
Total global solar photovoltaic (PV) capacity is forecast to reach 498 gigawatts (GW) in 2019, which is 177 percent higher than 2014, according to IHS Inc. (El Segundo, California, U.S.).
While total global solar PV demand is projected to grow steadily, the large number of discrete country markets at the gigawatt-level will help reduce demand volatility, the market research company notes. …..[snip]
Based on findings of the latest IHS “Marketbuzz” report, global solar demand is expected to reach 75 GW in 2019, which is 66 percent higher than in 2014. “
Also from the sam Wikipedia page, Growth of photovoltaics:
“United States
In March 2015, SEIA, the Solar Energy Industries Association and GTM Research, released their U.S. estimate for 2014. In the United States, a total of 6.2 gigawatts had been installed, up 30 percent over 2013 (vs. previous projection of 6.5 GW in September 2014). This brings the country’s cumulative PV total to 18.3 GW. However, according to IHS, U.S. deployment amounted to 7 GW in 2014, or 800 MW higher than SEIA reported.[11] For 2015, annual PV installations are predicted to increase to 8.1 GW (cumulative of 26.4 GW) by the end of the year.[19] Other sources see U.S.-deployment to increase between 8.5 GW and 9 GW in 2015 before peaking in 2016.[11][17] “
So the association that comprises the companies that are doing the installation of solar power, is projecting the addition of 8.1 GW this year, bringing the cumulative installed capacity to 26.4 GW by the end of the year, less than 5 GW short of the EIA’s reference case for 2040. Unless something drastic happens, the EIA’s figure for the reference case for 2040 will be achieved by the end of next year, 24 years early!
At some point this growth in PV capacity is going to have a discernible effect on FF consumption in the US, if it is not already doing so. One other thing about PV deployment is that, once deployed, it is unlikely to ever be entirely decommissioned. After the typical 25 year warranty period is up many modules may still be producing more than 80% of their rated capacity. At that point, what are the owners going to do? Is the owner of a 100 MW facility going to dismantle it because it is “only” producing as if it were a 75 MW plant? PV modules, generally speaking, do not wear out the way rotating machines do. If the EIA does not properly account for the existence of solar PV, they will be forced to in the next couple of years, even if Peak Oil were to be pushed out to 2040.
Hi islandboy
Good point about the way PV’s decline “After the typical 25 year warranty period is up many modules may still be producing more than 80% of their rated capacity. At that point, what are the owners going to do? Is the owner of a 100 MW facility going to dismantle it because it is “only” producing as if it were a 75 MW plant? ”
The 80% point for PV’s occurs between 30 and 40 years. To answer your question, the owner might start a program of replacement if the new PV systems are highly improved. He will calculate the point where it is costing him profit to not improve the facility. It will be a decision based upon profit margin. Of course those old PV panels will probably not go for recycle, they will be sold to private owners to produce their own electricity for several decades to come.
2.5 billion barrels cumulative for all formations ending December 2013
In other words, the Williston Basin. Production will be closing in on 3.2 billion barrels soon. The wells are going to continue to produce until they don’t and new wells will produce to prevent declines in production, depletion won’t stop. In ten years, with new well completions, there will be another 4 billion barrels pumped out of the ground and the cumulative total will be close to 6.5 billion or more.
9,400 Bakken wells pumping 122 barrels per day per well will produce 1,146,800 barrels per day. Take that times 60 and you have 68 million dollars or thereabouts. 68 000 000 x 365 = 24,820,000,000 dollars worth of oil.
So what if they have to drill 1200 at a cost of 8 million dollars each every year to maintain the production levels of 1.1 million barrels per day?
1200 x 8,000,000 = 9 600 000 000 dollars, as you can see, 9.6 billion is less than 24.82 billion.
A bargain, a small price to pay for an additional 400,000,000 barrels of oil to force the price of oil to an affordable level.
Might as well pump it for all it is worth at this point, it’s a superfund site now and the cleanup has yet to begin.
Milk it dry, they’re not doing it for the money, they’re doing it for a shitload of money.
Hi Ronald,
At the wellhead the price is about $40/b, it costs another $22/b in taxes, OPEX, interest and overhead to get each barrel to the well head, so that leaves about $18/b. Each well will produce about 350 kb of oil, let’s say 30,000 wells are drilled for $8.5 million each. So we spend 255 billion dollars and how much do we sell the oil for after all costs? Answer: $189 billion dollars. And our profit is negative 66 billion dollars.
Lets say we need to make 20% on the money invested for this venture to be worthwhile (I will skip discounting to keep it simple) so we would want our net revenue to be at least $306 billion.
So our net revenue per barrel would need to be $29/b, or about $51/b at the wellhead, and adding in $14/b transport costs would mean $65/b at the refinery gate.
This is a lowball estimate because I have not done a proper analysis using discounted cash flow.
In reality $75 to $80/b is needed just to break even. The mountains of debt will require at least $100/b for the LTO players to dig out from the hole they find themselves in, possibly more, especially if interest rates start to rise.
Dennis,
Can we break out the various elements of marginal costs: taxes, OPEX, interest and overhead?
Tax: is that just state excise? Does that take into account ND’s recent reduction?
Overhead: is that a true marginal cost?
Nick G. It is pretty easy to find the information you are wanting. Just Google Whiting Petroleum, Continental Resources, Oasis Petroleum or one of the other companies who pretty much strictly operate in US Shale. Click on Investors. Then click on SEC. Then click on 10Q for 1st quarter 2015. You will find that almost all of the companies report these figures on a per BOE basis.
This makes things a little tougher because BOE includes gas and NGLs. Plus, they do not break it down by field.
That is why I would like to see some LOS for leases in the various shale plays.
Hi Nick,
The royalties and taxes I lump together as these are a percentage of wellhead revenue (about 26.5% on average). And no I don’t have the specific breakout of OPEX, G+A, interest, etc. In the past I have used about $4/b for OPEX and $4/b for G+A plus interest, I have bumped this up from $8/b to $11/b for OPEX plus G+A plus interest. The overhead is not fixed, a bigger operation requires more overhead so G+A is usually done as a marginal cost as it is not fixed.
No I am not assuming the tax reduction as we do not know if this will kick in, the tax break would be 6.5% if it kicks in, so at $40/b at the well head it amounts to $2.60 per barrel. So this would last for the first 24 months of newly drilled wells if it kicks in. The average well produces about 125 kb over the first 24 months, if we assume the oil price remains below the threshold for 12 months and 150 wells per month are added so we have 12*150*125,000*2.6, which equals 0.585 billion dollars in tax savings, not really very significant.
Thanks.
Dennis, looking up page Enno has a graph of North Dakota well production over time. It looks like the wells might have a tough time making 250,000 barrels total production let alone 350.000 that you used in your calculation. That would make the loss much greater. At $18 a barrel, that doesn’t pay for the drilling and fracking cost in either case.
It would take $32 a barrel just to cover the cost of putting in the well if ultimate recovery is 250,000 barrels per well, so the breakeven would be $54 a barrel at the wellhead.
Enno Peters comment was 13/05/2015 at 3:37 PM.
I was wondering the same thing, for the most part. I think 250 will happen, but 350 seems like a stretch, let’s split the difference and say EUR is 300, what do the models show then?
Hi Hillson,
The 350 kb well profile is pretty reasonable, the lowest that is reasonable is about 330 kb which would have the wells being abandoned at 20 years while still producing 10 b/d, unless we see $50/b long term, I doubt wells will be abandoned at that level of output.
Maybe Mike or Shallow sands could comment on what output level they would expect well abandonment in 2028 when oil prices are likely to be well over $100/b in 2015$.
Note that currently I am using 344 kb for the average Bakken well, a change to 330 kb would have little effect on the model. The model at 120 wells per month has about 26,000 wells, so
26,000 wells*14kb=0.36GB less output out of 7 Gb total ERR to 2070.
Note that the average 2008-2014 well has 238 kb of output at 7 years and is producing 46 b/d at month 84. If we assume a 10% exponential annual decline from year 8 to year 20, then at the end of 20 years the well is producing 13 b/d.
Marble good and relevant observation!
FWIIW, there is difference in well productivities (EUR’s) between the counties (and between fields/pools) and so far Mountrail appears to be the best one.
The average well in Mountrail trends (as of now) towards 350 kb.
For Williams it is way lower and there is less spread in the productivity, so 250 kb may be challenging.
Dunn has in recent months seen some interesting developments.
McKenzie remains to have a closer look at.
Hi Everyone,
Using the average well over the 2008 to 2014 period and fitting a hyperbolic model to the NDIC data, I get 344 kb over 298 months (25 years) with the well being shut in at 6 b/d (189 b/month). This may be too optimistic, let’s see what Fernando thinks.
EDIT:
Corrected chart down the thread, more NDIC data included and chart with this comment is not cut off at 6 b/d (cumulative is 348 kb rather than 344 kb).
Dennis: I would try to use a model which ties OPEX to a fixed + variable formula. A fixed $ per barrel is a risky assumption.
I would give each well a fixed cost = $10000 per month direct and indirect costs, plus a variable function of fluid rates (need to add costs for water and oil). But I’m not used to bakken costs.
I agree Fernando. That would be more realistic.
Hi MarbleZepplin,
Note that Enno Peters follows all North Dakota wells, while I track only the Bakken/Three Forks wells. Chart for North Dakota Bakken/Three Forks wells, selected years and 2008-2012 average well.
I don’t see how all of North Dakota versus Bakken/Three forks data should be much different. Most of the wells drilled after 2008 were in Bakken/Three Forks, right?
Hi Marblezepplin,
In 2008-2010 there were still a fair number of non-Bakken wells drilled, what I present are the well profiles for Bakken/Thrre Forks wells. The biggest difference is for 2008 where my curve is very different from Enno’s, the 2008 Bakken/ Three Forks well profile is better than or equal to all years except 2013 and 2014 and is above the 2008 to 2012 average.
EURs of between 250,000 and 350,000 barrels of oil?
What I find so intriguing (and I’m not implying any judgment here, just pointing out a phenomenon) about this whole discussion is the vast difference between the EURs you guys are throwing around and those the operators in the shale plays are throwing around.
At its most recent investor presentation that it gave about a week ago, Pioneer Resources is touting much higher EURs.
• 1,000,000 BOE in the northern Wolfcamp play
• 750,000 BOE in the southern Wolfcamp play
• 1,300,000 BOE in the Eagle Ford
http://i.imgur.com/q2Pz4WP.png
http://i.imgur.com/8K1pw6C.png
http://i.imgur.com/buk5TYW.png
Hi Glenn,
The EUR for the Bakken is “bo” not “boe”, it is the oil that is valuable. The typical EUR for the Bakken is claimed to be 600 kboe, only about 80% of the boe is bo (barrels of oil). That equates to 480 kbo, and that is an overestimate, based on actual well data from the NDIC. For the Eagle Ford there is much more gas and NGL, for the actual barrels of oil it is about 250 kb for the Eagle Ford based on limited data from 2 years ago that I collected from the RRC of Texas on about 400 to 500 wells on single well leases.
Up thread I posted an incorrect chart for the Bakken well profile (it was not cut off at 6 b/d), also some of the NDIC data was not included (only first 60 months on previous chart.)
They show only the very best wells. For the average Bakken well drilled so far I also see an EUR of about 350.000 barrels of oil as more realistic.
With Gas Prices Less of a Worry, Buyers Pass Hybrid Cars By
http://www.nytimes.com/2015/05/15/automobiles/wheels/with-gas-prices-less-of-a-worry-buyers-pass-hybrids-cars-by.html?hpw&rref=business&action=click&pgtype=Homepage&module=well-region®ion=bottom-well&WT.nav=bottom-well
Powerful stuff. Further reason for people to get ready, and getting ready involves firearms, not electric cars.
we are so effin’ stupid….
retail gasoline in CA has climbed about $0.75 per gal in the last month.
If Brent averages $65 for May, the four month annualized rate of increase in monthly Brent crude oil prices will be about 90%/year, from $48 in 1/15 to $65 in 5/15.
All we need is $100 oil and $2.00 gasoline and the economy will soar.
clever. : )
People bemoan the horror of “spikes”, but from the perspective of CPI (Consumer Price Index) measurements, spikes are okay.
A spike will cause a big jump in the CPI for a month. If the next month the spike doesn’t spike further and is flat, that month is 0% CPI. And the next. And the next. Each such of 12 reports of 0% inflation influences the trading algorithms whose automated headline readers see that. The spike is old, forgotten news.
Oil at $110 for 6 consecutive months won’t do anything to PPI (the wholesale inflation). You may get some trickle down pricing increases on shipped goods from a previous spike, but oil itself flat at $110 is not an inflation generator (oh! and look at that, those pricing events were not determined by supply and demand. They were determined by cost.)
FYI however, the Social Security year to year increase is a Y/Y measurement in mid September, as I recall. And guess what, Soc Sec can never go negative in adjustment. That pension can increase. It can never decrease. By law.
Just checked on what LiquidPiston was up to. They develop lightweight, highly efficient rotary diesel engines. Apparently they just produced a mini version that interested the military. Looks like the military will be getting the highly efficient, lightweight engines that run on JP-8.
http://www.businesswire.com/news/home/20150423005821/en/LiquidPiston-Signs-1M-Agreement-DARPA-Develop-Fuel-Efficient#.VVVJE7d_m1u
Their larger engines looked great for high mpg cars.
“California’s special cleaner-burning blend is expensive for outsiders to make and deliver, causing most production to occur within the state.
And the state’s refineries often produce gasoline at near capacity, leaving little margin for supply disruptions.
On Friday, a gallon of regular averaged $4.016 in L.A. County, up from $3.996 a day earlier, according to GasBuddy.
There could be some relief on the horizon.
AAA spokesman Jeffrey Spring said gas supplies are being shipped to California from Asian and Canadian refineries. But he cautioned that they are unlikely to arrive before late May and “probably not before many gas stations post $4-plus.”
I realize we have a unique gasoline blend here in CA, but it seems incredible to me that it makes financial sense to import gasoline from Asia!!!!
http://www.latimes.com/business/la-fi-gas-prices-20150515-story.html#navtype=outfit
Edmunds.com, the “car buying platform” that tracks auto sales with obsessive detail, calculates the “True Cost to Own” or TCO for hundreds of models. “In many cases,” it writes, “TCO points buyers toward an unexpected conclusion: Sometimes the cars that are cheaper to buy are more expensive to own.”
http://grist.org/business-technology/whats-the-cheapest-new-car-to-drive-hint-its-an-ev/
Until they make their algorithm non proprietary, that is safely ignored.
What algorithm?
They break out all of the costs by category and year – pretty straightforward.
Just glanced at it again, I don’t recall seeing all their words being circle R’ed before.
But here’s a quote from it.
http://www.edmunds.com/honda/accord/2014/tco.html?style=200487207&zip=90404 This is their example car. The blue link “More about TCO” yields this:
How We Calculate True Cost to Own®
The True Cost to Own® calculations use the following set of assumptions:
Ownership expenses are estimated for a five-year period
You will drive 15,000 miles per year
You are financing the vehicle using traditional financing, not lease financing
You have an above-average credit rating for the purpose of determining your finance rate
You are making a 10% down payment on the vehicle at purchase
Your loan term is 60 months
Using proprietary formulas, we calculate the five-year costs for the seven cost categories that make up the TCO® (depreciation, insurance, financing, taxes & fees, fuel, maintenance and repairs). We also take into account any applicable federal tax credit.
Dood, look this stuff up before flailing.
Meh – be serious. This stuff is very straightforward. There’s nothing mysterious about depreciation, or any of the rest. They provide the numbers for each category by year, which is the only thing people care about. Their only real secret sauce is the time and infrastructure to collect the data inputs.
They’d like to slow down people from copying the results…
Sadly, many car buyers ask for a 3 year payback on cost savings to justify spending money on something that reduces operating cost. That’s 33% ROI! And, of course, if you lease your car that kind of short-sightedness makes even less sense.
Another justification for regulation, like Corporate Average Fuel Economy rules.
The common modern car is luxury on wheels. Luxury becomes necessity after a while and people are tossing huge amounts of money on the unnecessary. Even the standard models are full of luxury items that add cost and decrease efficiency.
Strip all that junk out, use a high efficiency low horsepower 4 cylinder engine with 5 speed manual transmission and watch those high costs dissolve away. We don’t need 300 horsepower small cars, or cars that make you feel bad to go in your house they are so luxurious. Those air bags don’t do much and are costly and dangerous. A good five point harness with a non-tilting seat that fixes solidly to the floor and some crash reinforcement would be cheaper and far safer than those flimsy seats, half baked belts and cars that disintegrate and crush at 30 mph. Put on a helmet too.
All cheaper and far safer.
“Oh, sorry darling, did the helmet mess your hair? Was the seat too uncomfortable? OK, next time I will turn on the minimal air conditioning. ”
Keep that money in your wallet and toughen yourself up a bit people.
Manual transmissions are now passe’ when it comes to improving mpg. Automatic transmissions are now exceeding manual transmission for mpg. They have more gear options, lockup torque converters, and are integrated with the engine software to select optimal gear ratios in all conditions to meet torque loads and maintain high mpg. The new hybrid drive trains (like Toyota’s HSD) using electric motors to provide a true variable-ratio transmission without mechanical “gears” are revolutionizing drive-train technology even further. GM’s voltec 5ET50 electrified drive train, about to debut in the 2016 Chevy Volt as an extended-range electric vehicle unit, will also be used in the new 2016 Malibu hybrid (with a larger engine and much smaller battery) and achieve both combined 47 mpg and some very impressive acceleration/power numbers in a mid-sized sedan.
I remember when I was in college, the VW bug was the epitome of of mpg – 30 mpg. 4 speed manual. No AC. noisy 40 hp air-cooled motor. Maximum speed 70 mph on the flat. Zero safety features. Disastrous emissions. Engine rebuilds were simple and it was a good thing, as they were so common. I’ll take the available 2015 automotive technology, thank you.
Manuals tranny’s make cars less disposable and extend real life since they
are serviceable. I shall NEVER buy a car from a Car Dealer. No way can most fix complex systems and the owner has no rights once the warranty expires. GM can’t even get an ignition switch right. Tesla has the sales model right, waiting for affordable offerings. BYD is going to put the pressure on Tesla to get real. I have exploded 2 cars to water. Good pavement in future may be the exception. Ground clearance is a must, and doubles as summer dog shelter.
I have a 4 cylinder five speed manual SUV that gets 35 mpg highway with three people and luggage. Tried one of those new Toyota 4 cylinder six-speed auto Camry’s, got about 26 highway. Real life is different than advertisement. Supposedly the little Corrola CVT could outdo my car in mpg, but I haven’t tried it and it’s too small for what I need. The dirt roads would rip the bottom out too.
Wasn’t talking about electrics. They should be well developed in about three years but still won’t do well when the temps hit minus twenty in the winter. The hybrids are too complex, good if you have a lot of money and don’t mind your wallet being tied to a mechanic in later years. All the problems of ICE and electric combined.
I am all for electric vehicles, they have a great future and are where we need to go. I just don’t need a rolling computer system when I am driving, but I guess that is the way things are going. Wonder how often the computers lock up and if they can be hacked. We shall see.
Right now I am enjoying my low cost of ownership and driving past gas stations more often than many newer smaller cars.
In my opinion, small cars respond much better in manual transmission than auto. Autos to me always seem sluggish, unless the foot goes to the floor and they kick down a gear. A manual allows you to select your required gear and then accelerate. Rarely does the foot need to go the the floor. As for breaking, an auto doesn’t bare talking about compared to a manual.
I have heard the new double clutch autos, are an improvement, but have not had the opportunity to drive one.
I tend to agree with the Marble Zeppelin about cars being too much rolling palaces and too little basic transportation.
We don’t need cars that are so complicated it costs as much to overhaul the transmission as it does to buy gasoline for four or five years.We would be much better off increasing efficiency by reducing weight and drag.We would be better off just driving less. And in the end we sure as hell are going to drive a LOT less.
I hear numerous horror stories about relatively late model pickup trucks needing six or seven thousand dollar transmission jobs. For that much money I can buy a pretty decent old truck and gasoline enough to run it a year or two.
But crush zones don’t cost anything. Modern cars are built out of lots of thin metal parts all welded together in what is called a unibody and designing the unibody to crush is easy and cheap.
Hitting something – another car or a bridge abutment – with a car that crushes results in far fewer and far milder injuries to the occupants of the car, wearing seat belts or not.
If you hit a big tree at forty in an old car that does not crush you are probably dead – impaled on the steering column or thrown thru the windshield. A dead on stop from sixty is apt to kill you in such a car even wearing a seat belt.
But if the car collapses three feet in length from the front bumper to the passenger compartment the difference is like falling in a pile of sand or sawdust or hay compared to falling on a concrete slab- from the same height.
But I have no objection to top quality seats and seat belts. The only real problem with racing type belts and seats and helmets is that they are expensive and must be tailored to the individual to work optimally.
And getting in and out would take a few extra seconds. The reduction injuries and deaths would no doubt be a good deal for society –
UNLESS lots of drivers started behaving more recklessly behind the wheel.The accident RATE might actually go up.
I know at least a couple of people who credit the fact they are alive and fully functional to the combination of a crushable car, seat belts , and air bags.
The most compelling reason I have for trading off my ancient work truck is that it does not have airbags. But I don’t drive it much, seldom drive it in heavy traffic, and I drive it slower and more cautiously than I would if it were a new truck.
From the statistics I read lately, airbags have only changed death rates in car crashes by five percent. They were supposed to dramatically reduce death but never lived up to their claims. They injure passengers and can cause death themselves. Adding some structural buffers to the car such as collapsing graphite laminate cones and some more structural beefing up of the cockpit could keep the engine from collapsing into the passenger compartment and prevent crushing of the passengers.
Crash tests are done at 35 mph, people drive 70 mph which is 4 times the energy. Here is a photo of a crash test at 35 mph. What would it look like hitting 4 times as hard? Even at 35 the seat slams forward and the seat belt does not keep the person in position.
Not sure what you are talking about, the harnesses I wore when flying were not custom made, they fit all the pilots, adjustable. Also the steering columns are all collapsible now and some are steer by wire.
I have seen what crashes at high speed look like, the car is just pieces strewn around or so crushed you can hardly get an arm in there.
Light aircraft are much worse.
The pics make my argument , not yours.
It is the SUDDEN STOP that hurts or kills you in an accident. An occupant in that vehicle, belted and airbagged would have stopped over a distance of three feet or so rather than in a few inches.
An air bag is very hard when inflated but still very soft and forgiving compared to the windshield or steering wheel, collapsible or not. The seats are SUPPOSED to give up to a certain extent.
An OPTIMAL seat and harness arrangement is customized to the driver or passenger. Any sort of serious race car has such a harness and seat. As I said before , expensive and time consuming but priceless in the event of a hard crash. I have never seen such a seat and harness in a street driven car except a handful customized by hard core hot rodders. New cars these days have RELATIVELY decent seats and belts and good airbags. This mostly accounts for why the per mile death rate is so much lower than it used to be – in combination with the collapsible unibody. The rest of the improvement is the result of the fast arrival of rescue squads and better medical care.
Very few accidents (relative to the total ) result in a car hitting something straight on at high speeds and stopping dead on the spot. It most cases the driver is already on the brakes and in most cases the car bounces off whatever it hits at an angle and continues on some distance.Thus the impact energy is less than from a sudden dead stop.
It is true that airbags do occasionally hurt somebody but these injuries are increasingly rare in relation to the number of cars on the road. The odds of it saving you are many many times the better than the odds of it hurting you.
Old Farmer your powers of observation are waning. Look closely at the photo. Where is the engine? It’s already crushing the cockpit at 35 mph and the exhaust manifold is inside. The passenger door is already shoved backwards.
How about 50 mph collision which is twice the energy of a 35mph one. What would that car look like if it was hit twice as hard? It’s already used up all of it’s collapse buffer and more at 35 mph crash! Crushing is what kills too not just g forces.
Yes the death toll has been going down lately on the roads in the US. I attribute that mainly to a very strong program to reduce drunk driving and to a strengthening of the cockpit area in most cars.
Don’t try to justify the deaths of over one million people worldwide and over 30,ooo in the US. It’s crap engineering and lack of use of safety devices that really work.
Why does a formula one driver hit a wall at 150 mph (18 times the impact energy) and walk away with a limp? The big factors are a very strong cockpit area, a six point harness and a good but lightweight helmet. Those cockpits don’t crush.
Improving cockpit strength, beefing up the crush zones with collapsible carbon fiber cones, making a better seat belt, and wearing a helmet would most likely drop both the death rate tremendously and the injury rate.
Sure, we are going to keep those airbags, but they have not stopped the deaths. Remember that formula 1 car hitting a wall at 18 times the impact force of the typical car test. Even small improvements at the low energies that passenger cars travel will make a big difference.
The crush zones on most cars are not strong enough yet, the above photo and tests prove it.
Zep,
As 55% of people killed in US are car crashes were not wearing a seat belt, then the easy gains can be made by getting them to wear the one installed, rather than putting a F1 car technology on the road.
Or we can just let Ron’s old title run its Darwinian, natural selection course?
Tool, that 55% number comes from a narrow age range of passengers, basically teenagers, who did not wear seat belts. I agree, people should wear seat belts. The driver and adults in the car should not move the car until all seat belts are fastened. If they do, then the driver needs to be taken into custody for endangering lives.
Hard to beat stupidity unless the car itself will not move without proper seat belt wearing.
You jumped to a conclusion there, I did not say install F! tech in cars, I said to improve the impact technology and safety devices. That would also reduce the millions of injuries seen in emergency rooms each year in the US.
The g-force graphs from car crash tests show a g-force to the head peaking out near 70 g from hitting the air bag. Pub Med published study shows that anything over 50 g causes brain injury. Those air bags need improvement and the head needs more protection.
Of course that is at 35 mph, pretty slow compared to what most people drive. My point was that the safety features of air bags and crush zones was more than used up at 35 mph. We need to do better.
Zep,
I am not disputing your claims on what can be technically improved, just pointing out that it doesn’t matter how technically great a product is, unless people use it correctly it maybe useless. Two cases in point.
1/I am currently in Wisconsin, the weather is warming up, and the motor bikes are coming out of the garages. I have yet to see one bike rider wearing a helmet. So you can supply the most perfect helmet with every bike sold, but unless the rider wears it, it is totally useless.
2/ My Daughter is a qualified baby seat tech. I think that is the title? She is continually frustrated with parents who believe they know now how to install baby seats, but do it incorrectly. The best baby seat in the world is useless, unless installed correctly.
People think idiots are stupid,and you can make things idiot proof. But those idiots are really very smart, and will always find a way around the best laid plans.
Race cars certainly do crush although the drivers cage seldom does. If any race car ever hits anything dead on and stopped in a foot or two at well over a hundred mph the driver is generally killed.
You make my point again for me. Drivers who have such accidents and LIVE virtually ALWAYS hit the wall or barricade at a fairly shallow angle and bounce off. Sometimes the car travels another half a mile or more before stopping hitting more cars and barriers along the way- losing energy at every point.
I will point out that Dale Earnhardt was killed in one out of thousands of accidents at very high speeds on a Nascar track- because he by incredible bad luck actually managed to hit the wall almost straight on on a oval shaped track. I have been a Nascar fan since the fifties and that is the ONLY head on to the wall accident I can remember on the circle tracks.
I have been on dozens of accident scenes physically personally on highways as well as watching many accidents on race tracks personally and on tv.
Not very many cars stop dead in an impact unless it is a relatively low speed rear ender into a very big stationary truck.
The engine in the car you pictured IS NOT In the passenger compartment although it might be shoved back far enough to cause some lower leg injuries.
If that car HAD hit something in a REAL accident the odds are ninety five percent it would have been the back of another car – which would have partially crushed and been shoved forward thus absorbing some of the energy.
In my entire life I can’t remember a single auto accident where the car hit something dead straight on and came to a full sudden stop- except if it were the back of a big stationary truck.I have seen pictures of such accidents of course – where a car left the road and hit a large tree straight on.
You can think what you please. Collapsible unibody construction combined with seat belts and air bags are a hell of a good combination when it comes to preventing serious injuries and deaths.
I pointed out myself that tailored seats and harnesses etc are very good protection but generally unaffordable. Every real race car has such a seat – fitted to the driver like a custom made English suit.
Of course they are not really practical for street cars that are driven by various people.
I walked away from a crash myself at approximately forty five mph when a driver made an unexpected and unsignalled left turn in front of me – without an air bag but with a seat belt.
The front of my car was pushed back a couple of feet. The side of the other car was indented well over a foot. My car spun around into oncoming traffic – still going probably fifteen mph. I knocked the car I hit ten feet sideways and spinning . That driver walked away too.
I almost for sure would have been seriously hurt in an older car that would not have collapsed.
A well equipped and well trained ambulance crew was on the scene within ten minutes. It took the police fifteen minutes to show.
Yes, old farmer. Anyone who has taken physics 101 knows about collisions. They also know about acceleration and deceleration. Simple math.
Point was that the crumble zone was used up and more in a 35 mph test. Needs to be better. Other safety features need to be use. People are still dying out there and getting badly injured. Hope you don’t argue that point.
Glad you were lucky in that crash. You still miss the point but I give up now. I feel like I hit a wall myself on this one.
That’s evolution at work. The rest of us will survive.
Sure, they are getting real deals on the ICE cars. A couple of years of high gasoline prices and they will be right back to buying the even less expensive and better electrics that will be around by then. The car buyers are mostly interested in getting around with a vehicle that suits their needs. If electrics get better and cheaper, the buyers will go there. When it becomes obvious that there is trouble in Oil City, you better have an electric car already, because it will be a long waiting line when the demand way exceeds the supply.
Fickle, aren’t they?
MZ has it right about the availability of an electric car when the sooner or later inevitable oil supply shock hits like a hurricane in the days before good weather forecasts.
Who ever owns an electric in good running order is apt to be able to sell it for twice the original purchase price. A plug in hybrid such as a Volt would be the real ticket.
SOME gasoline will likely be available – rationed of course , and very expensive most likely. But you could hoard your ration if you own a Volt and use it for the occasional trip beyond battery range.
http://portal.ransquawk.com/headlines/south-korea-april-crude-imports-increase-10-7-y-y-to-10-53mln-tons-14-05-2015
10.7%
http://portal.ransquawk.com/headlines/us-president-obama-says-permission-for-shell-s-rdsa-ln-artic-drilling-has-been-postponed-for-a-considerable-period-of-time-until-insurances-are-provided-the-co-can-deal-with-a-leakage-14-05-2015
http://www.zerohedge.com/news/2015-05-14/who-biggest-player-energy
Stock is worth what others think it’s worth. Hmm .. rise valuation so quick?
Drillers Answer Low Oil Prices With Cost-Saving Innovations
http://www.nytimes.com/2015/05/12/business/energy-environment/drillers-answer-low-oil-prices-with-cost-saving-innovations.html
“KENEDY, Tex. — These are lean days in the South Texas oil patch, with once-bustling roads and hotels now empty as the price of oil has plunged and rig after rig sits idle.
Still, production has barely declined, a testament to the rapid gains that oil producers are making in coaxing ever more oil from older wells and the few new wells they are still drilling — and doing both while investing far less money.
…
[Statoil] has cut the average cost of drilling from $4.5 million to $3.5 million a well, in part by reducing the time it takes to drill from an average of 21 days to 17 through better planning and laying off slower crews. …”
They talk of decline in break-even from $75/bbl to $60, possibly as low as $50.
4.5 to 3.5 is 22%.
21 to 17 is 19%.
Why aren’t the faster workers paid more?
Watcher, a roughneck gets paid much better than an oil changer or pizza delivery guy.
Little problem with that – the break-even was never $75 in the first place.
If you have 200 rigs drilling for oil and all of them strike oil, but not all of them produce the same amounts, some very low, 30 bpd, others are producing 1000 bpd and up to 3713 I saw the other day in a daily activity report, ip rates, you can begin to zero in on the the best locations to drill.
The other areas that have been producing poor wells can be abandoned. The lesson is learned, more oil in MacKenzie and Mountrail than those other places.
Since Williams is the center of it all, you have to keep drilling there too.
The drilling can stop in Divide County.
Knock it all down to 50 rigs, all automated, the drilling can continue unabated in the best places, just not as much and with better results, probably with less risk and less costs.
The frantic frenzy, the fog of drilling for oil like there is no tomorrow can take a rest.
212 rigs were just too many, but now they know where to not drill. The better locations are going to reach a saturation point sooner than later.
Decline will begin at that time.
If there are 9400 Bakken wells and one year later they are producing less, some as much as 70 to 80 percent after the first year, then after five years, all wells will be in steep decline, 30 bpd, the production for the 9400 wells will be 282 thousand barrels per day. You’ll have to add another new 5000 wells in five years to prevent that kind of decline.
Might have to go back to steam power and electric cars like at the beginning of the twentieth century.
Steam power and electric, sounds like fun. How about a Doble hybrid design? That would be great.
Change of subject.
Worth reading in depth article on Musk , his way of thinking , etc.
http://waitbutwhy.com/2015/05/elon-musk-the-worlds-raddest-man.htmlhttp://waitbutwhy.com/2015/05/elon-musk-the-worlds-raddest-man.html
Yep! I’m in the process of launching a little international startup company and he is someone I have been following and studying for a few years now. Love him or hate him you have to respect the guy!
Heh, I even have one thing in common with him, I too started to learn programming on a Commodore Vic 20. Though I was much older than he was and I invested in a 16 Kb memory expansion card so I could create my first computer graphic, a 2D drawing of the Space Shuttle.
I’m going to go ahead and call 1.21 million bbl/d for April in North Dakota, based on our production model and the ND daily reports.
*edited to from 1.2 to 1.21 for rounding.
Looks like the rig count has almost stabilized.
the Baker Hughes Rig Count is out. Oil rigs down 8, gas rigs up 2. Otherwise not much happening.
Someone is lending money for this drilling. The reserves impairment valuation of March 31 was only the first step. Another occurs June 30, and Sept 30. If they still frack post Sept 30 with price sub 60, then someone with non economic purposes is lending that money.
The North Dakota Department of Mineral Resources has uploaded the press conference given on Wednesday following the release of the March production data.
Here are a few things I found interesting:
Operators are stating that they will start working on the backlog of uncompleted wells “in earnest” if WTI reaches $65. Stacked rigs would start coming back online at $70. Otherwise, the rig count looks to stay around the current level. At this point, the NDIC is only able to identify one additional rig likely to be stacked in the near term.
At the very end of the legislative session this year, the North Dakota legislature repealed the two tax cuts automatically granted if the price of WTI dropped below a certain threshold for a specific length of time. The so-called “big trigger” was the one being watched the most. Had the average monthly price of WTI dropped below $55.09 for five consecutive months, North Dakota’s 6.5% extraction tax would have been waived for two years. The state would have missed out on billions of dollars in tax revenue. Rather than face that prospect, the legislature got rid of the price trigger altogether and agreed to instead lower the extraction tax from 6.5% to 5% beginning January 1, 2016. Should the average monthly price of WTI exceed $90 for three consecutive months, the rate would increase to 6%. At that point, an average monthly price below $90 for three consecutive months would be required to send the rate back down to 5%.
51 wells that were shut down were brought back online in March. Most of these were older wells in the northern part of the state that routinely get shut down during the winter months.
Of the 189 wells completed in March, most of them belonged to one of just four operators – XTO, Hess, Continental, and Burlington (ConocoPhillips). EOG and Marathon are the two largest operators holding off on completing most of their wells.
The NDIC believes the new oil conditioning rules that went into effect April 1 had a positive impact with regard to the oil train derailment in Heimdal, North Dakota earlier this month. The fire didn’t seem to be as severe or explosive as in other derailments involving Bakken oil.
http://www.youtube.com/watch?v=7rkOIkWv0Vc
A little something for all of us to chew on with respect to the future: http://www.vox.com/2015/5/15/8612113/truth-climate-change
I’m sure the writer is correct with respect to the politics, less sure with respect to the forecast outcome. That said, I’m pretty sure the world in changing and the now the baby lobsters can’t breathe.
http://www.cbc.ca/news/canada/prince-edward-island/climate-change-impact-on-lobster-already-visible-1.3075529
Dennis and others who might be interested in Bakken OPEX and CAPEX (post well completion).
Energynet.com auction has a lot which contains 14 wells in Dunn Co. The completion dates range from 2008 to 2013. There are expenses shown for things such as refrac’s, down hole pump repair and tubing hole repair. Very illustrative.
It looks like the refrac’s may have been a very good use of $$. Got a pretty big kick for not a lot of $$
Might be a good idea for those not familiar with how much expenses can vary in the oilfield to take a look. To steal from Mike, Murphy’s law appears to be alive and well in the Bakken, as it is everywhere else.
I would also note the down hole pump repair and tubing hole repair expenses are not being included in OPEX, but in CAPEX. There are several other expenses thrown into CAPEX which I consider OPEX for practical purposes, because they are to keep the lease going and not for increasing production.
I am not saying the companies are doing anything wrong in accounting this way, they may be required or allowed to elect to do so. It just needs to be understood that OPEX or LOE set forth in various company reports do not reflect the total cost to “run” the well or lease.
For example, a down hole pump change is shown to be over $33K. Tubing hole repair over $66K. The monthly OPEX per well is running anywhere from $10K to $35K, so these types of expenses being left out of OPEX surely skew things when Dennis or others try to model.
Therefore, assuming all companies do this, Dennis may need to revise the OPEX even higher or plug in a line item for maintenance CAPEX. Since the companies throw all CAPEX in one line on 10Q and 10K, this may be very difficult to do.
So son of a gun, if you don’t like numbers, you define them different.
Imagine that.
I’m kind of surprised about the maintenance costs being allocated to CAPEX instead of OPEX. I don’t know oil industry accounting and tax specifics, but at least in the businesses I have owned, we tried to get every expense we could on the OPEX side so we could fully expense the cost in that year for tax purposes and reduce our taxable income. Usually you have to depreciate CAPEX expenditures and only realize a a portion of the cost as an expense each year.
Of course, I’ve always operated business at a profit. If you’re losing money, as most of these shale operations are, I guess it would be better to capitalize as many expenses as possible so that if you make a profit in future years, you have additional depreciation expenses to knock it down and reduce taxable income.
HVACman. I told a story awhile back about looking at some production a publicly traded company had for sale.
In the initial brochure, the company listed OPEX at $X, which seemed low to us.
After we signed the confidentiality agreement, we were given access to everything. Pump changes, tubing repairs, etc were all being capitalized. After refiguring everything, we came up with our version of OPEX being close to double. Another public company ended up buying the production and I bet they are treating it the same.
It is tough to get a full handle on the financial aspects of oil and gas sometimes. I think the key point is that, at current prices, as I showed up thread, the major US independents cannot keep growing production as they have been.
I take back the re-frac’s not costing a lot. They did cost a lot, billed over several months.
Shallow, are you sure they were “re-frac’s?” A re-frac in my opinion will likely cost more than the initial frac for HP and proppant purposes and even with reduced costs that will still be upwards of 3.5M, IMO. Slick water, or dendritic fracs do not require the same amounts of proppant but do the HP; I would think they might be almost as expensive. Dendritic fracs are not new, of course; I did many in fractured carbonate plays and that is an old ploy at post frac stimulation.
Please describe to me your opinions of CAPEX and OPEX; I am unclear what the confusion is and why one classification may be used over another. Is that yet another shaleism thing? In the hundreds of wells I have drilled in my career we must close the drilling accounting to be able to classify and take IDC deductions and set the schedule for depreciating of tangibles. Essentially everything after the fist barrel goes to the ST, its all operating expenses thereafter, save certain recompletion efforts, say for behind pipe tests. I don’t understand how a shale company can, as you infer, wander back and forth from CAPEX to OPEX. What is the point in that?
It is difficult to generalize about operating costs; your post down hole would suggest that. Water hauling runs the gamut, from 1.50 to 5.00 a barrel. I am aware of two rod jobs on shale wells in the past 10 days, unfortunately; one was 28K and went like silk, the other well the rods were parted and engaged with an overshot, DHP pump would not come off seat, the rods were backed off, the TAC was stuck, which had to be shot off and fished, all that pulled wet and under pressure that made an enormous mess, tubing hydrostatically tested, rods replaced, new DHP…that “rod job” was 167,000 dollars. Its pretty hard to make assumptions about OPEX; I always allow two down hole maintenance events per year, one easy, one not, and a certain allowance for surface maintenance, like the two heater treaters I saw this morning on fire. OPEX is kind of all over the board.
Thanks for explaining.
Mike
I analyzed 9 of the wells in the auction lot for the month of 2/15 concerning production and lease operating expenses. For some reason the lease operating expenses for the remaining 5 wells were not displayed. In any event, I assumed 20% royalty for each well. I did not figure gas sales in.
Well name. Date completed. 2/15 oil. 2/15 H2O. OPEX/bbl
Borth 41-14H. 2/09 485. 305. $30.64
Fred Hansen 34-8H. 9/08. 943. 234 $12.99
Gehrer 21-14H. 2/09. 455. 230. $47.64
Lazy DE 24-7H. 7/09. 10,611. 4,238. $2.80
Lazy DE 34-7H. 7/09. 11,890. 5,427. $1.87
Nicky Kerr 14-8H. 3/13. 4,040. 3,445. $9.82
Paul Rhode 21-29H. 2/10. 490 1,350. $74.46
Rhode USA 14-20H. 2/10. 1,711. 1,368. $20.06
Curtis Kerr 24-8H. 3/13. 3,921. 3,590. $11.24
The Lazy DE wells were re-frac’ed in late 2014 and 2/15 is the second full month of production after the refrac. The last month before refrac, the wells produced 1,033 and 686 barrels of oil respectively.
The Curtis Kerr had a tubing leak. Including cost to repair it, OPEX becomes $32.75.
The Rhode USA had a pump change. Including cost to repair it, OPEX becomes $51.98.
I hope this illustrates what I have been harping on, that once one eliminates the new flush wells, OPEX climbs exponentially. Also, if pump change and tubing leak repairs are not included in OPEX, same is distorted too low.
Water hauling is the big expense. It looks like low volume wells (oil and water) may be ok if down hole repair is minimal. See the Fred Hansen well. They are not ok if water/oil ratio is much past 1/1. See Paul Rhode.
And then there are taxes. Does it really matter if the wells don’t cover the costs of drilling and fracking? Also the OPEX/barrel goes up per day as the flow decreases rapidly. Or am I wrong on that one?
Shallow thanks for sharing.
If I read the numbers right, the general trend is the higher the flow the lower the OPEX (and vice versa).
It could be interesting to also have a weighted average OPEX.
After our discussions further up I have found the time to look more in detail into production/extraction developments for Continental and Whiting in Bakken.
These two companies had (operated) about one third of added wells in Bakken during Q1 15 and a look at the production development (for the wells operated by these companies) may reveal which companies were growing production in Bakken.
Then compare that to estimates of their cash burn (increase in debt) for Q1 15.
Rune/ Shallow,
I realize for accounting purposes and NPV, it is only the front years that matter, when it comes to drilling a well, but to achieve any where near the often quoted EURs, then the long 20-30 year tails are going to have to be highly productive. But as Rune has pointed out the wells are getting more front end loaded, and as Shallow has pointed out OPEX is most likely to be higher than expected. Both of these mechanizes are going to drastically cut these long expected tails considerably. I do not believe Shallow sees himself owning and producing a heap of these wells at 2 bopd.
I feel it will be interesting to watch the leading edge wells, Bakken, 2010, Barnett 2008 etc,and see how they are handling their tails, and see if any/many come up for premature shutins/P&A?
Not directly on topic but nevertheless relevant. This is news from my backyard.
Coal- can’t live without it- not yet anyway- and can’t live with it- if it is burned nearby.
Anybody who would trust the lawyers and pr people who work for a major corporation needs his head examined.
But I will say that the state of North Carolina has done a better job RECENTLY in dealing with such problems than most people think. The state has tightened up coal ash environmental regs to a very substantial degree since the big spill got into the river.
I can get this paper locally and read it often. There are a lot of articles in it that go into much greater depth than papers such as the NYT.
http://www.journalnow.com/news/state_region/duke-to-provide-water-to-nc-residents-with-tainted-wells/article_ef8f48e4-c9e9-5d38-b8f4-7bcea5120a99.html
BNSF week 18 carload report
10,750 carloads of petroleum, a 5.98 percent increase from week 18 of 2014 which had 10,143. Regardless of the price, the supply has been consistent and the volumes don’t fall at all.
41,893 coal cars, must be warmer out there up north.
Seems to be some demand for fossil fuels.
I have a map of the United States printed in 1911. It has every rail line in existence at that time. No roads, just the rail lines, a plethora of rail lines.
Lots of train songs in the country music world, the repertoire of country music train songs is a long list.
Before that, the songs were about muleskinners out on their old mule line. Then the Atchison, Topeka and The Santa Fe started rolling down the line and the music turned to tunes about trains. The Wabash Cannonball and The Wreck of Old 97 are two of them.
Then along comes A. P. Carter and sings songs about drinking moonshine and A. P. ends up with the Bear Creek Blues.
Without that coal, you would have never even heard any songs about trains.
Write BNSF and thank them for hauling coal and oil so you can hear a tune about trains.
Yes Ronald, at one time the railroads ran this country. The invention of the automobile and truck along with the giant highway systems being built killed many of the railroads. The shift from coal to oil for home heating didn’t help either. Anthracite was depleting anyway. Little of it made sense from an energy standpoint, but energy was cheap and plentiful and freedom was to had for the price of a car. They did not think about the huge costs in highways, bridges, wars and pollution that everyone would pay.
Now we have cars and planes that are as efficient as passenger trains and getting better. Luckily railroad freight movement is still way more efficient than trucking and better at moving bulk items, so we are in a railroad renaissance now.
Luckily, if we have to move back to steam locomotives, the Nazis developed a steam locomotive that was more efficient, faster and much easier to maintain. Look up the German V-8 steam locomotive.
FOR ALL
The socalled fracklog gets a lot of attention.
What is the status for a well to enter the fracklog?
Is it drilled and awaiting fracking?
Or is it awaiting fracking from the moment it is spudded?
Where in the well manufacturing process will a well be classified as awaiting fracking/completion?
From the NDIC Directors Cut:
”At the end of March there were an estimated 880 wells waiting on completion services, a decrease of 20.”
The discussion is interesting, but what is more interesting to me is that no one discusses marginal cost versus marginal revenue. Over a few years, that’s what matters, nothing else.
Has anyone tried EIA’s so-called new international portal? It’s extremely difficult to use and many of the previously available data (like monthly oil production) can no longer be located