North Dakota publishes monthly ND Historical Barrels of Oil Produced by County. This data however does not include confidential wells. But they do estimate, by county, their confidential well production here: Oil and Gas Production Report
All charts are in barrels per day and are only for the last 16 months in order to get a better and expanded view of what each county is doing.
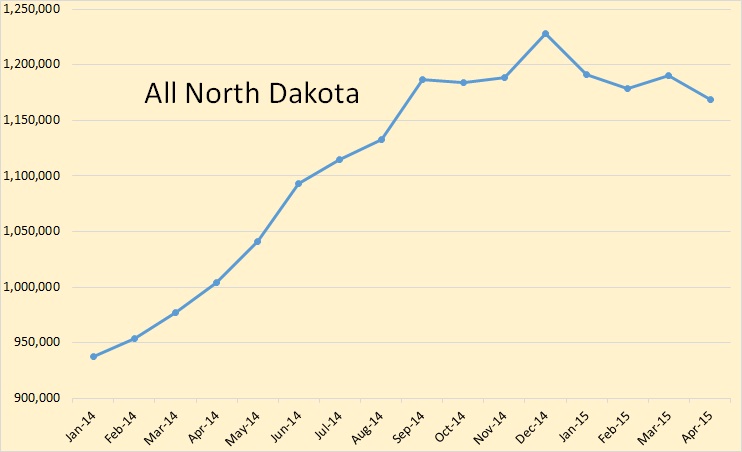
First a sixteen month view of all North Dakota production. North Dakota production, in April, stood at 1,168,636 bpd. That is 17,631 bpd below their production last September, seven months previous. North Dakota production is down 59,385 bpd since the high reached in December.
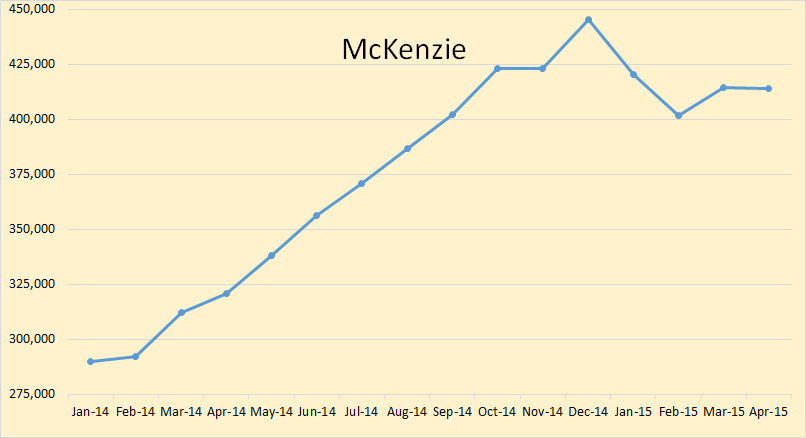
McKenzie County April production stood at 413,671 bpd, 31,555 bpd below their high in December.
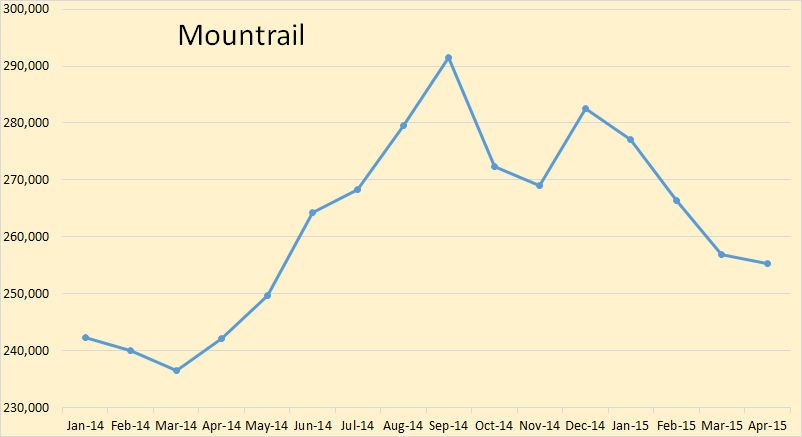
Mountrail County production stood at 255,384 bpd in April, 36,132 bpd below their peak in September.

Dunn County, North Dakota’s third largest producer peaked, so far, in March at 202,609 bpd but fell 15,348 bpd in April to 187,262 bp.
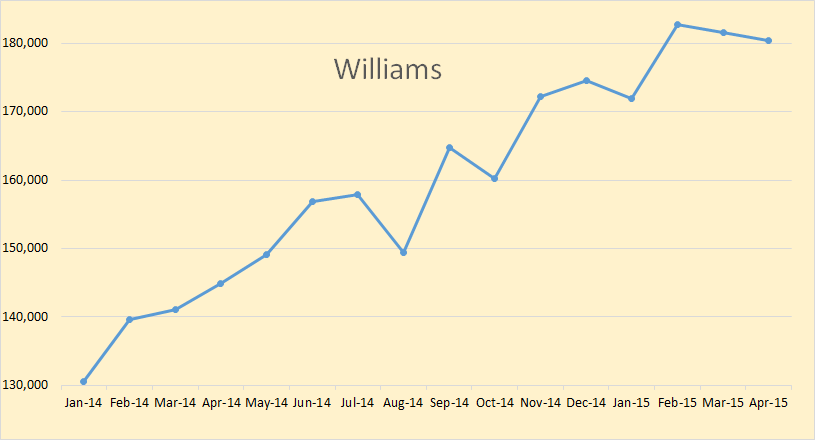
Williams County production stood at 180,434 bpd in April, 2,239 bpd below their latest peak in February.
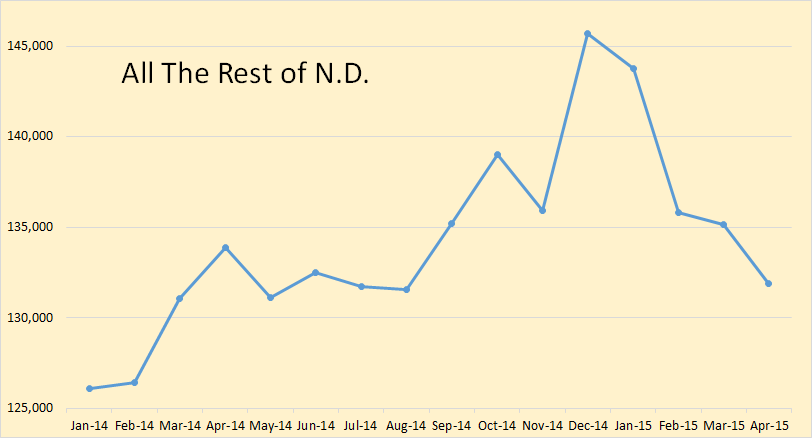
Production in all the rest of North Dakota combined stood at 131,885 bpd in April. That was 13,802 bpd below their peak inDecember.

Here I have a zero based chart of all four counties plus all the rest to give a better comparison of what each county is producing.
I hope this gives everyone a closer look at what is happening in the Bakken.
What’s happening in Canada? Is production increasing of declining? I know the Alberta Oil Sands are not all of Canada’s production but it is where most all the increase in Canada crude oil production is coming from.
Gas Production Falls in Q1 2015
Q1 2015 saw a significant fall in oil and gas production across Alberta, with many companies recording large declines in core operating areas compared to the end of 2014.
Between Q3 2014 and Q1 2015, overall Alberta production – excluding oil sands – has fallen by 8% (56,880 boe/d) and between Q4 2014 and Q1 2015, overall production has fallen by 5% (34,165 boe/d). This is due to a number of factors; the fall in global commodity prices is perhaps the major reason for this decline, but companies have also suffered due to other external pressures such as pipeline difficulties or maintenance periods, for example. CanOils Assets is a powerful new tool that can identify both where production declined to the greatest degree and which companies recorded the biggest net decline.
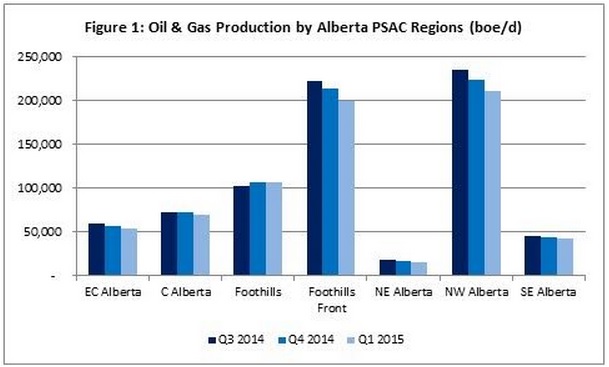
Here we have production from every area of the Alberta Oil Sands. Every place decreased in production each quarter.

Every area of the Alberta Oil Sands dropped significantly in each quarter. Of course this is oil and gas production. But I find it strange that gas production could fall so much that it drug down the total by that much.
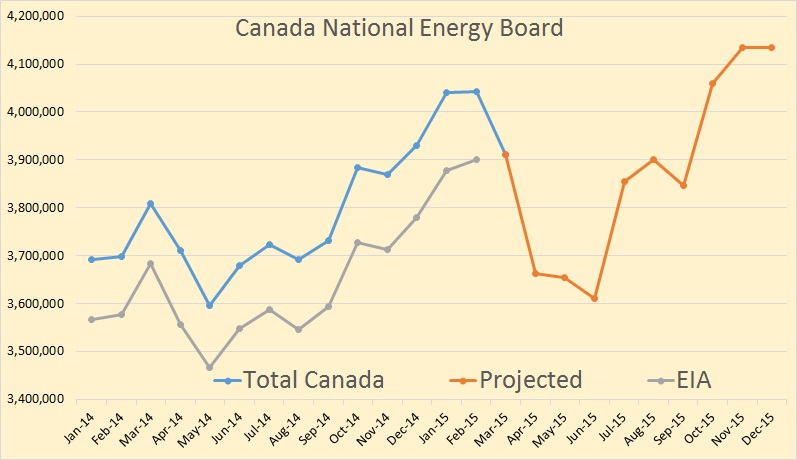
Here is actual Canadian production and future projection from the Canadian Energy Board along with the EIA’s estimate of Canadian production. They seem to have the exact amount except for the EIA’s estimate is an average of 140,000 barrels per day lower. I suppose Canada is counting something the EIA is not.
In Other News
Petrobras slashes investment by 37 per cent to reduce leverage
Petrobras, which is one of the world’s most heavily indebted oil companies, said that it was cutting its projection for investment in 2015-2019 to $130.3bn, or by 37 per cent in relation to its previous plan…
In a statement, Petrobras said that it was cutting forecasts for domestic production to 2.8m barrels per day of oil equivalent by 2020 from the previous target of 4.2m.
It appears that those who expect Brazil to hold off Peak Oil are betting on a losing nag.
Our old corcunopian buddy Michael Lynch has an article in Forbes. Hw he seems to be a bit worried about what’s happening in Venezuela:
Desperate Venezuela 4: Oil Market Impact Of Unrest
Low oil prices would seem to suggest that there is nothing to worry about from potential political unrest in Venezuela. I think it’s more that the situation in Venezuela’s problems remain over the horizon for many oil traders, until the level of unrest increases to the point where oil production and exports appear to be threatened. The economic and social situation has become horrendous, but since there have been no terrorist attacks (or Kardashian visits, kind of the same thing), it hasn’t gone the media coverage it deserves.
___________________________________________________________
Note: If you would like to receive an email notice when I publish a new post, then email me at DarwinianOne at gmail.com .
Oil Production Vital Statistics July 2015 – equilibrium reached
Ron, IEA is making life difficult with revisions. US revised upwards once again by 300,000 bpd even though the May number is down on April. Most of N American falls are in Canada and Mexico – according to the IEA.
Looking at the collapsing spread between Brent and WTI I’ve come to a few conclusions, and would thoroughly enjoy others thoughts.
1. Increases in Saudi and Iraq production, along with the market perception of potential future rises in Iran, Iraq, and Saudi production, is putting downward pressure on Brent.
2. U.S. imports are down, continuing a multi-year trend. This also puts downward pressure on Brent as less U.S. imports are equivalent to increased supply – more oil available for the world market.
3. U.S. production is down (at the same time imports are falling) putting upward pressure on WTI.
I see this trend continuing, and what it means to me is that WTI will have a strong incentive to
A) Rise more rapidly during up movements.
B) Have a more resilient price floor for any downward moves.
It helps that both of those have rang true during this last few months of stability in prices. WTI moves lower in slow, even, multi-day moves, but upward moves happen swiftly and strongly.
For my trading strategy this is a bit of a golden egg – downside risk is moderate when/if crude prices break trend lower, the price floor in a downward move has strong resistance, upward moves are strong and abrupt when/if crude prices break higher, and there is multiple, weak resistance ceilings that a strong move would break through easily.
Betting on oil going up basically has a great risk ratio in terms of potential loss/gain at the moment. There’s plenty of reasons we could see prices move lower going forward, but it would be temporary, moderate movements. There’s also plenty of reasons oil could move higher going forward, and if we break this price window of stability, then we’d see strong movement into a much larger price window with a clear floor (the trend breakout price) and no defined ceiling.
1. 2. and 3. together could lead to WTI price higher than Brent ?
Without an Iran nuclear deal I don’t see prices going much lower.
Hi Ron,
Data from the National Energy Board (NEB), shows a drop in output in March 2015 of about 130 kb/d, output for March is similar to Dec 2014 levels. Note that data after October 2014 are estimates by the NEB as not all province data is in from Nov 2014 to March 2015, the estimates will be revised as new data comes in.
https://www.neb-one.gc.ca/nrg/sttstc/crdlndptrlmprdct/stt/stmtdprdctn-eng.html
Thanks Dennis. So it looks like the big drop was in March. 130,000 barrels per day, that is one hell of a drop.
Hi Ron,
You are welcome, thanks for your post.
The drop would be expected given the oil price, it is similar to the drop from April 2014 to May 2014, also the data after Oct 2014 are estimates and will be revised.
Dennis I cannot seem to bring up the data you have posted here. I can only get the average for 2015 and the data appears to be in tons per day. What did you use for a conversion factor?
Hi Ron,
Try the following links:
https://www.neb-one.gc.ca/nrg/sttstc/crdlndptrlmprdct/stt/2015/stmtdprdtncdncrdlqvlnt2015.xls
and
https://www.neb-one.gc.ca/nrg/sttstc/crdlndptrlmprdct/stt/2014/stmtdprdtncdncrdlqvlnt2014.xls
There are two sheets in the Excel files, one is in cubic meters per day and the other is in barrels per day. The file gives the average for the year, but it also gives the monthly data (in english and french) to the left of the yearly average.
There is a separate excel file for 2014 and 2015, blue data are estimates and the black data are actual reported output by the provinces. Any Canadians that are more familiar with NEB data, please correct me if I am mistaken.
Conversion factor is 6.2898108 barrels per cubic meter.
Got it, thanks. I have made some changes in the post based on those numbers.
How long do you think the fossil fuel lobby is going to hang on? The ones who are fighting every attempt to transition to something other than oil, gas, and coal.
I’m not saying those sources of energy are about to run out. But when do you suppose policy makers will start to think in terms of Plan B?
Hi Boomer II,
My guess is that when output starts to decline over the course of several years (2017 to 2023), the mainstream media may wake up to the reality of peak oil. Reporting total liquids in barrels of oil equivalent may help somewhat because currently the barrels of NGL and ethanol are reported as being the same as a barrel of crude by the IEA which is silly. Output should be reported in Gigajoules (or Exajoules).
“My guess is that when output starts to decline over the course of several years (2017 to 2023), the mainstream media may wake up to the reality of peak oil. ”
Dennis, I don’t think that will happen. Not in your timeframe mentioned. When output starts to decline oilprices will rise far over $ 100. Then demand destruction will kick in and mainstream media begin to talk about demand being the ‘problem’. Only a few months they get the chance to talk about peakoil, like several years ago.
I tend to think that demand destruction has already kicked in. Consider 2 million barrels/day of biofuel, another million in demand offset by CNG vehicles, and another 500,000 offset by electric, and hybrid electric vehicles.
The Saudis obviously see the demand shrinking, and want to sell as much oil as they can while there’s still a market. It’s the exact opposite of what peak oil proponents have been predicting.
Hi JohnB and Han,
The whole “peak demand” meme is kind of silly. Even peak oil proponents understand that supply is equal to demand, this is Econ 101.
Peak oil is about oil output where supply=demand so a decline in oil output would always be about a decline in supply and demand.
Bottom line, peak oil= peak output, whether it is because supply or demand has peaked really does not matter, the correct answer is that both supply and demand have peaked.
If your point is that the mainstream media is pretty clueless, on that we are in agreement.
DC,
I think it is all about guys like JohnB trying to salvage the last bit of respect that they can muster, considering how right the Peak Oil thesis has turned out.
So they try to rewrite the argument as Peak Demand and then attempt to declare victory. How phonily transparent.
Would that be “The Hubbert Thesis” ?
http://www.hubbertpeak.com/hubbert/natgeog.htm
Or “The Oil Drum Thesis” ?
http://www.theoildrum.com/node/2716
Dennis,
While I agree with you, I think a finer distinction needs to be made.
When people say “peak demand” they mean something like: world oil demand peaks, and decreases in spite of falling prices thanks to renewable energy.
The typical idea associated with “peak oil” or “peak supply” is that the oil supply peaks, decreases, and this leads to ever increasing price, which of course prices a lot of people out but ultimately leads to a slowing economy, lower living standards, and some sort of civilizational collapse over decades.
Hi anonymous,
There can be many interactions between supply and demand. Oil will become more difficult to extract as it depletes and this will cause the price to rise, the economy will respond by finding other sources of energy, over time these may decrease in cost as economies of scale and technological development reduce costs. I guess my point is that it is not either/or the two effects will interact in a complicated way. And the main point is that peak oil includes both of these effects, it is not about only supply or only demand it is simply that oil output will reach a maximum and then decline, nothing more or less.
Hi Dennis,
The price of oil rose spectacularly between 2005 and 2008. This did not result in the economy responding by finding other sources of energy. Instead, the result was demand destruction and recession. Then oil prices rose again from 2009-2014, and averaged over $100 for about 3 years. The result was demand destruction again. So, the invisible hand did not produce your expected result in both cases, yet you continue to hope it eventually will. Why would it do so in the future if it can’t seem to today? The economy appears to be only getting weaker. Perhaps you should consider some physical limits to growth in your projections.
Alternatives constitute 3 times the production of ND, and continue to increase.
http://www.reuters.com/article/2015/06/16/usa-oil-production-kemp-idUSL5N0Z22JM20150616
Yes, that’s what I mean exactly. If we’re going to look ahead to 2023, we need to consider the growth of alternatives. E.g battery electric vehicle production has been doubling every year, for the past 4 years. If this rate of growth continues, there will be 300 million EVs on the road in 2023. There is also growth in Hybrid, CNG, and Biofuel based vehicles. Japan is now pushing Hydrogen as the ultimate solution.
http://www.usnews.com/news/business/articles/2015/07/01/toyota-nissan-honda-back-hydrogen-stations-for-fuel-cells
Bottom line – oil is no longer the only game in town. You can’t project into the future without considering all of the variables.
While I am open minded about new technologies enabling us to get by with less oil per capita year after year and still maintain our present day standard of living – everything else held equal- I am not of the opinion that alternative tech such as electric cars etc will scale up fast enough to keep the price of oil down.
EVERY year the tired old super giant and giant fields that supply most of the oil supply get a little older and a little more tired. EVERY year the new fields that are brought into production seem to be ON AVERAGE smaller and more expensive to produce than the ones brought on line the previous year.
Now it MIGHT be that the Saudis are doing all they can to keep the price of oil down in order to force the Yankee tight oil industry out of business.
But MY opinion , for what it is worth, is while they are not sorry to see our domestic tight oil industry on its knees, this is not their primary goal but rather a bit of ” icing on the cake” in terms of their REAL goals.
First off anybody with any real acquaintance with business must understand that the tight oil industry is basically here to stay once prices go back up – and that it will stay so long as the money to run it is available and the oil comes out of the new wells.
When some industries shut down, they shut down for good. The tight oil industry is NOT one of that kind.
The equipment is being or will be put in storage and brought out again when the price of oil goes up.
There are PLENTY of people in need of just about every kind of job in the oil fields these days- with the possible exception of a few people with highly specialized skills the industry will NOT have much trouble scaling up again.
The ground has been surveyed and explored, the regulations are in place , the infrastructure such as pipelines, roads, rail terminals, and housing is already in place to a huge extent etc.
The ONLY thing that is going to KEEP the tight oil industry down is geology and cheap oil.
Now let us think about WHY the Saudis sell oil. There is ONE and only one primary reason they sell it- to get the money.
There are some secondary reasons – they don’t want to upset the world wide economic apple cart for instance.
But they could INCREASE their GROSS revenue by CUTTING their production by say three million barrels a day which would probably be enough to put the price back above ninety bucks within a few weeks. Their NET revenue would skyrocket.
So – Maybe I am wrong but I do not think the Saudis or anybody else is willing to sell oil cheap over the long term to keep tight oil PERMANENTLY off the market. That would mean selling cheap for just about forever in practical terms.
Now as far as selling oil while there is still a market for it-given that it depletes by about four percent annually it is extremely likely that the supply ON AVERAGE will fall faster than the need for it so long as the world economy holds up.
The existence of hundreds of millions of ice powered trucks cars ships tractors farm machines etc etc virtually guarantees a robust market for oil for at least a couple of decades longer even if we were to go on a war time footing switching to alternatively fueled or driven vehicles.
BP wasn’t trying for oil twenty thousand feet under the sea for the fun of it but rather because the company believed it had little choice. Shell has not been trying to crack the ARCTIC NUT for the fun of it either.
So far as I know just about every body agrees the Saudis could make MORE money by selling a LOT LESS oil.
Time to fix supper now but I will post some possible reasons later why I believe they are pumping as usual without cutting back. They may not convince other people but I think they fit the facts better than the idea they are just out to destroy the tight oil industry.
“……That would mean selling cheap for just about forever in practical terms.”
o f m, that doesn’t concur with:
“……it is extremely likely that the supply ON AVERAGE will fall faster than the need for it so long as the world economy holds up.”
There is no plan B as such. Oil and gas Companies have been buying up their stock and shrinking. Prices will eventually rise, they’ll produce less oil, try to switch to produce more gas and NGL, and as they shrink the earnings per share will do ok. This will go on for 30 to 40 years, beyond that they have no idea. If you think oil companies will invest in wind turbines you have a surprise coming.
If you think oil companies will invest in wind turbines you have a surprise coming.
That wasn’t what I meant.
I meant communities might start making plans for a world that has less oil. I expect that the oil company owners will get as much money from their companies as they can and then they’ll all likely be gone (i.e., cashed out or dead).
Computer technology ended the reign of many companies. Those companies didn’t necessarily go away, but they were no longer dominant.
Boomer, two great questions
How long do you think the fossil fuel lobby is going to hang on?
I expect it to be around a long time, but lose it’s dominance as it helps destroy the Republican party. Which can be seen in the clown bus of candidates. Pretty much the only thing holding the lobbies power together now is the racial, religious, gun loving South lead by Texas and Oklahoma. As the country continues to become more cultural diversified and the old guard dies off. The lobby will continue lose it’s power.
But when do you suppose policy makers will start to think in terms of Plan B?
It’s already happening. I would put the transition turning point to be when President Obama took office and the war fighting Republican oil men left in disgrace. Plan B will take a couple of decades to implement, but the world is already in transition. The auto industry is advancing faster than anyone would have guessed back in 2008, when oil reached $147 a barrel. Within 5 more years this will be clear to almost everybody. In fifth teen years from now, you won’t be able to buy a new car or light truck powered by fossil fuel. You already see economic growth at more than twice the rate of oil production growth. Many here at this blog don’t get that concept, but they don’t have to be tied to each other equally.
“Computer technology ended the reign of many companies. Those companies didn’t necessarily go away, but they were no longer dominant.”
History will repeat it’s self, but the names will be changed to Exxon and Chevron. This too is already happening. Exxon is no longer the largest company by market capital value.
Chief. Could you expand on your belief that in 15 years no new fossil fuel powered cars or light trucks will be sold?
All going to be plug in electric powered by solar and wind?
Do you think increasing fuel efficiency standards could push that out further? Miles driven seems to be growing faster than gasoline consumption.
Global warming is real and the only way to slow it down is to stop burning fossil fuel. Like gay marriage and legal marijuana use. There is a major transition going on in the American publics view about the damage humans are doing to the earth.
I might be a little optimistic in my prediction of 15 years, but if it turns out to be 20 years. No one here is going is going to burn me to the cross, I hope. I live in southern California and you can’t help but see the transition to the future. Solar panels are going up on homes all around me. You see Tesla’s and Volt’s on the street every day. The advancement in technology in EV’s is huge. GM is saying they will have a 200 mile range EV in a few years. An EV life style is not really that big of a sacrifice or challenge when you understand what is at stake. Switching personal transportation to EV’s will be seen by policy makers as low hanging fruit shortly and will be the only way to reach CO2 levels that countries are already trying to accomplish. Change is already in the works. We are just watching it unfold.
I remember back in the 60’s when you couldn’t see 200 yards because of pollution, but today those days are seldom. Big things can be accomplished with regulation. One of the biggest obstacles holding back a reasonable CO2 future is the fossil fuel lobby. Clearly, oil producing states and countries have an interest in slowing this progress down. But, holding up a snowball in congress and denying globe warming isn’t going to fly in the future.
I believe increasing fuel efficiency standards are part of the transition and predicting the future time line is difficult but the direction regarding this change is not. We have to reduce our CO2 pollution and there are a lot of policy makers that already understand that.
But, alas, not certain policy makers in Washington State, where the ongoing saga over the $15-something billion transportation bill (mostly for even yet more new highway miles) includes a nice poison pill for any low-Carbon fuel standard (the pill would, predictably, direct money to roads). Now, some might possibly wonder as to how all those new roads might actually be maintained by future generations given the present less-than-swell maintenance of the existing sprawl but umm yay road pork! I guess that’s why they call it a beltway. Ah yep, just ease that out a notch or two more…
States rights, poor education saves, can’t write complete need help and large debt. Minimum wage family values none with more religion and proud to wave confederate(blue, red &white) on pole low carbon to you too and lost AK-15 can’t kill Prius in trailer park. and peak coal back to me? and Obama bad
Bajesus back to ya Amen ! coming to finally tank think – southern lobby shouldn’t vote all at foxy newsless
Do you know what I mean ?
I arrived in the USA when I was a teenager, and I remember the song they used to play was called “California Dreaming”. When I asked my school mates about that song, they told me it meant people in California liked to go to the beach and smoke a lot of pot. That sure gave a weird impression about California. I didn’t find out until later that most Californians were Mexicans and California Dreaming meant they dreamed about Crossing the border and getting to California.
So after 50 years you still don’t know what the song is about. It expresses the narrator’s longing for the warmth of Los Angeles during a cold winter.
Chief, I’m as connected to California culture as you are to the outside world. A lot of what you discussed may work in a California dream, but the Chinese have other ideas.
The global economy cannot work properly without increasing its energy input. We need a different type of economy that doesn’t require continuous growth, but I am not sure that is possible. As it is now, our economy will collapse if confronted with a long reduction in energy input.
As Michael Ruppert (God rest his soul) used to say, nothing will change until we change how money works. Any system that charges interest on money requires growth in order to be sustained. The banksters will most likely blow up the world before there is a monetary system where the govt issues money at no interest.
“Any system that charges interest on money requires growth in order to be sustained.”
One of the things I remember having read, in other words, on the site ‘lifeaftertheoilcrash’.
Hi MudGod,
The problem is not our monetary system. It is our biology. Our species requires growth in order to be sustained.
Screw the banksters, but the coming disaster is not their fault. That is just a false narrative, a rationalization designed to affix some sort of blame or responsibility where none really exists. This sort of story is just a product of how our brains evolved to solve problems by scapegoating. It is similar to the widespread belief that the Saudis are somehow responsible for the drop in oil prices. Just a useful story.
Jay Hanson.
But welcome back, Futilitist. Looks like the POB Futilitist Cycle didn’t collapse entirely. ‘u^
“Just a useful story.” ~ Futilitist
So now what? What are you doing, given all these stories, etc.? Preparing? How?
I still see people driving around in traffic, one person per vehicle, while the city in which I currently reside, Halifax, has solar panels few and far between. Maybe that’s a good thing. Maybe it’s a sign that they are never really going to come in any sufficient capacity, which means that we may need to go back to the Earth and real-time sunlight, real community, and growing/gathering our own food again, etc.. Back to where we belong. No Mars or a Stairway to the Stars for us. Our cultures are and likely will always be as long as we are the way we are, the averaging-out manifestation of the average of human intelligence.
Hello Caelan.
Thanks for the welcome back from my sabbatical.
And thanks for bringing up Jay Hanson. I am obviously a big fan. Everyone should read the link you posted. The Maximum Power Principle, and how it has shaped our evolution, is at the heart of many of the arguments I tend to make here.
“The destruction of the natural world is not the result of global capitalism, industrialization, “Western civilization” or any flaw in human institutions. It is a consequence of the evolutionary success of an exceptionally rapacious primate. Throughout all of history and prehistory, human advance has coincided with ecological devastation.”
~ John Gray, STRAW DOGS
“…in fact, telling primates (human or otherwise) that their reasoning architectures evolved in large part to solve problems of dominance is a little like telling fish that their gills evolved in large part to solve the problem of oxygen intake from water.”
~ Denise Dellarosa Cummins
Hi Futilitist,
John Gray did a critical piece on Steven Pinker’s work regarding violence, incidentally, and we touched on that hereon recently.
But again, given your take on collapse, what are you doing about it, if anything?
Want to join an ecovillage? I have a plan to post an ecovillage project idea here, where the project would involve leveraging a ghost town and turning it into an ecovillage. I also have a specific ghost town in mind.
I have already posted Hanson’s link previously, and suspect that the who’s who of here are already fairly aware of his work, which was also featured on The Oil Drum some years back if recalled.
I agree, the big problem is overpopulation. And seeing how sex is just so darn good a huge dieoff is probably the only solution. My previous point was that we are reaching the limits of a growing economy and any system that charges interest on money must have growth in order to be sustained. It will implode along with the growing population.
My previous point was that we are reaching the limits of a growing economy and any system that charges interest on money must have growth in order to be sustained. It will implode along with the growing population.
I think that will likely happen. But the result, while painful, may help the remaining population survive.
Of course, if the much smaller population ends up thriving, it may repeat the cycle all over again if it forgets the lessons of the past.
Actually there is another solution. Do unto others as you want done unto you. And you don’t have to believe in a virgin birth or the resurrection of a man to live by this principle.
I think “do unto others as they would want done unto themselves” would be an even better principle to live by, but neither the golden rule, nor the platinum rule, will save us from collapse.
You may be right, but if everybody lived by that rule it would be the closest we would ever get to heaven on earth.
Ethics
Hi Fernando,
Nobody thinks oil companies will invest in wind and solar. Society’s resources will shift to energy sources other than fossil fuels as they become more costly than the alternatives.
Dennis, I read dozens of articles, op eds and comments insisting that oil companies have to be forced to invest in renewables. I think biofuels and geothermal are suitable investments, but wind and solar don’t make much sense.
I think biofuels and grothermal are suitable investments, but wind and solar don’t make much sense.
If oil companies think of themselves as energy companies, then any possible investment in that area could make sense.
However, what has changed since some of the oil companies got involved with wind and solar is that Silicon Valley is pushing for a different energy model altogether, whereby big energy companies and centralized energy generation and distribution become less important than distributed generation, utilizing Silicon Valley business models.
Hi Fernando,
If the externalities of coal are taxed appropriately, wind and solar make sense in many places, as natural gas depletes or if natural gas is exported from the US, then natural gas prices will rise and wind and solar will be more comperitive in the US as well.
Yes Dennis, but oil and gas companies, in general, don’t mine coal.
Hi Fernando,
I think we should use all alternatives to fossil fuels, solar is pretty expensive at present relative to wind, we should maximize geothermal and hydro where they are available (if environmental destruction does not result), use biofuels where they are cost effective (and do not create more carbon emissions by destroying rain forests as in some parts of Asia), and use solar in areas where insolation is high.
If the costs of solar continue on there present path it will not be long before solar will make more sense over more of the planet.
We should use what works at minimum cost when all externalities are accounted for.
Yes, but oil companies won’t invest in areas such as wind and solar. Some invest in biofuels. I think geothermal makes sense because it involves wells and topside facilities. The point I try to make here is that trying to force a company to do something it doesn’t know how to do is a bit naive.
The point I try to make here is that trying to force a company to do something it doesn’t know how to do is a bit naive.
Why would they invest? Other companies will just replace them.
Most of the majors do invest in renewable energy. Chevron in particular.
http://www.chevron.com/globalissues/climatechange/renewableenergyandemergingtechnology/
Euan Mears has just posted a truly excellent overview article about geothermal on his own blog called Energy Matters.
I strongly recommend it.
Hi Dennis,
We write a lot of ‘shoulds’ and a lot of it seems to refract through a particular BAU/status-quo(-dependent) techno-energy, self-disempowered, undemocratic prism.
How about more about re-community, relocalization, re-naturalization, re-self-empowerment, resilience, re-generalization (de-specialization), and low energy/tech (individual-empowered) natural/local approaches, like passive solar (good glazing and insulation) and even human migrations to warmer/etc. climes? It’s happening anyway.
We keep talking about when or as the shit hits the fan who are going to take control of nuclear power plants and their wastes and waste pools (and how are they going to manage it with diminishing resources/economics and potentially-increasing social unrest, etc.?), and yet some continue to mention nuclear as if that’s not a concern. Much discourse borders on the ignorant, wreckless, irresponsible and unconscionable, but then practically our entire way-of-life is built on those.
How often do we have to say that our species did not evolve and doesn’t appear to be meant to live at these levels of, generally unethically-derived, social and technological, paradoxically-disempowering/diminishing-returns/diminishing-control complexity before we accept that?
Much of what is written about in terms of responses/solutions requires a society like ours that is predicated on an unethical and corrupt platform. The cart before the horse.
The new CAFE standards require 54 MPG by 2025. It would be hard to build a car that gets that much mileage without making it an Electric Hybrid. A Plug-In option is not that hard to add from there, e.g. the Prius Plug-In.
Necessity is the mother of invention and fifty mile plus per gallon ice powered cars are not out of reach. Building them however is going to cost more due to the high prices of lightweight materials and more sophisticated engines and drive trains.
I foresee hybrids, plug in hybrids, and pure electrics gaining market share far faster than expected by mainstream pundits and conventional thinkers but I am not willing to go so far as to predict a total electric car takeover and the complete demise of the conventional car and light truck within the next couple of decades.
The rules are going to change. Speed limits will be lowered, smart roads are in the offing, car sharing and car pooling are growing by leaps and bounds but from a very low starting point.
Modern communications make it reasonably safe to get in a car with a stranger TODAY . Snap a pic of him or her and his car with your smart phone and send it to your friend or a web site set up especially for the purpose. Check in along the way using the dead man switch failsafe technique. If you FAIL to check in , somebody calls YOU to make sure you are ok and properly enroute. Drivers who want to share rides can get documentation prepared proving they are good citizens. Sharing rides is going to get to be easier and easier as time passes.
Cars will be substantially downsized as fuel supply problems grow. I have no problems foreseeing suburbanites driving two seat fore and aft very narrow , very low plug in hybrid cars that run almost entirely on battery power supplemented with a twenty five horsepower diesel ” lawn mower” sized engine.
A hundred miles per gallon in such a car with such an engine on diesel alone is within reach TODAY. When diesel hits ten or fifteen bucks somebody will start selling them. VW has already put an experimental model on the road that got over two hundred mpg equivalent.
We will see laws passed that in effect MANDATE the production and sale of such cars and other laws passed that will add substantially to the price of gasoline and diesel fuel thereby forcing the owners of older larger cars and trucks to drive them as little as possible and also resulting in the scrapping of such older cars and trucks well before they are actually worn out.
Those of us who believe we will never raise the gasoline tax in this country are failing to take into account the effect the rise of the younger generations have on the culture. We are morphing into a western European type culture fast as the old farts such as yours truly die off. We old farts will be gone in two decades and losing importance fast as far as elections are concerned in another decade.
Young people are no longer fascinated by cars as they once were and cars are no longer necessary status symbols for young men looking for women etc. The cost of owning a car is prohibitive in relation to the cost of car sharing or taking mass transit and neighborhood biking in the community of the future. People who are marginally hard up are already having a very hard time affording a car to get to work.
In a nutshell what this means is that the public OVERALL is not always going to believe in a god given right to cheap gasoline. People who cannot afford to drive will gladly ” stick it ” to those who can expecting the higher tax revenue from higher fuel prices to be spent on more mass transit, bike paths, etc.
This is not to say the average suburbanite is going to give up his suburban home with garage, back yard ,garden spot ,privacy, shade trees ,etc for a non existent comparably desirable place to live down town.
Mr. Suburbanite will buy one of ” them there newfangled leterc go carts” to get to work and run his errands. He will probably keep his Audi since it will be worth very little if he sells it to use for the occasional family trip or outing. Putting ten or fifteen dollar gasoline in a car ONCE IN A WHILE is no big deal compared to not having that car available to go see Grandma. Transit is never going to amount to much in the suburbs compared to super cheap running super small sized cars.
Just getting to a train station and from the destination station to the final destination -door to door – for a fairly short trip – anything under say four hundred miles – can take hours plus the train riding time. Such a trip can usually be accomplished faster and for a damned long time to come , CHEAPER, by driving directly, unless both doors are near the train stations. Cabs and train tickets are NOT cheap compared to driving an existing car. A twenty five year old car with only fifty thousand miles on the odometer is just about as reliable as a brand new car if it has been properly maintained. So the conventional car – old but nice – will remain in most suburban driveways as electrics take over the mass market.
And if we are lucky enough that business as usual lasts another twenty years, there will be plenty of pure electric cars capable of making door to door trips of five hundred miles with no more than one or two stops to recharge at a fast charger.
Most restaurants near a major highway interchange will have a fast charger by then to entice customers into the restaurant. If you spend enough on lunch your charge will be complimentary. Otherwise they will just add it to your check.
As you probably know, some restaurants and some stores already have fast chargers, to lure people to come inside while using the chargers.
As for transportation patterns, in some cases using the train (say from New York to DC) is faster than flying because the train stations are downtown, while the airports are in outlying areas, and because you don’t need to arrive early to deal with airport security.
Front and back 2 passenger seating is an interesting concept.
https://www.startengine.com/startup/elio-motors
Watcher says:
06/29/2015 AT 9:39 AM
Oh and heads up. Oil was down over a dollar in Asia last night as Greece lifted the dollar. Sub 59.
There are 2 days until the 1st of month event. Remember, it is the average of price on 1st of months that determine underground collateral valuation for lending for completions.
Wrapping from end of last ronpost. Doesn’t really matter why the price is what it is. July 1 is an important day, as is the 1st of month of all months.
And the other comment, of more signif:
Watcher says:
06/29/2015 AT 9:35 AM
Probably due for another ronpost, and I’ll wrap this over when it appears.
Re: energy content of varying API degree oil being mass dependent:
http://hypertextbook.com/facts/2009/BennyWong.shtml Quoting The Physics Factbook:
One of the primary constituents of petroleum is hexane (C6H14). The amount of energy released when burned is 4163.2 kJ/mole. You multiply that value by the mass of 1 mole of petroleum. Afterwards you get the value in kJ/gram. Multiply that value by how much mass per liter of petroleum there is. Multiply the final value by how many liters there are in 1 barrel of petroleum and you receive the approximate value of 6.72 GJ.
This supports the energy content of crude vs condensate analysis above that relies simply on mass/barrel, which is more specifically a layout of energy content per API degree.
Regardless of theoretical derivation of energy release per (CHx)n, seems pretty hard to imagine that someone by now didn’t just take some measurements of energy content per barrel of XX API degrees.
And so, looks weight defined.
REPLY
Hi Watcher,
For the non-chemists (like myself), if C+C output was reported in tonnes rather than barrels (lots of counties already do this), would we estimate the energy content of the C+C (or total liquids) more accurately relative to reporting by volume? BP already does this for total liquids consumption, so we could simply take the tonnes of oil consumption and multiply by 7.33 barrels per tonne and divide by 365.25 days per year to estimate the barrels of crude equivalent liquid energy consumed each day. Using BP data we get the chart below. Mboe/d= millions of barrels of oil equivalent per day
A better chart that compares world liquids in Mboe/d (energy) and in Mb/d (volume), data is from BP.
Sorry about the typo, chart without consumption misspelled below.
Thanks Dennis, I enjoy your data-driven posts.
It would be interesting to plot these against population to look at ‘All liquids / total energy vs population’. Any chance you could plot this please?
Cheers.
Hi Dave P,
I have one with Primary energy per capita and oil consumption (based on mass) per capita.
Thanks, that’s great! I wonder when energy / person will peak.
Hi DaveP,
As we move away from fossil fuels to more solar, wind, geothermal, hydro, tidal, wave, and nuclear energy and as population peaks and declines we might continue to see a small rise in energy use per capita. At some point (200 years from now) we could see World income levels (in real terms) at similar levels on a per capita basis as current average European real income levels. Under this very optimistic scenario, where World population levels have fallen to 1 to 2 billion and net carbon emissions are close to zero energy per capita may peak and the economy might reach a steady state (no growth). This does not mean there will not be many bumps in the road between here and there, but it is the road humans should aim for.
It’s be really nice to know what exergy per capita has done over the years, since ultimately we use exergy, not energy. With the general increases in efficiency in many processes I suspect that it might have continued to rise somewhat, however without knowing the aggregate energy efficiencies of various industrial sectors in different countries it’s impossible to say. Of course, many industrial processes are at or approaching their thermodynamic limits, which limits the potential for future gains.
Hi Sam,
I agree exergy would be nice to know, but the devil is in the details, energy is the best data I have (and it is not really great, but any exergy numbers we could come up with would be quite speculative IMO).
I agree we will approach thermodynamic limits at some point, but moving to less thermal production of electricity and more use of electric motors overall will reduce thermal losses. We can do much better in transport by moving to electric rail as much as possible and more public transportation would help as well (in the US). Increased energy costs will drive efficiency improvements, but as always there are physical limits to efficiency improvements.
So, that’s something like 0%/yr. per capita and negative per capita since 2005?
Also, the peak in ND production last summer-fall coincides with the peak for the economy, including employment. In fact, the 12-month avg. of US Treasury withholding receipts vs. wages and salaries suggests that employment is overstated perhaps as much as ~1% (assuming there was not a further decline in labor force participation by a similar amount).
This also fits with the Redbook retail sales (ex autos and gas stations) growing ~1.5% YoY, which is down from 3.5% in 2014 and 3.2% in 2013.
Moreover, the latest estimate for Q2 real final sales SAAR has decelerated to ~1.3% since Q4 (2% for the 4-qtr. avg.), and that’s just 0.7% SAAR YTD and ~0% real per capita.
In order for the 4-qtr. avg. for real final sales to maintain the 2% rate, the SAAR for Q3 needs to accelerate to ~4%.
The incipient bust in the shale and energy-related transport sectors is dragging down goods orders, production, and employment since Q4 2014. The economy is weaker than the headlines indicate. Auto sales are still strong but largely because of sub-prime auto loans. Ex sub-prime loans, and sales would be 12-13M vs. 17M.
Interesting chart, Dennis. What about EROEI the last, say, five years ? And what Dave P wrote.
Hi Han,
There really is not very good data on EROEI, there are a lot of problems with such a measure, where should the boundry be drawn? I pretty much ignore the EROEI stuff, but you are welcome to delve into it. Oil consumption per capita has been pretty flat since 1983 at around 4.2 b per person per year for the World using BP energy data and UN population data (and US census bureau data from 2011 to 2014).
Dennis, I have read about it f.e. in an abstract from an ASPO conference several years ago. Much less EROEI for the ‘hard to get’ oil of course, but this is not that important indeed. Because the energy invested comes from much more than oil products. The quality of crude oil seems to decline (less BTU) on average also though, IIRC.
To the rest of us, who remain concerned about the next generations, the only thing that matters re energy is
Useful energy (needed) return on Carbon Poison dumped into the future atmosphere.
That’s why I am spending my time on wood pyrolysis- it results in Carbon Taken Out, not put in to the atmosphere, with useful net energy produced.
An oil trader, an astrophysicist and a republican go into a bar to have a beer, a guy comes by and says ” what do you people think about Global Warming?”
trader- ” I only think about money”
astro- I only think about black holes”
repub- “Think?”
7.33 barrels/tonne is not the correct number.
And not all of it is converted to energy.
The focus is to what extent can a rising API degree world, bespeaking less and less energy out of the ground, push trucks around that feed you.
First off, it depends on the specific gravity of the “oil” in your barrel because you’re converting volume to weight. Or is that what you’re getting at? Barrel of oil equivalent (“BOE”) is a measure of energy. According to your government, a BOE as equal to 5.8 × 10 to the power of 6 BTU. But surely you know this Watcher; are you playing silly games again? You’re always harping on definitions, well It’s just a question of how you define stuff. Which you know perfectly well.
Meanwhile, I have a question for you. Why do you Yanks insist on using obsolete measuring systems: Fahrenheit, Feet, Gallons, Barrels, Furlongs, Cubits. You could just as well measure oil in buckets or how about pint glasses.
Hi Doug,
So what would a barrel of crude weigh that has the BOE energy, my guess it is 7.33 b/ metric tonne? Which is the figure that BP gives in the BP Statistical Review of World Energy.
7.33 barrels per ton would be correct for very light oil. Very heavy oil with an API gravity of 10 would give 6.25 barrels per ton, the same as water.
How many barrels of crude oil in one MT?
Petroleum has a specific gravity of 0.88 which means 1 liter weighs 0.88 kilograms.
From the volume page we know that:
1 barrel [US, petroleum] = 158.9872972 liter
So 1 barrel weighs:
158.9872972 * 0.88 = 139.908821536 kilograms
1 metric ton is 1000 kilograms:
139.908821536 / 1000 = 7.1475121
So there are a little over 7 barrels of petroleum in a metric ton.
This is assuming that 0.88 is the correct specific gravity. Since as you said, the grade of the oil may make a difference. If you know the exact specific gravity of the oil in question, you will get more accurate results.
Actually I don’t know. I think this as a can of worms that Watcher has opened, the contrary character that he is. You just have to pay attention to the way it’s being used and by whom.
The BTU figure I quoted above is from the US Tax people (whatever you call them). A lot of people just assume one barrel of oil is has the same amount of energy content as 6,000 cubic feet of natural gas and leave it at that: Pretty pathetic I admit. For most purposes, your 7.33 b/ metric tonne sounds OK to me. [By the way, tonne IS metric already]
Just what is the point of determining an accurate BTU content for oils or for that matter for fossil fuels in general. What is it going to tell you?
The end uses are so variable and have such efficiency variation and use variation, what does the BTU value have to do with it?
Sure quality varies, but is that significant to how well civilization actually works.?
Someone tell me why this is actually important?
Hi Marblezepplin,
Energy matters. In many cases humans are attempting to accomplish useful tasks which usually entail work ( force applied over a distance in physics). In a non-magical world energy is expended in the process of doing work, I will not go into the physics and chemistry of this, but typically this is non-controversial for scientists.
Whatever the efficiency of any thermodynamic process, a certain amount of energy will be needed to accomplish a task. So if we want to move food from the farm to the city in a truck, a barrel of ethanol will not get the truck as far down the road as a barrel of diesel fuel.
The ethanol has roughly 65% of the energy content by volume as the diesel, the point is that as currently reported by the IEA a barrel of crude is reported as being the same as a barrel of ethanol, they do not adjust for the lower energy content of the ethanol. If you live 100 miles from where the food is produced and 1 barrel of diesel will get the food to the city, you don’t want ethanol to replace your diesel, unless you would like to walk 35 miles to get your food (where the truck fueled with ethanol would run out of fuel).
Well said Dennis.
To Dennis Coyne in response to his 8:45 AM response.
First Dennis you answered the wrong question. I asked what is the point of determining an accurate BTU value when the BTU value has little to do with what actually happens out at the end use and in society. An 11 percent change in BTU is insignificant to society.
Since you like simplistic examples I will give you a low case one. The car I drove in the 60’s got 1/3 the mpg of the car I drive today. Since the energy is supposedly less per volume, that car is even better than I thought. Do you see it, the change in fuel (if it’s real) did not effect society because society changed the end use capability. Today’s cars are more efficient, have much better handling, longer life and better performance. They are safer too.
Radios. TV, electronics, microwave ovens, fiber optics, lasers, medical devices, and on and on. All better, more efficient and much more capable. A 25 percent gain in world use per capita and no gain in oil use per capita since the 1960’s and society is orders of magnitude further along.
If there was a direct link between BTU value and societal ability then we would hardly have progressed at all since the 1960’s. I would still be consulting a magic eight ball, posting letters in the mail, and dialing a phone. Oh, yes I would also still have an antenna on my roof and we would be unable to breath the air or drink the water by now.
Society is now providing other transport means that are much more efficient and make any minor BTU problems irrelevant.
And feel free to use physics and chemistry if you can, I started out in astrophysics and then spent decades working in chemistry. So cut the patronizing crap.
BTW, even a moron would stop to get more fuel rather than try to carry the food 35 miles (your example). Also, EtOH is not a fossil fuel.
Since the comments have nested off to the right …
Marble Zep
The exact BTUs is for the U.S. Internal Revenue Service tax code,
specifically 26 US Code section 45 K – Credit for producing fuel from a nonconventional source.
https://www.law.cornell.edu/uscode/text/26/45K
see down at (d)(5)
It’s so the taxpayers can subsidize unconventional fossil fuels and biomass gas.
This brings to mind the apocryphal Michael Faraday comment allegedly in response to Gladstone’s question “of what use is electricity?” “One day sir, you may tax it”.
But it seems our society is so perverse, that instead of taxing, we subsidize depleting fossil fuels.
You are right that the actual BTUs in a volume of crude vary greatly, as does its effective use.
Hi Marblezepplin,
I agree that efficiency matters. Do you think there is no limit to how efficient an internal combustion engine can become?
Clearly the average car became more efficient from 1975 to 1985, since then in the US there has been very little improvement in the car fleet’s average fuel economy. The electronics and safety equipment are beside the point.
At any given level of efficiency, the number of Joules in a volume of liquid fuel matters.
I suppose you could claim that if the liquid fuel has half the energy will just make our engines 2 times more efficient, and claim that we have just as much energy as we did before because the volume of liquid remains the same and we can go just as far as we did before.
Then when we run short on liquids, we will just repeat this(1/4 the energy/volume and 4 times more efficient), we won’t worry about physical laws because as every economist knows, we are not bound by the laws of physics when we have human ingenuity. 😉
Hi Dennis.
You are very selective in your application of the laws of thermodynamics.
You disregard exergy. You also disregard EROEI. And you don’t consider or factor in entropy, either. Your fanciful graphs and projections never account for any physical constraints at all. And now you try to chide MarbleZeppelin for his question on efficiency gains, by making a tongue in cheek joke about how economists “know” we are not bound by the laws of thermodynamics. And you add a wink because we all know how silly it would be to disregard the laws of physics! Wow.
Dennis, efficiency was the smallest change I was talking about. Take a look at the whole system not just one small portion.
But even so, Jay Leno asked some young people what kind of mpg their car got. They responded “over 2000”. A special case but still it’s nice to know the boundaries. The Dutch solar car gets infinite mpg. So even so primitive and minor a change as efficiency can make huge differences.
But, to reiterate, look at all the changes in society that have occurred with very little change in fuel per capita. Our abilities are orders of magnitude further along now.
Hi Marblezepplin,
I agree we have made progress. I also agree that a solar car would be a wonderful thing and some day they might be widely available for driving on a sunny day. Do you agree there are thermodynamic and mechanical limits to how efficient we can make an automobile powered by an internal combustion engine?
If not, there is no point of discussing further. I agree much progress has been made, I do not agree that there are no limits to how much more progress can be made.
I also understand that better fuel efficiency can be attained using hybrid electic technology (and have owned a hybrid since 2004 and now have 3, one for a teenager).
Fifty miles per gallon is attainable in a Prius, maybe 60 if you stay off the highway and drive under 45 MPH most of the time.
If the energy in the fuel is lower (as in an E10 blend), you cannot go as far on a tank of gas in any given car. I think that matters if you want to travel from point a to b.
“But it seems our society is so perverse, that instead of taxing, we subsidize depleting fossil fuels.” ~ sunnnv
It is perverse.
We yankees are generally capable of handling the arithmetic involved. LOL
Seriously I HATE metric measure when I am doing hands on work. The decimal inch works just fine for detailed work using micrometers etc.
And the inch denominated tape is infinitely easier to read when actually working by hand. When I was younger I could see halves quarters eighths sixteenths thirty secondths sixty fourths easily. Thirty secondths are hard now but the different height of the markings still keeps me seeing easily down to that level. The millimeter is just too damned big for hand work and a tenth of a millimeter is too damned small. It is too easy to miscount the small millimeter marks all the same height on a metric tape.
Beyond that every thing was BUILT here to the old system of measure. So when you try to use metric denominated plywood or drywall you have to cut some off of every sheet. Trying to use metric measures on any old USA infrastructure is a complete and total pain in the ass.
So far I have not encountered metric lumber personally. But I expect each and every piece would have to be bought over sized and trimmed to work on existing American houses and buildings.
Beyond that going metric means buying new tools in a lot of cases. I AM STILL CUSSING EVERY DOMESTIC MANUFACTURER FOR NOT GOING EITHER TOTALLY METRIC OR STAYING TOTALLY OLD ENGLISH.
I have to own twice as many wrenches as I used to and find just about every domestic machine has mixed fasteners.
Some guys I know who do drywall work just quit when their companies went to doing an occasional job using metric. The sheets are so much bigger and heavier they decided it was no longer worth it lugging them around.
The pay scale stayed the same with the work getting to be substantially harder.
Hi Watcher.
If all liquids were crude 7.33 barrels per tonne would be correct according to BP. I believe what you were saying was that mass would get us pretty close to the energy content of liquid petroleum.
So you take the petroleum consumption (BP’s all liquids) in millions of tonnes per year and find the equivalent bu multiplying the mass by 7.33 to approximate the crude equivalent. How much do you think the average barrel of crude oil weighs. The fact is we don’t have the data on how many barrels of various API densities of crude are produced so this is about as close as we can get. One source on the internet suggests it should be 7.15 barrels per metric tonne of crude.
In another place I found 7.3 barrels per metric tonne.
Dennis,
BP uses different conversion rates for each country.
Furthermore, these rates are not constant, and change from one year to another, reflecting changes in crude mix.
Using one conversion rate for global production would be misleading.
Hmm,
BP reports crude in millions of tonnes, they also say that if you want to convert a metric tonne of crude to barrels you multiply by 7.33. This really isn’t that hard. It is of course possible that the average barrel of World crude does not weigh 1/7.33 metric tonnes, but BP has given this statistic for years, my guess it was the weight of an average barrel at some point in time and is used as a “standard” barrel that has 5.8 million BTUs.
If the mass of oil is roughly equivalent to its energy content, then using 7.33 b/tonne converys this mass of petroleum into these “standard” barrels, AKA a barrel of oil equivalent.
Now we could also use scientific measurements where a BTU= 1055 J so 5.8E6=6.12 GJ.
Now we multiply by 7.33 b to get 44.85 GJ per metric ton.
API 120 liquids are hydrocarbons and are 11+ barrels per ton.
There is an energy conversion issue of CH2(X) vs CH4(X). The methane has more per kilogram, but uncompressed or unfrozen it takes a LOT of volume to add up to the same weight/mass.
Dennis,
BP indeed has 7.33 barrels per ton rate in the table called “Approximate conversion factors” “Based on worldwide average gravity”. But if you use their oil production or consumption numbers from the Statistical Review, you should take into account that these numbers include NGLs (with conversion ratio of more than 10 barrels per ton). So if you make very simple calculations comparing BP numbers in tons and in barrels/day, you can find that the “real” conversion ratio is different for different countries and for different years. This reflects the changing share of NGLs in the C+C+NGL mix. But it may also reflect the changing mix of different crudes (C+C) in global (and individual countries’) consumption and production. Thus, the US LTO, which includes light crude + a lot of condensate has much lower specific gravity than, for example, Venezuelan crude. Hence there are less barrels in a ton of Venezuelan crude than in a ton of US crude.
BP barrels/ton conversion rates for key global oil producing countries and world total (my calculations based on the Statistical Review of World Energy 2015)
Hi AlexS,
The idea is pretty simple. I realize that the API gravity is variable. The point is that if the mass of the petroleum liquid is roughly proportional to its energy content and if the average World barrel of crude oil has a density which is equivalent to 7.33 b per metric tonne, then we can find the barrels of oil equivalent based on these assumptions.
Maybe better drawing the line in the first graph in color red ? Because in the other graph it is the red one.
We take the energy content of crude oil quite often. The first time I had it done was in 1983, to submit Information to a foreign ministry on the tax revenue per energy unit they were collecting. We also do it to understand how much oil we have to burn if we don’t have enough gas.
All large crude oil streams and oil discoveries are submitted for full assays, which include a simulated refinery product slate. Thus it’s fairly easy to get the energy content. Are you trying to set a conversion from barrels to tons?
Almost. It’s mostly an examination of the extent to which a rising condensate / crude ratio world loses energy for X number of barrels. This is another mechanism for trucks delivering less food.
Article on condensate vs. C+C in Russia:
http://blogs.platts.com/2015/06/29/crude-russia-wellhead/
Thanks for posting this link Jeff. This is a very good article. This is just more confirmation that Russia has peaked.
Thus, even if gas condensate production would continue growing through the rest of the year, it is unlikely to compensate for an estimated 3%-5% natural decline at old oil fields in West Siberia. Russia’s main oil province accounts for around 60% of the country’s total liquids output.
I see. Good luck. We have increasing light ends from tight rocks and increasing heavy ends from extra heavy. What’s the future peak for the unconventional tight rock light crude? 10 or 15 mmbopd?
Hi Fernando,
Those guesses for LTO are very optimistic, I would put the peak for LTO Worldwide at 6 to 7 Mb/d, maybe 10 Mb/d is possible at $200/b, but I doubt it. And if oil prices get to $400/b (in 2015$) maybe LTO would peak at 15 Mb/d, but I doubt we would reach that price level for any sustained period.
Dennis, I tend to agree with you. So what’s the world extra heavy oil peak going to be? 10 to 15 mmbopd?
Hi Fernando,
Jean Laherrere’s estimate for extra heavy (XH) oil peak is 15 Mb/d in 2070, my guess is more conservative (I have recently changed this) at 10.4 Mb/d in 2056. So you nailed it. It might be lower than this if Venezuela doesn’t manage to straighten out its government, but I doubt it will be less than 8 Mb/d unless we have a World economic collapse before 2040.
Right, so the extra light and the extra heavy are peaking at roughly the same level. This means we won’t see a lighter mix. We will see a heavier mix coming out of the wells. But some of the extra heavy will be upgraded near the field. I think it’s going to be roughly the same.
The 12 month NYMEX strip for WTI is right at $60. The 12 month NYMEX strip for natural gas is right at $3.
The current month prices for each are in that ballpark.
I understand there are no price guarantees, and either or both could go up or down in the next 12 months.
However, if prices stay in the $60 WTI range and $3 mcf range for 12 months, I think the numbers clearly show continued losses, or at best, meager profits, for US shale. That is even accepting as true the cost reduction claims. My assertion is backed up by consensus earnings estimates, which are near zero or negative.
Of course, we know GAAP earnings make things look better than they are, whereas cash flow, the really important metric, is comical. Cash flow negative for years on end. Sounds like the dot com bubble.
I read an article recently that the US shale companies are winning the “war” against OPEC. I think OPEC is hurting quite a bit too, so ultimately I think no oil producer is winning the real or perceived “war”.
However, for someone to make such a claim given the tremendous amount of financial evidence that is in the open, for all to see, is ridiculous. Yet it happens over and over again. I posted a retort to the ‘winning the war” comment. The author responded that the CLR’s of the world have won because OPEC wants them out of business and they are not. REALLY? Thanksgiving was just 7 months ago.
Did US oil producers and wall street, during the 1986 price crash, make claims as ridiculous as those being made about US shale today? I was around then, but was young and not paying as much attention.
Would be interested in hearing from those who recall what was being said around the time of the 1986 crash. I also welcome opinions as to why the BS keeps on being churned out. Seems like the only one of the financial “in crowd” to take a shot at US shale claims has been David Einhorn.
There were more talking heads willing to take down the dot com bubble than there are US Shale. Why is that?
Speaking of OPEC countries not faring so well the last few months, Bloomberg reported yesterday that KSA foreign reserves fell over $50 billion from 1/15 to 5/15.
Now THAT is a CASH BURN.
shallow sand,
Unlike most other oil exporting countries, KSA has actually increased budget spending this year, and their fiscal breakeven is higher than in 2014
$50 billion in 5 months with exports at around 7,100 kbpd would mean they are spending about $46 per barrel from savings, which would agree with previous estimates that they need $110 per barrel to break even. And as their exports fell 5% last year they maybe need more than that until all the shale gas and solar power developments they have been promoting come on line. There might be a few worried princes over there, and not just because of the problems in Yemen.
Shallow,
Nothing makes sense with shale economics and nothing makes sense with economy in general anymore. Wheels of financial and monetary system are falling off and it is getting harder not to notice that as long as you are not paid not to notice that 🙂
And that narrative of winning the oil “war’ is so imbecile. That “war” left so much collateral damage all over the world and economy that only imbeciles can talk about winning.
Wow. Looking at the production forecast from Canada combined with the data from Texas and no, it looks like North America is down by over 700,000 bpd in June. Or am I reading the data wrong?
I think you are reading it pretty close. North America should be down about that amount from the December high.
Ron, reference Venezuela: the black market rate is 482 bolivars per dollar. The government ran their party primaries, i read a few reports of snipers or armed bands shooting at national guardsmen who arrived to provide security at the polling stations. I posted a link in a previous post about increasing theft of oil well and plant equipment. Medicine shortages are very serious. Food shortages continue. I hear lots of anecdotes of people who can’t repair vehicles due to lack of spare parts. Somebody seems to be murdering the bodyguards of high level chavistas. This may be spurred by their weapons and fancy gear, which is always stolen.
I would say that Venezuela is not all that far from becoming a failed state. What would you say?
I don’t think it’s a failed state yet. Criminal bands are taking over part of the cities, but the government has the firepower to stop them.
The problem Maduro faces is his reliance on these bands to repress the people. The regime uses a layered Brownshirt repression machine, the criminals in these biker gangs are the special forces. They go in to break up protests and murder opposition members as required.
The national guard and the Sebin (a secret police agency which includes Cuban agents) are the official line of repression. Sebin uses arbitrary arrests, took over a bank building near the central university where they keep a torture center, but they are very targeted, and their numbers are small (I know because they copied the Cuban system).
I suspect the sheer anarchy is used as a means to keep people scared and depressed. The government is also incredibly incompetent. If things continue this way there will be a breakdown in December, and at that time we may see a civil war break out. This will be internal to the Chavista ranks, because they are the ones with the weapons. If that continues for a while it may totally break down, and by 2017 we could say it will be a failed state. In which case we can thank Dilma Rouseff, Correa, and other leftist leaders for providing diplomatic cover to one of the most terrible and destructive regimes ever seen.
But a civil war doesn’t automatically mean a state has failed. The failure happens if one side fails to win, and nobody takes control of all large cities and keeps a semblance of order. Colombia has had Marxist and narco guerrillas for 50+ years, but it’s not a failed state.
Meanwhile, in Greece:
Greek crisis: ‘We rely on imports. Soon even the most basic goods won’t be available’
http://www.telegraph.co.uk/news/worldnews/europe/greece/11707173/Greek-crisis-We-rely-on-imports.-Soon-even-the-most-basic-goods-wont-be-available.html
Dunno if I have mentioned this yet, but media stories will get funded by editorial staffs from here on out to horrify everyone about the extreme plight of Greece now that they have dared to try to get out from under the debt.
It’s not about Greece. It’s about Spain and Italy.
“For years, he’s [Noam Chomsky] written about how the west uses a propagandistic press to coerce its own citizens and how it uses covert forms of violence [covert to Steven Pinker?] to maintain power around the world…”
~ From the show, ‘Hot Type’ (CBC)
“Think of the press as a great keyboard on which the government can play.”
~ Joseph Goebbels
James Hamilton posted a link to a very good summary of the Greek crisis:
http://econbrowser.com/archives/2015/06/anil-kashyap-on-the-greek-crisis
http://faculty.chicagobooth.edu/anil.kashyap/research/papers/A-Primer-on-the-Greek-Crisis_june29.pdf
The 2011 , 2012 deal redefined bond maturities that were held by private hands, aka banks. This was decreed. Euro banks didn’t want to take the haircut, but the EU threatened their business licenses. And so their holdings of Greek bonds were slashed — and they were forced to say this was voluntary (always remember . . . in the world post 2008 bond redefinitions aka “restructure” aka “ain’t gonna pay” needs above all other things to be VOLUNTARY, because a voluntary gutting of holdings by ISDA bylaw is not a “credit event” aka default and thus won’t trigger the swaps.
Cyprus banks held a lot of this paper. So when this was imposed by the EU, they essentially were destroying Cyprus, which didn’t bother them much because they felt that Russian money belonged in Paris real estate.
As for Spain enduring the same measures and succeeding:
https://en.wikipedia.org/wiki/2008%E2%80%9315_Spanish_financial_crisis
That’s 2008-2015. It ain’t over, and they requested $100 billion in 2012, which the Greeks never did in one event.
This is all monumental BS. Draghi said he’d do “whatever it takes” and crushed the traders short in European bonds — because he was telling them he would buy bonds. He kept repeating this for years as the Germans said no, we won’t allow it, but the threat kept bond yields down. But failure still reigned supreme and this year he finally got the Germans to say okay. He’s presently buying 1 Trillion Euros worth of European bonds with printed money he creates at a whim, and this will stretch to Sept 2016.
(Interesting tidbit as regards logistics. The ECB (Draghi) is doing this but the way he does it is he creates some Euros and then sends it to member country Central Banks. THEY buy their country bonds. He proportions his magic Euros based on economy size, so Germany is supposed to do most of the buying, of their own bonds. But news out recently indicates Germany is dong these buys, but only at the short maturity end. 6 month paper, not 10 years. Then it expires . . . or they redeem it (which drains that money right back out of existence)). Not what Draghi had in mind.
Whatever the banksters want, they usually get. And the top 0.001% owners of the banks (and central banks and gov’ts) are virtually untouchable, accountable only to themselves.
My go-to explanation on the crisis is this paper from the Levy institute a few years ago:
http://www.levyinstitute.org/pubs/wp_721.pdf
The abstract:
“This paper investigates the causes behind the euro debt crisis, particularly Germany’s role in it. It is argued that the crisis is not primarily a “sovereign debt crisis” but rather a (twin) banking and balance of payments crisis. Intra – area competitiveness and current account imbalances, and the corresponding debt flows that such imbalances give rise to, are at the heart of the matter, and they ultimately go back to competitive wage deflation on Grmany’s part since the late 1990s. Germany broke the golden rule of a monetary union: commitment to a common inflation rate. As a result, the country faces a trilemma of its own making and must make a critical choice, since it cannot have it all — perpetual export surpluses, a no transfer / no bailout monetaryunion, and a “clean,” independent central bank. Misdiagnosis and the wrongly prescribed medication of austerity have made the situation worse by adding a growth crisis to the potpourri of internal stresses that threaten the euro’s survival. The crisis in Euroland poses a global “ too big to fail” threat, and presents a moral hazard of perhaps unprecedented scale to the global community.”
The overall conclusion is that the eurozone (and Germany in particular) is at war with double entry book-keeping and accounting identities. Since books always balance, there’s only going to be one winner in this war.
Misdiagnosis and the wrongly prescribed medication of austerity have made the situation worse by adding a growth crisis to the potpourri of internal stresses that threaten the euro’s survival.
That's all fine and dandy!
But, I guess I keep going back to asking, "when will people finally grasp the concept the infinite 'GROWTH' of any kind, including economic, can not and therefore will not be able to continue on a finite planet"
The underlying premise of the global economic system is profoundly and fundamentally flawed! Either that, or it is the largest ponzi scheme ever perpetrated!
Happy Monday Everyone!
If you’d bow to Thor rather than that fake snake you’re always on about you’d realize that we can squeeze infinitely more of everything we need out of the dirt under our feet (forever). Have a nice day sir.
My Fat Snake Goddess will constrict and swallow your wimpy Thor and put out his little thunder and lightening… It is you who needs to worship at the feet of my snake Goddess… no pun intended! GRIN!
Your obsession with pulsars seems to have taken a strange form, Doug.
Not really, I typically give religion, in any form, about 1-10 milliseconds of thought (per day), typical rotational period of nicely behaved pulsars.
Hi Doug,
I am not a fully qualified biologist by any means, as Fred is, nor an engineer. But I AM a sort of Renaissance Man hillbilly and suggest that both of you should take into account the undeniable FACT of religion and spend substantially more time than a millisecond a day thinking about it.
😉
Religion is to culture and politics somewhat like the weather is to farming- something that has to be DEALT with. Ignoring it is not an option. It confers fitness on the members of religious groups – short term at least.
We gave up the loner life so far back we will never know when. We live and survive as BANDS or tribes these days – super sized of course and now known as nations mostly.
The real religion and god of the world.
http://thetaoofneverdun.com/2014/10/26/money-is-a-god-capitalism-its-religion/
I think that GDP could continue to grow for quite a while, even as standards of living stagnate or deteriorate. GDP doesn’t directly measure standard of living, after all. Certainly lots of people seems convinced that standards of living in the USA are on the wane, and yet the GDP has never been higher.
Anyway, whether or not their analysis is embedded in the “endless growth paradigm”, I still think that the flaws that they identify in the construction of the eurozone are correct.
Sam, take a look at real final sales (GDP less inventories) per capita, and it’s barely higher than in 2007-08. Same for real bank lending.
What is keeping final sales from contracting currently is booming auto sales, which are benefiting from subprime auto loans, without which auto sales would be 12-13M vs. 16-17M.
In real per capita terms, the US economy has merely “recovered” back to the levels of 2007-08 and at a decelerating potential real GDP per capita well below 1% to near 0%.
Moreover, growth of global trade has all but ceased.
This is consistent with the “Limits to Growth” (LTG) scenario.
For all practical purposes, real growth per capita is effectively over.
A lot of investment, such as for government social programs, depend on (un)economic growth.
“More credible is Heinberg’s affirmation… that ‘there are entrenched interests that profit from the system the way it is.’.
Heinberg’s prescription in the face of this bleak scenario? As economic and environmental disaster approaches, he advises, local groups of socially conscious citizens need to organize themselves now to face the coming challenges – sharing practical skills such as food production and storage, home insulation, finding shelter for growing numbers of homeless individuals and families, bulk shopping and sharing of tools and vehicles; arranging a system of bartering of services to counter growing joblessness; creating local currencies where national currencies fail to serve the needs of producers and consumers; setting up community food centres, community gardens, free and/ or barter health clinics and legal clinics, and so on.” Cy Gonick
…So when was global peak per capita exergy? 1975?
Yes, per capita might remain stagnant, but nominal GDP can certainly continue to grow. That was my point, living standards can decrease while the headline figure keeps going up, and nobody ever calls “recession”.
I don’t know if global growth is over or not yet. Ask any Chinese person whether they think growth is finished.
The key point here is that a $ of GDP is not a physically consistent unit or measure, and it changes all the time. It doesn’t tell us a whole lot that’s meaningful about the world, and as such can be somewhat detatched from physical reality.
Jeffrey J Brown,
Short term the situation is very bad in Greece, however long term Greece is much better off than any country in the Western World. Nearly 40% of its budget is reserved for interest and principal payments, which would be reduced to zero in the future. My worries are for the rest of Europe and also the US, which have to shoulder more and more debt. Greece is the big winner in this game.
So you think the Greeks will do fine with a communist government and refusing to pay their debt?
Isn’t it more likely that Greece, Puerto Rico, the City of Detroit, etc. are simply the first of many government entities that are unable to service their debt load? In my opinion, most Western governments have wildly over-promised the benefits that they can actually deliver to both employees and to non-employee citizens.
In his book “Boomerang,” Michael Lewis quoted an analyst who suggested that many municipal governments in California (and elsewhere, such as Illionois) are on track to consist of a clerk to collects tax payments and sends 100% of taxes to government retirees.
In any case, it seems to me that more and more non-central bank creditors are going to be adopting Will Rogers’ point of view in regard to lending to government entities, i.e., he was more interested in the return of his money than in the return on his money.
I wonder how most governments and countries would fare if they had to subsist only on tax revenues, without any new debt?
I suppose that this would be analogous to shale players having to drill only out of cash flow and cash on hand, without borrowing money.
Heinrich wrote:
“Short term the situation is very bad in Greece, however long term Greece is much better off than any country in the Western World. Nearly 40% of its budget is reserved for interest and principal payments, which would be reduced to zero in the future.”
Long term Greece is bad shape, just like the rest of the world. Greece is posed to begin the start of a very long depression, or a civil war.
https://www.google.com/search?q=civil+war+in+greece&hl=en&gbv=2&prmd=ivns&source=lnms&tbm=nws&sa=X&ei=vmKVVfCfHorTsAXo9I7oBg&ved=0CAcQ_AU
Greece will be the first development nation to begin its long term depression, other will follow as the mountains of debt start tumbling down all over the industrialized world. Its starts with the weakest nations and works it way up.
Greece is not going to recover from this. Much as Greece was worlds first super power (under Alexander the great) it never regained its economic power in the last 2200 years. Once an economic power collapses it never returns to its former power. Greece has little to offer, it has little in exports and few natural resources need to sustain its economy. Greece biggest economic contributor is tourism which is going to remain suppressed as financial crisis’s in the EU an the US unfolded (ie few EU and US tourist to Greece).
Re: mass energy content for carbon and hydrocarbons:
Per my Standard Handbook for Mechanical Engineers:
Hydrocarbon BTU/lb lower heating value –
(does not consider the heat value of condensing produced water vapor)
Pure carbon: 14,096 (higher heating value)
Methane: 21,518
Propane: 19,944
Pentane 19,513
Octane: 19,029
n-Decane: 19,175
So on a per-pound basis, NG and NGL’s have up to 10% more energy content than the heavier HC’s. I think that is because the lighter HC’s have a higher H/C ratio. I haven’t looked up the exact heats of reaction, but IIRC, there is more net energy released breaking the C-H bond and combining the free H and O2 to form water than there is breaking the C-C bonds and forming CO2.
That’s right, and hydrogen gas has a specific energy about three times that of gasoline.
Hi HVACman,
Thanks.
We can take methane out of the equation because that is not typically reported as a petroleum liquid.
Ethane should not really be included at all because it is not usually used for energy, it is used as a chemical input for plastics and other products primarily (although it gets reported as energy in NGL content). The idea of using mass is that it is a closer approximation than volume (where NGL would be a 50% greater volume for the same mass (which might have a 10% higher energy content by mass). The “mass” approximation is not perfect, just much better than assuming every barrel has the same energy content regardless of what is in the barrel.
And of course gasoline averages 44.4 MJ/Kg as opposed ethanol at 26.4 MJ/Kg which is worth remembering when you’re pumping the stuff into your gas tank because vehicles operating on E85 get roughly 15% to 30% fewer miles per gallon than when operating on regular gasoline.
The Point Was . . . API number for what is coming out of the ground is increasing. As the condensate / crude ratio increases, there is less muscle for pushing trucks around — or if you prefer a macro view, there is less energy influx into the global economy and there are no measures that can be taken to fix this.
As for feedstocks, if you HAVE to move food then you WON’T make plastic.
That is certainly true.
However, here is an anecdote from personal experience. I owned my first 100% Ethanol powered VW Fox back in Brazil the car was purchased new and I used to drive it back and forth from Sao Paulo to Rio de Janeiro back in the days when I worked on oil rigs for Sub Sea Oil subcontracted by Petrobras. I’m not sure but I believe that those ethanol engines had much higher compression ratios than the gasoline powered ones to compensate for the lower energy content of ethanol. In any case I hardly noticed any difference in performance or fuel efficiency in that particular car.
From Wikipedia:
A high compression ratio is desirable because it allows an engine to extract more mechanical energy from a given mass of air-fuel mixture due to its higher thermal efficiency. This occurs because internal combustion engines are heat engines, and higher efficiency is created because higher compression ratios permit the same combustion temperature to be reached with less fuel, while giving a longer expansion cycle, creating more mechanical power output and lowering the exhaust temperature. It may be more helpful to think of it as an “expansion ratio”, since more expansion reduces the temperature of the exhaust gases, and therefore the energy wasted to the atmosphere.
BTW Embraer makes a really nifty little ethanol powered single engine crop duster.
performance maybe. on fuel economy I have seen a lot of people claim you can tune the engine to do better and eliminate the gap, but it makes no sense. There’s just no way a similar fuel in ethanol can be tweaked to be 30% more efficient
I have read that engines designed to run primarily on ethanol can be almost as efficient as a gasoline engine due to potentially having a much higher compression ratio.
But if the engine is a duel fuel engine and is to be run on gasoline part of the time I have a hard time seeing how it can have a diesel like compression ratio..
I don’t see being able to build a duel fuel ethanol / gasoline engine that has an extremely high compression ratio at an affordable price. Variable compression is pretty exotic and I have never even seen a variable compression engine personally.
So the dual fuel E85 capable engines sold in the USA are just not going to get good per gallon fuel economy running on E 85.
The two or three people I have talked to personally about E85 tell me they got miserable per gallon economy on E85 and after trying a couple of tanks went back to ordinary E10. Nobody sells E85 locally so I have only the experience to go on of a couple of folks who have moved here from where it IS sold.
I would never buy E10 myself except I generally have no choice.
That VW fox only ran on 100% ethanol they were not flex fuel back then. They weren’t able to run on gasoline at all.
Hi Fred,
So although interesting, it is not really much of a global solution, it might work in Brazil, but not anywhere else for reducing overall petroleum consumption.
Any updates on water situation in Sao Paulo?
The drought continues. I will be flying down in two weeks so I’ll be able to report more when I’m there.
I think ethanol from sugar cane can be used in Cuba, Colombia, Venezuela, Ecuador, and in African countries.
Current Oil Price Slump Far From Over
For oil prices, the phase change was caused mostly by the growth of a new source of supply from unconventional, expensive oil. Expensive oil made sense only because of the longest period ever of high oil prices in real dollars from late 2010 until mid-2014.
Monetary policies following the 2008 Collapse produced the longest period of sustained low interest rates in recent history. As a result, capital flowed into the development and over-production of marginally profitable unconventional oil because of high coupon yields compared with other investments.
US oil producers are now spending $3.20 for every $1.00 earned, up from $1.40 for every $1.00 earned in 2014.
Most important statistic from Mr. Berman’s latest column, IMO.
that statistic is kind like oil producers are “printing oil” LOL
You can print oil.
In extreme circumstance, oil doesn’t have to be economical. You have to have it. It’s there. You get it.
Of course, what you get today has a higher and higher API number so it’s less and less able to keep the trucks rolling.
But can you print oil at an historic average FED Federal Funds Rate of 4%, instead of the current 0.25%?
Yup. Ask Argentina. They are subsidizing oil production, having the govt augment the price to get the spice to flow.
Don’t make this mistake. The industry has to care about the dollars, but when the time comes that people are starving in cities, no one will care about the dollars. The Fed will print dollars to make it happen, or if the Fed has been burned and the members of the FOMC pitchforked, then guns will be held to oil driller heads and they will be forced to work.
Don’t just skip over the intervening steps between BAU and Mad Max. There is a path to be walked on that trip. These are the signposts along the way.
“If you still have a job, get everything in order, and quit. Do it as soon as you can, because we’ve never had a more important work to do.” ~ Kyle Chamberlin
Hi Watcher,
You are being way too optimistic.
Since the crash of 2008, the whole system has become very fragile. At this stage, another market crash and prolonged credit freeze could take us straight to starving cities in a matter of weeks (see the Korowicz paper). No path to be walked in that case, just a free fall descent off a cliff, Wile E. Coyote style.
Watcher: “In extreme circumstance, oil doesn’t have to be economical. You have to have it. It’s there. You get it.”
But it will take capital from profitable parts of the economy, and in long term make the economy weaker. Weaker economy will demand less oil, so you will have to subsidy oil companies even more. We have reached world economy which demands 76mb/d of oil, because we generally invested in projects that make profits. Whole goal of the economy is to create ever higher demand for resources. Subsiding unprofitable oil won’t achieve that.
Ecuador’s June 2015 oil production will be about 541 thousand BOPD. It peaked in April 2015 at 556 thousand.
Fernando,
The voice in my head says that Ecuador’s oil production is pretty much all spoken for by China. Is that the case?
Of Interest:
“Deutsche Bank shows a snapshot the S&P’s consolidated income statement as of 1995 and 2015. While there are some clearly material changes transformations: the rise of financials’ revenues above energy companies for one, ”
http://www.zerohedge.com/news/2015-06-30/2015-all-sp-500-free-cash-flow-will-go-back-shareholders
US dry natural gas production data for April 2015 are out (Bcf/d):
Jan15 73.44
Feb15 73.92
Mar15 74.15
Apr15 74.65
http://www.eia.gov/dnav/ng/hist/n9070us1m.htm
Dean,
However, daily rates in June are already below 72 bcf/d according to Bentekenergy.
Yes, I know. In fact, I expect that this data will be revised down, as it was the case with the major revision (down) of January-March 2015
New EIA monthly oil production data for April
Total US production has marginally increased due to a sharp rise in the Gulf
North Dakota down 22 kbd and is now below September 2014 levels
Texas down 64 kbd
If the EIA is too high in their Texas estimate (in the past the worst I have seen is 3% too high) by 5%, for April then TX April output would be about 3525 kb/d and the EIA estimate would be 190 kb/d too high.
Changes from previous month, mostly for Texas.
Numbers for North Dakota, Alaska and GoM largely unchanged
http://www.eia.gov/dnav/pet/pet_crd_crpdn_adc_mbblpd_m.htm
The June 2015 Monthly Energy Review (MER) released last week included US oil production numbers until March which were in line with estimates made in the end of May. It also included estimates for April and May.
Today’s numbers show a big increase in the estimate for April compared to MER.
MER estimate for May hence looks highly unreliable
AlexS. So North Dakota production is an anomaly as TX, GOM and the other states are all still increasing production?
Where do they keep finding oil month after month? Some pretty big revisions.
US will hit 10 million C + C this summer?
No. They were up only 9,000 bpd in April on very questionable numbers from Texas and the Gulf of Mexico. So right now they are 9,701,000 bpd in April. As we move into summer US C+C will go down, not up.
shallow sand,
North Dakota is the first important oil producing state to show a declining trend. Most other will likely follow in the second half of the year.
According to the latest EIA numbers, Texas’ oil production was already down
in April, but we can’t be confident in estimates for Texas given the constant revisions.
Interestingly, in relative terms, the fastest growing oil producing state in recent months was New Mexico: +31% between September and April. This likely confirms that the Permian is now the only growing tight oil play in the US
EIA estimates for New Mexico
Most other will likely follow in the second half of the year.
Hey, we don’t have the May or June data yet. The EIA’s Drilling Productivity Report has total shale down by 115,755 bpd by June and down by 208,782 bpd by July.
I have updated my plot of corrected Texas RRC data with the latest EIA C+C data:
the oldest months tend to converge to my average estimates, while the newest diverge. The problem that I see is that the EIA seems to base their estimates only on the latest RRC data and the previous RRC data published in the month before (which is what I was doing myself last year); instead, now I base my corrections factors on the whole set of vintage RRC datasets at my disposal, which starts in January 2014, making the corrected data much less volatile.
For example, if I used only the last two RRC datasets, I would have the following corrected data, almost identical to the EIA estimates
sorry, the last plot was partially cut in the top (I used an image grabber ^_^)
Thanks Dean. I just can’t believe the EIA’s numbers here. They seem to be about 35,000 bpd too high. I am a little suspicions of the EIA’s GOM numbers also.
Ron,
Despite a recent one-time revision in oil production data for the GoM, I think the EIA numbers for this region are generally reliable. Increasing production in the Gulf is due to several new projects coming onstream. However this growth will be relatively short-lived.
Below are excerpts from an article on GoM’s prospects:
Eyes on the long term in US Gulf of Mexico
Apr 23, 2015
http://www.drillingcontractor.org/eyes-on-the-long-term-in-us-gulf-of-mexico-34965
Production is projected to increase in the GOM this year, despite the downturn, Wood Mackenzie’s Mr Khan said. In 2014, production from the GOM totaled 1.3 million BOED, and a total production of 1.6 million BOED is expected this year. That amounts to an increase of approximately 18%.
The major reason for the increase in production is due to several high-profile discoveries finally coming online, Mr Shattuck said. According to the US Energy Information Administration (EIA), the Jack/St. Malo, Tubular Bells, Cardamom Deep, Dalmatian and Cardona projects all began production in late 2014. Jack and St. Malo alone are expected to produce 94,000 bbl/day of oil and 21 million cu ft/day of natural gas; Tubular Bells’ anticipated daily production is 50,000 bbl/day. In addition to those projects, Lucius, situated in the Keathley Canyon area, also came on stream earlier this year. The field holds an estimated 300 million BOE of recoverable resources, according to the EIA.
The agency’s data also shows that seven fields are expected to start production in the remainder of 2015, including Big Foot in Walker Ridge, as well as Big Bend, Troubadour and West Boreas in the Mississippi Canyon. In 2016, another seven fields are anticipated to begin producing, including Heidelberg and Tahiti 2 in the Green Canyon, and Marmalard, Dantzler and Gunflint in the Mississippi Canyon.
The redevelopment of the Mars and Na Kika fields will contribute to a further increase in production, according to EIA data.
However, although GOM production is expected to increase throughout 2015 and 2016, Mr Shattuck said, it will temporarily plateau at 1.92 million BOED before starting to fall in 2017. By 2020, production is expected to decline to an estimated 1.73 million BOED. “What you’ll see is, essentially, a bit of a wall at the end of the decade,” he said.
While 15 developments will have come online between 2014-2017, only eight are expected to come online between 2017-2020. In addition, by the end of the decade, large fields such as Mad Dog will have been producing for 15-20 years and should begin to see production levels decline.
However, around 2021, production is expected to rebound when new discoveries such as Anchor, Gila and Guadalupe begin producing. Mr Khan also expects any unsanctioned projects that were deferred as a result of the current downturn to be brought back on track, “as long as oil prices return to a higher level. If they remain at these levels, Lower Tertiary projects won’t be sanctioned because they need a price north of $60 Brent,” Mr Khan said.
P.S.
I believe that WoodMac’s projection for GOM production in 2015 is too high, but there will still be year-on-year growth
Ron. Do you mean 350K?
I was being sarcastic on the 10 million bopd.
I never expected Texas and other states to deviate so much from North Dakota. I think we will eventually find out that they didn’t this much.
If I am looking at the numbers correctly, US is up from 9/14 to 4/15 over 700K barrels, yet ND is slightly down during that time.
So the rest of US is up 750K barrels despite price crash.
Why would ND be so much different from the rest of shale. I presume conventional did not increase much, and GOM did not either over that time.
Yeah, I dropped a zero there. I see Dean’s April numbers at 3,350,000 and the EIA April Texas numbers are 3,711,000. That’s a difference of 361,000 so lobbing that a bit is 350.000.
Of course everyone is estimating here and I just think the EIA’s estimate is way too high.
Ron,
Leonard Brecken at oil price.com cites peakoilbarrel in a column he just posted.
He accuses the EIA of cooking the books on their production estimates to put a lid on oil prices.
I know that you and others here question the EIA estimates, but it seems you do not feel there is any “government conspiracy”.
I do not know Mr. Brecken. I know Mike has referenced some of his columns, and oil price.com does pick up some of your posts, I assume with your permission.
Do you know Mr. Brecken? What do you think of his allegation against the EIA?
I think something funny is going on. Why would the EIA need to keep making such large revisions?
As I have argued, crude sales to the barrel can be purchased through IHS Global and Drilling info.com. I believe May should now be available. I have to think the EIA has access to this information, and therefore there is no good reason for these massive revisions.
The problem, of course, is I am biased. Also, I have no hard data to go on. I freely admit this and try to always keep this in mind. My oil investment went from making too much money to too little in a real hurry.
However, when I look at EIA data, I look at every state, not just TX and ND. There are production increases that make no sense to me given the crash in oil prices and the poor oil economics in these states due to high lifting costs (OPEX). Look at the following November, 2014 v. April, 2015, (in thousands):
Florida 183 to 198
Pennsylvania 547 to 632
West Virginia 1,070 to 1,178
Illinois 776 to 844
Ohio 1,825 to 2,223
Utah 3,445 to 3,508
Wyoming 6,470 to 7,439
I do realize that EIA shows other small states down, so I am cherry picking. I also realize PA and OH could be condensate from Marcellus and Utica, although I do not think the drilling productivity reports the EIA puts out support this.
Some of the other small states EIA does have down, but very little. I would include Kansas, Michigan, Alabama, Arkansas, Mississippi and Montana in this group. All of these states have generally high operating costs, and I think drilling and completion activity in these states pretty well shut down last fall. I would also not be surprised if much production has been shut in.
I also question Oklahoma, going from 10,319 to 10,627, a 3% increase in six months. Oklahoma is home to a ton of stripper wells, many of which have been underwater economically for over 6 months. Given the hyped horizontal plays are primarily gas, I question OK increase. Same goes for Kansas, although EIA finally does show it down for April.
Another example that makes no sense to me is Illinois. It is shown up almost 10%. Yet Indiana and Kentucky are down. All three produce oil from the Illinois Basin and are generally contiguous, (Southern Illinois, Southwestern Indiana and Western Kentucky). All three have very high OPEX.
I realize none of the small states move the needle on US production. However, I find it strange that we have increases when drilling activity in these states stopped almost completely. For example, Baker Hughes has reported 1-3 rigs running in Illinois during the first half of the year, and I do not think there are any high volume un conventional wells there.
I am definitely not a conspiracy theory person. I want facts. That is why I dig into the finances. I read the SEC reports. They matter. Investor presentations, which hype the best wells, and metrics which leave out costs, do not.
What do you think? What do others here think?
I think it may be unavoidable that the EIA uses models for some of the states until the complete data is available.
What I don’t understand is why their estimates don’t show the size of the estimation error, and why all numbers have so many digits, when just 1 or 2 are known. I don’t think that is very professional. The likely range in Dean’s model is what makes his model more valuable.
I think the EIA estimates are way too high right now but I am not ready to say it is deliberate. I don’t see how it would be in the EIA’s interest to keep prices low.
They do tend to extrapolate too much. I would watch the Gulf of Mexico deep water. Lots of projects were bottled up by the Macondo freeze, and quite a few are coming on with new wells. This could offset natural decline for say another 12 months. Deep water wells in pre-Miocene rocks are a crapshoot.
Hi Shallow sands,
The Bakken was the first LTO play to really take off so they are further along in reaching the “Red Queen” stage (perhaps they are there already). In Texas the Eagle Ford didn’t really get going until a couple of years after the Bakken (in 2011), but it has ramped up much faster than the Bakken did and may also be close to the Red Queen stage where wells can’t be added fast enough to increase output. The Permian is just ramping up their horizontal drilling and fracking and may be the source of growth in Texas output. The well count has come down a lot in the Permian, but a lot of that has been vertical rigs which have fallen by a factor of 4, the horizontal rigs have been cut in half, but it still may be enough to result in growth as they are just getting started in some of the LTO plays. It would be great to get MBP’s perspective because I think he may work in the Permian Basin (or near there).
Sorry if others have asked questions lately, I’ve been out of pocket for a bit. The Permian still has a bit of activity, but not near what it was this time last year. I work mostly conventional fields, and you are right that drilling in them has basically stopped. We are in a “watch decline” mode. There still are horizontal rigs running, but at a much reduced rate. The slow(er) decline of the conventional portion of the Permian, mixed with a slower ramp-up than other unconventional plays, is what is keeping the Permian from declining. That is my opinion at least. It will probably start declining soon, since the few horizontal rigs running cant keep production flat forever. Now, some of the reduction is because pad drilling (which I’m not a huge fan of) has become more common here so less rigs are needed, but most of the drop is because of economics. That should mean that a lot of acreage terms expire, so on the other side of the bust some good deals could be made on getting some locations to drill.
Hi Dean.
Thanks.
Could you show us a plot of your “average corrections” for Texas C+C together on a single chart with your Jan 2015, Feb 2015, March 2015, and April 2015 estimates so that we can see how they have changed over time ( Probably just the data from Jan 2014 to the present would be best as it will be easier to read the chart and maybe cut the vertical scale to 2,500,000 to 3,800,000 so we can see the differences better). Also could we get the October to April “CORRECTED” estimates in kb/d.
Is there any evidence that your current method of estimating may be biased low for the most recent 3 months of the estimate?
I would think you could determine this by looking at how the “CORRECTED” estimate has changed over time.
Hi Dennis, to reply to your question I will go in some details: as you know, I compute the amount of corrections that each month should undergo to be close to the real data, from T up to T-23. I then use this set of correcting factors together with those computed with past vintage data to compute the average correcting factors over all vintage data-sets. I post the dynamics of these correcting factors from Jan2014 up to April2014 in three plots below: the first one reports the evolution over time for the factors from time T up to time T-7,
for T-8 up to T-15 (I have problems posting images)
https://pbs.twimg.com/media/CI16qxxUEAE19eO.png
and for T-16 up to T-23 (the dynamics of these correcting factors is from January 2014 up to April2015, and not up to April 2014 – sorry for the typo 🙂 )
As you can see these correcting factors are stationary over time, so that I can use the sample mean as a consistent estimate of the population mean: this is why I use average correcting factors, averaged over ALL vintage datasets. However, over time they show some outliers: for example in December 2014 there was a major revision down, while in April 2015 a big revision upwards for months T up to T-2.
What can we conclude from all of this? I am fairly confident that my estimated data up to February 2015 are consistent and close to the true values. For March and April 2015 they may somewhat underestimate the true data because of this positive outlier. Why there was such a bump in March and April? Who knows. I read somewhere that in the last months the revision of old data at RRC has improved, due to faster digitalization of data, etc. Anyway, I expect that the correction factors to come back to the mean as it was the case after the major revision down which took place with the data published in December 2014. If you give me your email, I will send you the whole (latest) dataset.
Hi Dean,
Thanks.
Could you send me the data?
It is my first initial, last name followed by 78 with no spaces all lowercase at gee male dot com. Trying to avoid putting the actual address up.
Hi Dean,
What do you consider the “real” data to be. This is unknown for any of the most recent 24 months. I find it hard to interpret your charts. What I was hoping for was something similar to what Ron does for the RRC data. (I am only interested in C+C though).
So you would plot you estimate from Jan 2015, Feb 2015, March 2015, and April 2015 where the month is the latest data point of your average estimate (or your best guess).
Another way to do this would be to tell us the estimate for Jan 2015 for the last 4 months to see how that has changed over time, but it would be more interesting to see Jan, Feb, March and April 2015.
we will know the Texas almost final production data only after 24 months, but after 12 months the data reported by the RRC have already a good degree of precision, in the sense that the estimates are subject only to minor revisions
as for the my average corrected data estimated in Jan15 up to April15 they are plotted below (again problems with png and jpg upload):
https://pbs.twimg.com/media/CI2E9TwWIAATY4A.jpg
as I told you before, in the last month there was a revision upwards of the most recent data (see my first plot above) . However, I really caution you to consider this evidence of an upward trend (or of underestimation), since this is currently only a phenomenon which really took place in the last month: the correction factors did not change significantly over time except for the last month.
Hi Dean,
Have you noted that those “minor revisions” tend to be higher in almost every case? If you look compare newer RRC to estimates from 2 years ago it is clear that all the data is not in for 24 months, after 12 months the data reported remains about 1% lower than the output that is eventually reported.
The other thing I wonder about is that the output is increasing over time so it seems you would want to use percentages rather than the absolute difference if you are using the entire database.
For example for currently reported data Dec 2014 C+C output is about 14% higher than Jan 2014 output, so one would expect the correction factor would be larger by about 14 % in Dec 2014 vs Jan 2014, do you account for this?
Thank you.
It looks like Feb and march were the exception (where the estimate did not increase), For Jan to Feb and March to April the estimate did increase.
Dean’s chart below, by using the gif format the file size is reduced, I always post my charts as gifs since file size has become an issue.
Dennis it is better to consider the dynamics of the single correcting factors over a large period. Really 4 months are too few to say anything, considering that the correcting factors did not change significantly in 2014 and 2015 up to march 2015, see my 3 plots above
Dennis, Dean has sent me the C+C data. I will have a post and charts tomorrow. The post will highlight the EIA’s recent estimates which I believe are way too high.
http://www.bloomberg.com/news/articles/2015-06-30/opec-crude-production-surges-as-iraq-pumps-at-record-pace
Also, “Over in China, apparent oil demand in May increased by 8.2% from a year earlier to an average of 10.36 million barrels a day, according to a Platts analysis of Chinese government data dated Tuesday. “
Off Topic – Ron, you are probably right that a collapse is coming, but not primarily for your reasons.
Look at Greece. I am 74, and to my knowledge, I have never bought anything made in Greece. They want the world to visit. Come for the climate. They will feed you. They will house you in a 4-star hotel. And you can hire a guide to look at the RUBLE and take pictures of the fallen down buildings that their ancestors built 3000 years ago. Have a nice day. [I believe that Greece is the location of many of the large ocean going shipping companies – but, that is because they can Flag there and not pay any taxes to Greece.]
Puerto Rico. Almost the same thing. The US passed tax laws that favored it for US companies. But, to my knowledge, I have never purchased anything that was “made in Puerto Rico.” [A lot of ethical legal drugs are “packaged” there.]
The world now has too many people, which has resulted in too many people that do not want to work.
In the US, Detroit and Chicago are leading the way towards becoming like Greece and Puerto Rico, with many other locations [Baltimore] not far behind. In my opinion, it cannot end well.
I live near a city in which people are suing to have a Bus Station built in the 1940’s to accommodate soldiers that were traveling by the cheapest means, declared a “historical landmark” that cannot be destroyed. What would the people who built the pyramids think of that? We are sinking so low that it is just unbelievable.
$18 trillion clueless. We are there IMO. Divide that by the US population and then look at the net worth of the majority of the US population.
And I think $18 trillion does not really include everything if we count future entitlement commitments?
I believe that per capita public debt in the US is around $58K, or for a family of four, $232K.
What I read online indicates per capita US debt is higher here than in Greece. But many other countries are too, of the statistics are correct that I am reading.
+ almost 12 trillion in US household debt
Debt is only really debt when it’s intended to be paid back. That $18 trillion is never intended to be paid. I’m not sure you can really even classify it as debt. It’s more of a perpetual income stream to those who own the so called debt, perpetual cause it’s never paid off. Principle balance will never be paid. Not even part of it. It’s not ever meant to be paid.
Government debt only matters when the government doesn’t have control over the printing press as in the case of Greece. Japan’s numbers are far more scarier than both the US and Greece.
Private debt is where economic collapse will happen due to insufficient fuel. Nothing any of or all the central banks can do about it. They can’t buy all the private debt in the world and while they can print money to get more oil out of the ground to keep things going. That has a self life and will actually leave them with less oil faster than it would if they hadn’t gone that route.
All we are seeing now is the can getting kicked a few last times. Then we reach the end of the road.
Hi Sawdust,
Maybe your mortgage is different from mine, I see the principal getting smaller each month and as far as I can tell the debt is being paid back slowly over time.
One thing about private debt estimates is that much of it is not really debt it is credit available. I have a lot of credit available on various credit cards, but I never pay a dime in credit card interest (balance paid in full every month).
The consumer debt numbers are pulled from the credit agencies (in the US at least) and for a consumer the numbers for credit cards are based on the highly monthly balance or the total credit limit on the credit card. For many consumers like myself who carry no credit card debt the reported “debt” is much higher than it appears and this inflates the apparent “private debt”.
As more and more people charge most of their transactions to credit cards (and get 1 to 1.5% cash back as an enticement) it appears that private debt has increased, when in reality it may not have changed (or has changed less than reported).
Dennis,
credit card is a small part of total debt
U.S. Aggregate household debt (as of March 31, 2015)
Source: NY Fed http://www.newyorkfed.org/microeconomics/hhdc.html#/2015/q1
–
Total Debt Securities in Non-Financial Corporations Sector,
Source: St.Louis Fed
https://research.stlouisfed.org/fred2/series/TDSAMRIAONCUS
Dennis,
My mortgage works just like yours, But the Federal Government debt or mortgage does not. They don’t ever pay one dime towards the principle balance. So anything spent over tax receipts gets borrowed. They issue new bonds to cover the old bonds as they mature. In other words they issue new debt to cover the old debt. Not one dime or penny ever goes towards the principle balance.
Private debt includes mortgages, auto loans, school loans, credit cards, all business loans by small an large companies alike. Anything thats debt and not on the balance sheet of Federal Government. Probably should add local government debt as well cause while local government can issue bonds they can’t print the money to buy them.
The debt held privately is multiples of what the Federal government debt is. If you take into account every country that has a central bank and fiat money and fractional reserve banking all work this way. Private debt is going to implode everywhere there is a fuel shortage.
This is the debt that central banks can never cover or buy all of it. although they will buy some of it. They already have, FED bought about $2 trillion of it in MBS. They can’t buy it all. Insufficient fuel will implode all this debt
When we get to the other side of peakoil and on down the downward slope of it. Debt will no longer be an option of payment for the vast majority of people and businesses alike.
Numbers: Lehman debt $613 billion, Greece debt $350 billion, Pimco assets gone since Gross $290 billion, PuertoRico $72 billion
Hi Sawdust,
Did that happen in the early 80s? Essentially there was a decline in output and a severe recession, but I don’t think all borrowing stopped. You are correct that government debt is just rolled over and never is intended to be repaid, the economy usually grows and makes the percentage of debt smaller, if we are truly concerned we can raise taxes or reduce government spending or a bit of both (so that both conservatives and liberals an declare victory). As fossil fuels peak it will be disruptive, we will have to build more public transport, and other types of electricity generation besides coal and natural gas. Higher fossil fuel prices will make other forms of energy competitive and we will use energy more efficiently as well, economic growth will also slow which will reduce energy demand.
None of this will go smoothly, but we will figure it out.
Dennis,
So, world economic growth has no limits? According to you, growth will slow but never stop.
The last round of high fuel prices did not make other forms of energy more competitive, it destroyed demand instead. In order to accomplish what you predict, prices would have to rise and stay high for a prolonged period of time to theoretically allow other forms of energy a chance to scale up. But if oil prices rise again, the effect would just be the same as before, demand destruction.
Your invisible hand theory makes no sense. It never has. It is an old saw that was just proven definitively wrong by real world experience. Why would it be any different the next time?
None of this will go smoothly, but we will figure it out.
How? The actual evidence
strongly suggestsproves otherwise, and so do the laws of thermodynamics. But according to you, we will somehow “figure it out”.“One thing about private debt estimates is that much of it is not really debt it is credit available.”
Hi Dennis,
And what is collateral that underlines that credit? Do majority of people have some oil wells, farms, profitable business that forms collateral for that credit? No. So that credit is just illusion. Yes maybe people have jobs with income stream but that is not collateral in real sense. That job can be gone in a second. So you only have illusion of credit and wealth.
The student debt number is one which I think is really hurting our country.
There are no assets backing that debt.
Most student loan borrowers would be unable to borrow the same amounts for any other reason. How many people in the US are able to walk into a bank and borrow money unsecured these days
Student loan debt delays household formation, purchases of auto’s and homes by recent college graduates.
Student debt does do one thing many here would appreciate. It does lower the birth rate. Family formation is delayed and family size is limited by student loan debt.
When the price of something goes up, that means that there is a surplus of demand. This surplus of demand (the need to get a degree to work) is promoted by the corporate and business culture. However, the corporate and business culture is not willing to fund the effort and so gets workers that are up against the wall from day one. These workers cannot participate in the normal functioning of the community due to time, money and energy constraints.
One thing about private debt estimates is that much of it is not really debt it is credit available. I have a lot of credit available on various credit cards, but I never pay a dime in credit card interest (balance paid in full every month).
Are you sure about that? I find it hard to believe anyone thinks I owe money because I am allowed to borrow a lot of money on my credit card. That would be like saying that my mortgage is for the value of my house rather for the amount of money I have actually borrowed.
Ron, you are probably right that a collapse is coming, but not primarily for your reasons.
And just what do you think my reasons are?
From your previous article: “The trigger has already been pulled, the methane explosion has already started, the atmosphere is getting warmer but the oceans are getting even warmer. And it will get worse, a lot worse, but it will not lead to total extinction of the human species as Guy McPherson predicts. It will be bad but not that bad.” I use collapse and catastrophe kind of interchangeably, as implied by the title of your article and then this following statement.
You concluded with this: “And anyway, there are other possible catastrophes that are likely to hit way before global warming starts to have catastrophic effects.” I cannot read your mind, so with respect to other catastrophes/collapses that you envision as “likely,” I just assumed my reason is somewhat different than yours.
Of course there are other catastrophes that will happen long before the big global warming catastrophe dramatically changes the landscape. It will be one of these that brings down civilization as we know it, not global warming.
Feta cheese and Kalamata olives – both from Greece and eaten globally.
I haven’t checked but I am ready to bet that the gross revenue of all cheeses and all olives the Greeks can export are not enough combined to pay for their oil import and motor vehicle imports.
The Greeks have been living well beyond their means for quite a while so far as I can tell. And now they want the rest of the Euro countries to allow them to CONTINUE to live beyond their means as in paying for outrageous pensions for outrageous numbers of government employees.
If it were possible for an economy to run without producing anything, for it to run by just printing money, nobody anywhere would have to work.
I fully recognize that government is absolutely necessary –
BUT I also understand that government has a tendency to grow like any other organism of the colony or tribal sort. At some point government must CEASE to grow in relation to the number of citizens that support it. Everybody can’t be a housing advocate for the poor like my old buddy back in Richmond Va who has collected well over a million , probably two million bucks in salaries and bennies for creating ZERO housing.
I on the other hand with saw and hammer and tape in hand have created at the equivalent of a dozen houses over the years – for half the money and without bennies- working a few months here and there on building new and renovating badly run down houses.
There are English professors in this country who seriously want us to put thousands of people – as many as they can graduate – on the public payroll as poets for sky daddys sake.
Nobody much except far right pundits seem to be saying so but I am convinced the Greeks simply took it for granted that the easy ride would never have to be paid for, that they could have all the ice cream and cake they wanted forever.
Of course had I been a Greek I would most likely have been on board trying to get my share while the getting was good.
“And now they want the rest of the Euro countries to allow them to CONTINUE to live beyond their means”
Of course 🙂 They are foundation of everything that Western civilization represents. You lose Greece, Western civilization lose the story, and lose the narrative. You lose mythology, you lose philosophy, and you lose identity. Once you lose identity you lose everything. Then you are nobody. So paying the Greeks is like paying the annuity that Greeks bought 3000 years ago 🙂
This whole thing is not about how much Feta cheese or Kalamata olives they can export 🙂 that discussion is just “food” for the masses to chew on.
These are tectonic shifts that are happening now that we will be more aware or understand in few years.
Ves – “You lose Greece, Western civilization lose the story, and lose the narrative.” So, we lost the Roman Empire narrative 1600 years ago, and that did not cost us much, except it did delay things quite a bit. It took 1400 years to figure out how to make cement again and also how to get it to work under water. On the other hand, if the earth is 4 billion years old, we have plenty of time. So, if it takes 1400 years to learn how to make Feta cheese or Kalamata olives somewhere else, I think that I can suck it up deal with that.
Kids in the United States hardly know who George Washington was. You are dreaming if you think that they will ever learn anything about the History of Western Civilization [my first literature class at MIT]. College graduates generally do not know who the Chief Justice of the Supreme Court is. Ask them about Plato, Socrates, Aristotle and they will probably guess that they are names of a rock band. The tectonic shift happened already. Too bad that you missed it.
For sure clueless, the achievements like “How many Big Mac’s can each of us eat” are really gona give us prosperity.
The world now has too many people, which has resulted in too many people that do not want to work.
I think the world has too many people who no one wants to hire. These days machines can do what people once did. And for the jobs where people are still very useful (e.g., childcare, elder care, care of the disabled), we don’t want to pay people much to do those jobs.
The potato bugs in the garden are in overshoot and are experiencing mass die-off.
They don’t pay rent, they eat all day long on a plant that they didn’t plant yet they feel as though that it is their right to denude every single potato plant to fill their bellies. They don’t care one teensy weensy bit if I have something to eat or not, the thankless fools. Just who in the hell do they think they are? They have a high price to pay.
I collect them in bucket and then use some gasoline to exterminate their worthless hides, the filthy swine that they are. It is extirpation plus.
The power of a gallon of gas is the most underappreciated gift to man ever.
A very menial task when you fill some gas into your tank, something that must be done to achieve the desired goal.
What a creepy story. Lure in the locals with a free lunch then grab them and drown them in petroleum products.
Better. Shake ’em out on to a tarp, take it down to the pond and toss bugs to the bass. They are always extremely grateful for the snack, and will grab a following hook instantly. Nice fish lunch- potato bug once removed.
Ah, sustainability!
as for the potatoes, grow in a big earthpot covered with semi-permeable membrane- air in, PB not.
The total poundage of potatoes seeded was about 350. Covers about a half an acre, as much and as many as I can possibly handle in a growing season. The very best potatoes on the planet, none better. The customers gladly purchase the potatoes.
The variety is the answer and the key is to grow them organically, a ‘no pesticide’ policy, no chemicals applied to any part of the plant. Besides, the pesticides really don’t work at all, just chased the bugs away and doesnt kill them. You aren’t going to win the battle nor the war.
Without a tractor and walk-behind tiller, the game is over. Without that gas, you are going to be dead in the water.
I suppose a mule would work too, but a tractor with three point hitch is far better.
I would need a coach and four to get to town.
Nothing beats oil for what it does and can do.
Drive your car for twenty miles then park it and walk back the twenty miles. You’ll be tired and hungry when you return home, you’ll need water.
The 2.80 for a gallon of gas is the better choice, an absolute bargain.
Ronald, there’s permaculture, which apparently advocates, in part, no-till, ‘vertical’ gardening (food forests) and perennial, self-perpetuating gardening.
As for the potato bug or any other kind, my guess is that if the gardening system is sufficiently diverse and mimics/echoes the surrounding natural ecosystem, that very fact may take care of the potato bugs for you (by attracting their predators for example, or other plants/animals that may repel it). Diversity is key.
And have you tried alternatives to potatoes? There are quite a few starchy tubers out there, some which may be unappealing to the potato bug. Also, it is possible that the potato bug may not like all potato kinds. I hear those in the Peruvian area know potatoes. Maybe the folks thereabouts can recommend an anti-potato-bug potato if you really must have it.
Problem with the potato bug is that it gets a toxin from the potato plant, solanin, so the critters become toxic and the birds won’t touch them.
If you grow your potatoes organically there’s very little to do. First you can do crop rotation so they cannot become permanent residents. Also you can treat the plants with several extracts to repel them, like garlic extract or stinging nettles extract, but this usually only helps before they are very established. Finally you can pick them out one by one. This is best done if you can enlist the help of a few enthusiast kids.
Good luck with your harvest.
Javier, the bug is the Colorado potato beetle. The photo is of a Jerusalem cricket.
I use a plastic broad knife with a short stick taped to the handle to make a makeshift paddle. I then take a 3 1/2 gallon plastic pail and use the paddle to sweep the bugs into the pail. The newly htached nymphs are tiny and are impossible to pick. When you sweep the potato plant leaves the bugs end up in the pail, most of them anyhow. In the end, there are thousands of potato bugs in the bucket. I know malathion will kill them dead, but then you’re spraying the potato plants, practice I refuse to use. I have used gallons of malathion to kill grain bugs as they come in from the field of barley and is binned.
If you are more conscientious, you remove the bugs from the plants and then use the toxins to kill them. I could buy malathion, but the gas is cheap and works just fine to exterminate those pesky critters.
Again, the energy in a gallon of gas does more work than you can imagine. There is no replacement and I would be in a world of hurt without an engine powering a drive train.
However, some work is just plain labor intensive, I can avoid it, but a little hard work never killed anybody. When people ask if I use insecticides on the potato plants, I can tell them no. The use of the pesticide Tempo is a big no no, Verboten and all of that nonchalant jazz.
“The coming financial apocalypse For US Shale” Coming ?? Just think of the magnitude if interest rates were closer to Normal.
“Bloomberg finds that driller’s debts increased to almost $235 billion by the end of the first quarter this year. Meanwhile, a recent S&P report says that oil and gas companies accounted for almost one third of the total global corporate debt defaults so far this year, the biggest reason being their inability to make interest payments.”
Any guess on damage ratios split out between Drillers and Producers ? At Least more producers have cash flows.
http://oilprice.com/Energy/Crude-Oil/The-Coming-Financial-Apocalypse-For-U.S.-Shale9058.html#ixzz3ebavjeVk
or
http://www.businessinsider.com/the-oil-industry-will-suffer-if-prices-stay-low-2015-6
18 trillion in debt. Interest rates are about 1%. Raise them to 3% and that’s 360 billion chopped from spending or borrowed.
Not gonna happen.
Watcher. See oil tanking today. That will knock a few billion off of PV10 I assume?
Won’t be fun, but will be interesting to see what happens if oil re-tests earlier 2015 lows.
Maybe US is headed to 10 million bopd? Would only take a couple of revisions like the one’s that have happened recently to get there.
You can get any output you want by redefining WTI, which has happened btw. And since oil is oil is oil, hmmm do you know if an API degree measurement is performed at wells or do they just intermix API 39 with API 50 in the tanker truck and count it all as “oil”.
Pretty conceivable if the truck picks up oil from one site and is not full, so it goes to the next to get topped off.
Then seperate it somewhere else.
Every tank we sell has API gravity recorded on the run ticket to the tenth.
thanx, what does the truck guy do if he has a half tank when he arrives?
Most tankers hold around 170-180 barrels.
Tankers will haul off two leases, 80-90 barrels per lease. Or just one, with 160-180 barrels off the lease.
There are also bobtails which hold about 90 barrels and generally haul off just one lease.
Gravity here ranges from 30-36 API, so mixing two leases is not a big deal.
Keep up the good fight there, Ronald.
What sort of BPG (Bugs per Gallon) do you get? I once used a whole can of Raid on one of these monsters.
For the lucky folks who have never seen one of these things, here is a potato bug:
Oops, the picture didn’t post. Oh well. Probably for the best.
Keep up the good fight there, Ronald.
What sort of BPG (Bugs per Gallon) do you get? I once used a whole can of Raid on one of these monsters.
For the lucky folks who have never seen one of these things, here is a potato bug:
https://www.youtube.com/watch?v=7YHxIlKlWfc
I couldn’t post a picture for some reason, so hopefully this video will work.
I’ve found neat petrol works as it suffocates them , or if you’re inclined and won’t set the house/forest on fire …. set light to it ….
Forbin
Looks like a cross between a brainy ant, a grasshopper on steroids and the squeezy thing on the top of my siphon tube.
That is a mole cricket, not a potato beetle.
Jim
Hi Jim.
No, you are wrong. It is not a mole cricket or a potato beetle. It is a potato bug, also known as a Jerusalem Cricket.
Potato beetles are small, related to beetles, and would never be confused with a potato bug. Mole crickets are related to crickets, locusts, and grasshoppers. They are almost as big as a potato bug, but mole crickets have wings, potato bugs don’t. Potato bugs are not related to crickets and have a very large, distinctive head. They look kind of like a grotesquely translucent, oversized ant or termite.
Jerusalem crickets, which are apparently not true crickets and not from Jerusalem, do not eat potatoes, either. The Colorado potato beetle is the one that might.
When I looked at the Jerusalem cricket, I thought ‘Weta’, and indeed they appear related.
Moving from coal to oil, 1920 style:
https://www.youtube.com/watch?v=9ZKLyf0waNs&index=5&list=PL3kG3TM8jFKjm72AkHdMHp-pDRRDnWltU
Not sure how to post without the obnoxious preview.
Watcher,
I know you’re into printing money but why stop there. And after buildings maybe you’ll be able to print a girlfriend or some new kids.
DUBAI SAYS PLANS WORLD’S FIRST 3D PRINTED OFFICE BUILDING
http://newsdaily.com/2015/06/dubai-says-plans-worlds-first-3d-printed-office-building/
“The project is a tie-up between Dubai and Winsun, a Chinese company that has been pioneering the use of 3D printers to build houses. Gergawi cited studies estimating the technique could cut building time by 50-70 percent and labor costs by 50-80 percent.”
Sorry Ron, but at least it’s not as far off topic as pulsars.
The whole 3D printing thing never really focuses on where the raw material tanks are to be stored.
Hi Doug,
Just how seriously do you take three d printing on the grand scale creating large objects such as houses?
My own personal opinion is that while 3d printing will succeed commercially near term for some things that are relatively small, of complicated shape, and expensive, for the most part it is a technology our grandchildren MIGHT be using fifty years from today when it comes to large objects needed in large numbers at a relatively low price.
If you are going to print a plastic lawn chair , you still need the plastic. I have a hard time seeing the printer working faster or cheaper than an injection molding machine which can turn out molded chairs one right after another once every couple of minutes max. It costs a hell of a lot to make a dedicated set of dies to stamp out a car fender or body shell component but once the dies are made a big press can turn out stamped sheet metal parts wham wham wham faster than you can count them- and hold to very tight dimensions to boot. Maybe a printer will be able to do as well SOMEDAY but I will bet my last dime it won’t happen anytime soon.
The number of problems that would have to be solved to print a typical house must run into the thousands. Some of them are going to be tough ones. The very first one that comes to mind is WHAT you would be feeding into the printer.
Of course my great great grand parents never thought that tractors would replace horses when they saw their first automobile.
Hell I don’t know Mac. But I just read: “12,000-square-foot 3D-printed mansion pops up in China”
http://inhabitat.com/12000-square-foot-3d-printed-mansion-pops-up-in-china/
And, apparently there is a Chinese Company that can assemble 10 3D-Printed Concrete Houses in a Day for Less Than $5,000 Each.
I’m as curious about this as you and assuming we make our annual pilgrimage to Asia this Fall and these things are anywhere near our itinerary I will attempt to actually see one. Maybe send you a brochure (via Ron) if successful.
Printing parts has a large advantage over standard techniques. It can make very complex shapes and has been shown to be able to dramatically reduce the number of parts required to make a product. For certain applications it will be the way to go. Also allows quick changes to be made when designing or custom building.
OFM
You just gotta check out the 12 minute YouTube video ‘Behrokhosh Nevis 3d house printing.
To describe both the concept and mechanics as stunning would be an understatement.
3D printers are on the way to being installed on all US Navy ships so as to be able to immediately provide spare parts as needed.
A South African contractor who severely damaged his hand developed a cyber relationship with an Aussie computer whiz. Between the two of them, they developed a process – using 3D printers – to build prostheses such as fingers and hands.
They now provide these at cost, primarily for kids whose growth necessitates continuous replacement.
While injection molding may never be surpassed for optimal, repetitive manufacturing, the world of “The Makers” (as the 3d guys refer to themselves) is apt to have profound impact, way sooner than later, IMHO.
Totally agree, fascinating clip. Mac cut and paste “Behrokhosh Nevis 3d house printing” on YouTube as suggested by coffeeguyzz.
One of the big problems with fracking has been where some of the companies have been trying to do it.
When they want to frack near populated areas, citizens fight back.
I think this may be one of the turning points in how the country sees fracking. When you’ve got established neighborhoods looking at the potential for disruption for what may be a short-lived effort on the part of oil companies, those neighborhoods may decide it isn’t worth it to let the companies come in and frack.
Oklahoma Court Rules Homeowners Can Sue Oil Companies Over Quakes – The New York Times
Not suing over fracking. Suing over waste water disposal wells.
Not suing over fracking. Suing over waste water disposal wells.
People aren’t so concerned about being able to sue over fracking. What they want to be able to do is to sue if there are damages related to fracking. The more property owners can be compensated for fracking-related property damage, the more likely the fracking industry will either avoid the damages or not go into certain areas in the first place.
But we would not need the high volume/ high pressure deep SWD wells without the high volume fracs.
This, of course, will lead to more burdensome regulation of all SWD and INJ wells, many of which have been disposing of much less volumes of water, under much less pressure, in much shallower zones, for decades, and which are already regulated by the State’s with US EPA oversight.
It will be kind of like KU being caught on basketball recruiting violations and Pittsburg State being put on probation.
This shale stuff has been the conventional producers’ worst nightmare.
We probably just need WTI to drop back down to $40 for six months to clean the shale guys out. Won’t be fun for us, but we will last longer than them. Will torpedo a lot of conventional producers too, though, who got caught with debt. Upstream MLP’s and private’s who do not have access to easy money will get drilled.
Hi Ron and Dennis,
I have just sent you two files:
– April 2015.xlsx: this files computes the latest correcting factors and estimates a first (rough) corrected data using only the RRC data published at time T and at time T-1 (this is what I was doing up to last year);
– vintage Apr2015.xlsx: here I compute the average correcting factors across all vintage datasets (this is what I have done since Jan 2015).
I have no problem to make these files open source: my idea, if the method proves robust, is to write a more efficient R code (time permitting) and then to move to more advanced method of data nowcasting (once there will be enough vintage datasets – unfortunately, the RRC does not save old vintage datasets). Of course, the latter are only future projects (probably in 2016-2017).
Regards, Dean
With respect to previous comments above concerning debt. The world needs some country that has a good economy and that runs on debt, along with a stable political system. Maybe it is not the United States, but it HAS to be some country. And, Switzerland is too small. Where do you want your 75 year old widowed mother to put her money? Into stocks? Corporate bonds? Real Estate? Gold? Silver? Hedge Funds? How about US bonds and notes? Currently [I am not saying it is right or wrong], there is perceived to be virtually no principal risk with US debt instruments. Ask Fernando how he feels about Venezuela debt instruments.
I am not saying debt is a bad thing. It is very difficult to ever own real estate assets of any kind without it. Same with operating a business.
It is the debt levels that are the problem.
Plus, US is scared to death to raise rates, in part, because US cannot afford the additional interest expense. Neither can most of the other countries’ with large amounts of debt. Nor can the consumers who presumably have sub 4% 30 year fixed mortgages, which has likely led to another asset bubble. Houses here are at all time highs, and I live in a zero population growth area.
How is the 75 year old widow doing on her $500K which is earning .5% interest? Have a friend who is a CPA. Does tax work for many clients, including many seniors who live in our area. Says they have been hammered by financial repression.
Clueless, I think you are retired? How have you coped with zero interest?
Grain prices tanked (although have spiked some recently on weather issues). However, farm real estate is holding at very high prices, due largely to zero interest rates. No other alternatives, and it does not get up and walk away (although I posted this once before and someone brought up soil erosion!)
Wonder where DOW and S & P would be if Fed funds rate was 3%?
shallow sand,
The bond market has done already the work for the FED. Long term interest rates are already up furiously over the latest weeks. Asian central banks are financing the US by investing their trade surplus into US bonds. However, it looks like they cannot do so anymore as the Asian dollar trade surplus is shrinking very fast and in some case turned into a deficit, hence the interest rise.
It’s so odd that when those lists are laid out, farmland is never really in them. Real Estate implies housing.
Farmland need not.
Solar Impulse Flight:
http://www.solarimpulse.com/leg-8-from-Nagoya-to-Hawaii
Scroll down for some interesting data.
Metallurgical coal is facing a glut and severely dropped pricing. Some Canadian mines are temporarily closing.
http://www.theglobeandmail.com/report-on-business/industry-news/energy-and-resources/teck-to-idle-six-canadian-coal-mines-in-response-to-demand-slump/article24659602/
I have not been able to find Pennsylvania anthracite coal production data for anything past 2013 but a class II railroad that hauls metallurgical anthracite out of the hills of Pa had a 23% drop in car loads for 2014.
Before buying an Electric Vehicle I wanted to research the economic and environmental costs. Firstly assuming a business-as-usual non-crash scenario.
1) EV’s are already economically viable in places where gasoline is expensive (>$6), electricity is cheap(<.05c) and government subsidies to buy the cars and run them exist.
2) In a few countries where baseload electricity is carbon-free EV's make environmental sense.
3) EV's currently have a low range(~100miles) so there are limits to how you can use them.
The development of batteries is so fast that within 10 years EV's will probably become economically viable everywhere, and will have the range to be truly useful. BUT to expand the number of cars from the thousands into the millions requires massive infrastructure changes to the grid. This is unlikely to happen fast.
The second scenario I consider is what are the likely consequences of a financial crash and the lengthy depression afterwards on EV ownership. I already stated in an earlier thread that I think the grid will stay on. I think EV's will become more valuable. A further point to consider is that it may be better to spend cash now on useful hard assets, because it is unknown what the value of any financial asset will be after a crash.
This line of thinking about the pros and cons of ownership does not seem to be the common one if this advert is anything to go by. https://www.youtube.com/watch?v=ZYWHsOeDf3M
Shale Drillers’ Safety Net Is Vanishing
“The insurance that producers bought before the collapse in oil — much of which guaranteed minimum prices of $90 a barrel or more — is expiring. As they do, investors are left to wonder how these companies will make up the $3.7 billion the hedges earned them in the first quarter after crude sunk below $60 from a peak of $107 in mid-2014.
“A year ago, you could hedge at $85 to $90, and now it’s in the low $60s,” said Chris Lang, a senior vice president with Asset Risk Management, a hedging adviser for more than 100 exploration and production companies. “Next year it’s really going to come to a head.”
http://www.bloomberg.com/news/articles/2015-07-01/shale-driller-losing-their-insurance-against-price-drops
Where’s Javier? I want to respond to his reply to me in the last thread.
Javier, you said: “So now you have the problem of matching an accelerating sea level raise with a decelerating global temperature average. Bad position.”
You’re wrong here, since there has been no statistically significant slowing in the last 15 years or so. As the recent NOAA paper, and plenty of other groups, have shown. There’s a lovely summary on realclimate: ( http://www.realclimate.org/index.php/archives/2014/12/recent-global-warming-trends-significant-or-paused-or-what/ ). For someone with a PhD I must say that you have a remarkably poor grap of statistics. Though I suspect this only occurs when understanding the statistics correctly leads to an outcome which contrasts with your worldview.
Then you said “On the other hand you could simply accept that if your data shows some sinusoidal variability in order to extract a meaningful trend your period of analysis has to necessarily expand longer than a period and ideally at least two periods.”
Which leads me to assume that you’ve never studied signal analysis in any meaningful way. However I guess I’d direct you to the paper “Timescales for detecting a significant acceleration in sea level rise” by Haigh et al, in which they conclude “Considering all this, there is substantial evidence, in both GMSL data sets and coastal averaged sea level time series (corrected for internal variability), for the existence and significance of a sustained increase in the rate of sea level rise over the 20th century and early part of the 21st century. In addition, the magnitude of the acceleration currently being observed is consistent with the latest understanding of sea level budgets and since about 1990 cannot be explained solely as part of internal variability.” Of course if you look at reconstructions over the last few thousand years, such as the one created by Kemp et al ( http://www.realclimate.org/images//Kemp_sealevel_20111.png ) then your argument is very obviously blown out of the water. As much as anything, we should expect sea level rise to accelerate as the planet warms, certainly that is what the physics suggests is going to happen, especially if some of the more pessimistic glaciologists turn out to be right about the nonlinear response to the forcings.
Finally, Javier, the reason I didn’t use much science is becuase I know there’s no point. I know nothing I’ve posted above will have changed your mind. If the data was going to convince you then it already would have, but you are reasoning based on something other than data and science, and you’re probably well described by the work of Kahan ( http://www.nature.com/nclimate/journal/v2/n10/full/nclimate1547.html ). You’re like one of those commited anti-vaccine activists, or whatever. This is why I prefer to ridicule you than to educate you, because I find it more enjoyable and it’s exactly as productive.
BNSF week 25
9,312 petroleum cars shipped, week 25 of 2014 had 11,441 petroleum cars shipped.
A drop of 2,129 petroleum cars.
BRKa has lost something like 22,000 dollars per share lately, Berkshire Hathaway stock is down to 206,000 dollars per share.
Average shares traded per day is 216.
R=L x p
Good article by John Kemp
Oil prices settle into new equilibrium: Kemp
Jul 1, 2015
http://www.reuters.com/article/2015/07/02/us-oil-prices-kemp-idUSKCN0PC03W20150702
Benchmark crude oil prices have barely moved for more than two months, implying the market has found a temporary equilibrium after the enormous price shock in the second half of 2014 and early 2015.
Over the last 30 trading days, the range between the highest and lowest closing prices for front-month Brent futures has been just $4.50 per barrel.
The trading range is the smallest since the shock began in June 2014, and down from a peak of almost $40 per barrel in early January 2015.
In dollars per barrel, the range has been narrow by the standard of the last decade.
The price stabilization implies the market believes $60-65 per barrel will gradually bring supply and demand back into balance, which seems sensible.
The low variability in prices is also helping anchor short- and medium-term expectations for producers and consumers at around the current level.
Expectations are not always correct but price convergence within a fairly narrow range makes it easier for producers and consumers to formulate budgets for the rest of 2015 and 2016.
Large shifts confound old assumptions about costs and revenues and make it hard to form new ones with confidence.
The huge price shifts in the second half of 2014 and the first three months of 2015 made detailed planning almost impossible for oil producers (and, to a lesser extent, consumers).
But the recent stabilization of prices at $60-65 per barrel makes it far easier to produce some planning assumptions with appropriate scenarios around that level.
The market has discovered a new short- to medium-term trading range.
Prices below $50 are unsustainably low because they cause too much production to be lost and strong growth in demand.
Prices much above $70 or $75 would be likely to prompt widespread reactivation of shale drilling and possibly curb fuel demand.
Producers and consumers will therefore probably end up employing a baseline forecast of around $60-65 for the rest of 2015 and into 2016, with a low-price scenario of $50 and a high one of $75, which is good enough for most planning purposes.