The North Dakota Industrial Commission is out with the April production Data for the Bakken and all North Dakota.
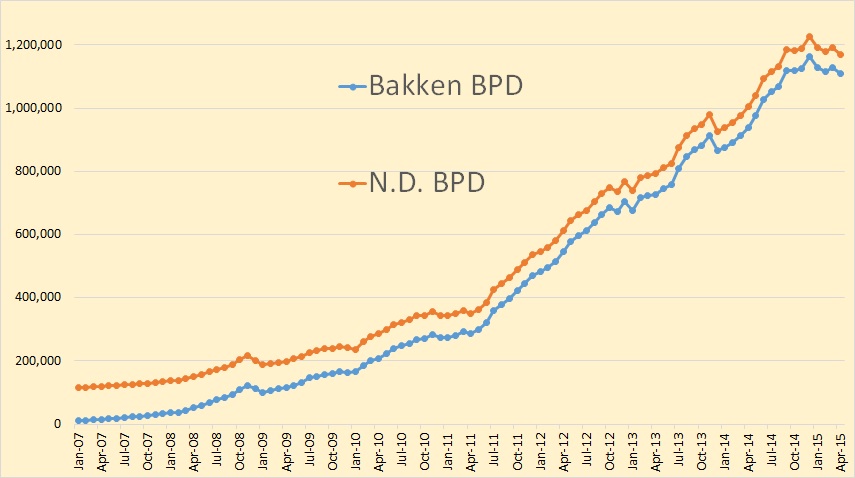
Eight month of flat to down production from the Bakken.

I have shortened the data to 16 months here to give a better picture of what is really happening. North Dakota reached an 8 month low. North Dakota, in April, was 17,631 barrels per day below their September 2014 production. The Bakken was only 11,024 below September 2014 so conventional wells seem to be dropping off pretty fast.
The Baken is 54,599 bpd below their peak in December and all North Dakota is 59,385 bpd below their December Peak.
As usual there was very little adjustments in the previous months data. Bakken March production was adjusted down by 114 barrels per day while North Dakota production was adjusted down by 81 barrels per day.
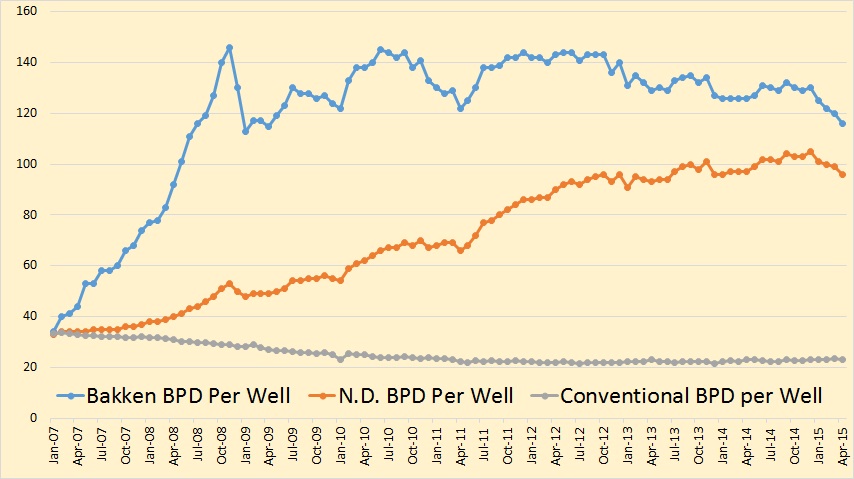
Bakken BPD per well has been dropping for four months now. Bakken bpd per well now stands at 116, down 4 from March. All North Dakota bpd per well is now 96, down 3 while conventional wells bpd per well is 23, down 1 from March.
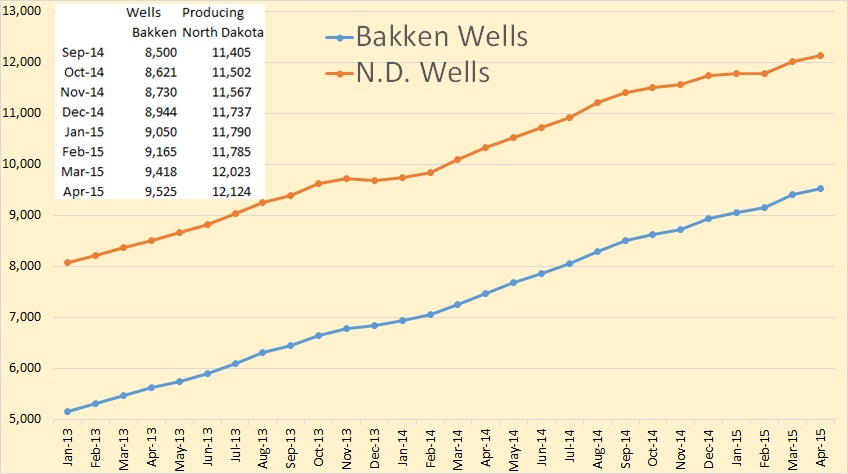
Bakken wells producing increased by 107 while North Dakota wells producing increased by 101.
The North Dakota rig count now stands at 75, down 7 since Wednesday.
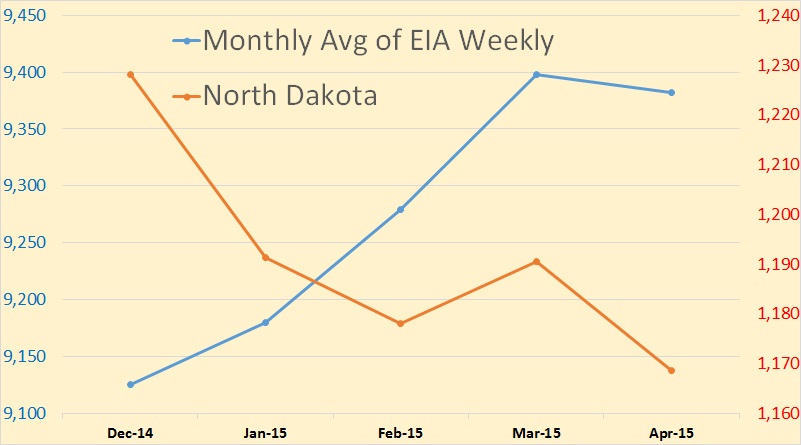
The EIA’s weekly C+C production has been increasing. It is way up in May and June but since the North Dakota production only goes through April, I have limited the above chart to a monthly average of weekly production through April. From December to April, the monthly average of the EIA’s weekly production was up 256,000 bpd while North Dakota production was down 59,000 bpd. That means that from December to April, US production, less North Dakota, had to be up 315,000 bpd.
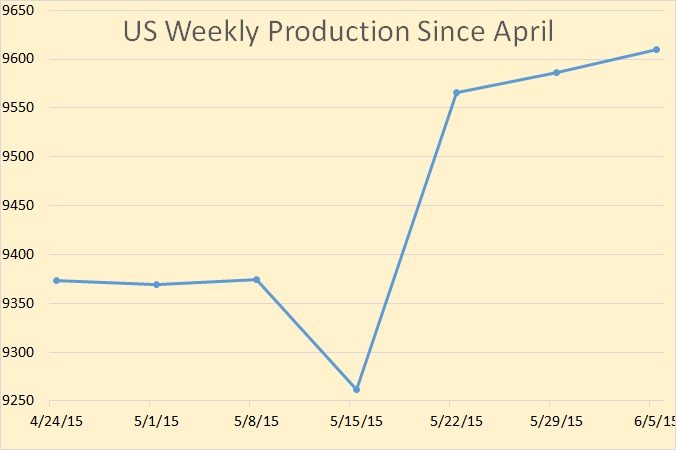
And need I remind you of what has happened to US production since April. The EIA weekly crew has US production up another 237,000 bpd to 9,610,000 barrels per day.
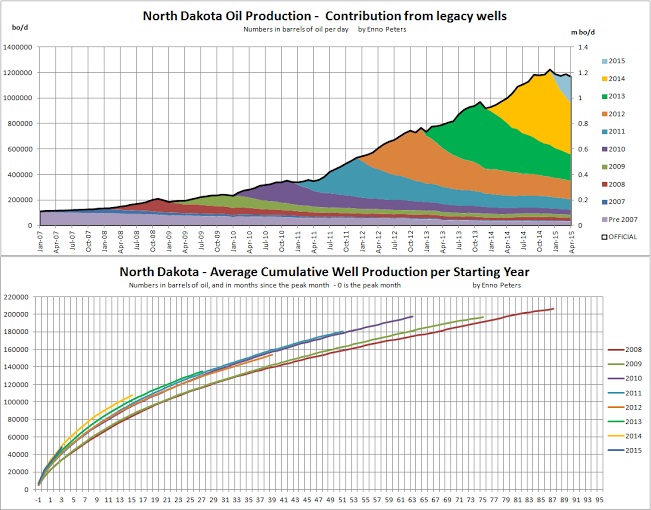
Enno Peters posted the above charts.
Also from Enno’s data I counted 153 new wells that went on line in April, or 5.1 wells per day. That compares to 188 that went on line in March or 6.06 per day. Those 188 new wells brought production up 12,371 bpd while those 153 wells saw a decline of 21,866 bpd. So according to my calculations it would have taken about 175 new wells to have kept production flat. That’s a few more than I would have thought.
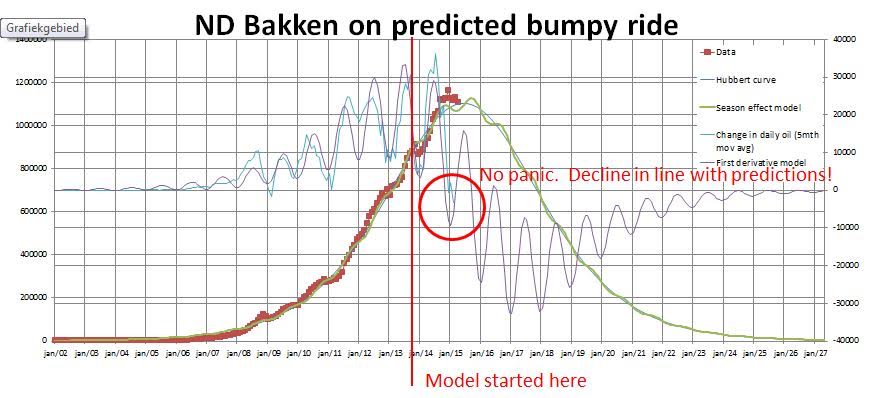
And Verwimp sends his Bakken prediction above.
There was no Director’s Cut Friday due to Lynn Helms’ scheduling problems. I will post excerpts from that report Monday, or whenever it comes out, either here or in a new post if I have one.
The Baker Hughes Rig Count is out. Apparently their data dates from about Wednesday, or early Thursday. It shows Williston and North Dakota with no change and they are down 7. Remember Baker Hughes does not count rigs that are MIRU, or Moving In Rigging Up.
Anyway oil rigs are down 7, Directional down 1, Horizontal down 10 and Vertical up 2.
The only thing Mr. Helms needs to do is admit that Verwimp wasn’t that wrong after all… 😉
An additional factor contributing to lower production in North Dakota is stricter regulations on gas flaring
North Dakota ordered five firms to reduce April oil production
06/12/2015
http://www.ogj.com/articles/uogr/print/volume-3/issue-3/north-dakota-ordered-five-firms-to-reduce-april-oil-production.html
North Dakota oil and gas regulators ordered five companies to reduce their April oil production to 100 b/d on certain wells or face potential daily penalties for violating the North Dakota Industrial Commission enforcement policy on gas flaring.
NDIC’s 100-b/d restriction applies to companies not capturing at least 77% of associated gas from an oil well. The restriction was imposed for 1 month pending a review of monthly production reports from the companies.
North Dakota Oil & Gas Division spokeswoman Alison Ritter said five companies was the highest number to be placed under restriction at once since North Dakota’s flaring order took effect Jan. 1.
The companies were Emerald Oil Inc. of Denver with 10 wells restricted, OXY USA Inc. with nine wells restricted, QEP Resources Inc. of Denver with six wells restricted, Abraxas Petroleum Corp. of San Antonio with three wells restricted, and Enerplus Corp. of Calgary with two wells restricted.
State officials also restricted production for some companies during January, February, and March, but Emerald Oil was the only company to face restrictions every month through April.
Enerplus was restricted for two wells in February, and Whiting Petroleum Corp. was restricted for three wells in February.
Separately, XTO Energy has asked North Dakota energy state regulators for an exception to the percentage of gas that can be burned off at 140 of its wells in Dunn and McKenzie counties.
A subsidiary of ExxonMobil Corp., XTO executives said they had nowhere to take the associated gas for processing. They asked for exceptions to the North Dakota flaring regulation until late 2016 when a proposed Bear Creek gas-processing plant in Dunn County is scheduled to become operational.
As of January, XTO flared 38% of its gas and sold the rest to Oneok Partners LP, Tulsa, and other gas-processing companies. XTO reduced its oil and gas production during February and March to comply, saying it also has delayed bringing wells onstream and is deploying gas-capture units.
If they have nowhere to take their gas they should choke back production to whatever rate meets their gas handling and marketing capacity. North Dakota regulatory authorities lack environmental common sense.
Fernando
Many operators have been doing just that as the detailed, monthly production numbers clearly show. There have been dramatic dropoffs in both the total output as well as number of days wells have been producing during the month starting around November.
XTO is somewhat unique in that a dispute has prevented a relatively short pipeline from being built across tribal land.
Coffee,
Indeed it looks as if there is a small drop in average number of days that wells have been operating recently, although it is not unprecedented, and only explains part of the drop. Below graph is based on all individually reported wells in ND (>10.000). I compared the number of days that a well was producing, divided by the number of days in the month, for all wells that had production and were not confidential.
Hoy short is short? I’ve had problems like that and had the line laid using a zig zagging right of way. It seems to have worked, because afterwards we didn’t have land owners getting into really tough negotiating stances.
Fernando
As per an article in the Bismarck Tribune, dated April 21, 2015, the Three Affiliated Tribes turned down a $10 million per mile easement fee on a pipeline less than two miles long crossing tribal lands.
BTW Fernando, seems some guys beat you to the punch by using heat from produced water to generate electricity.
Story from Star Phoenix paper, dated June 12, 2015 describes 250kwh generated by two small turbines on a pad run by Continental.
Gotta hustle faster with your ides, Fern.
ExxonMobil should have lined up the pipeline row at the same time they obtained the pad construction permits. This is a simple housecleaning issue. As far as I’m concerned they can shut in the wells or truck the gas using high pressure systems.
Try reading this about real geothermal
http://www.geothermal-energy-journal.com/content/1/1/4
There is a visible correlation between the change in Bakken oil production and the increase in the number of new wells. In most cases, production declined when the number of new Bakken wells increased less than 125 per months
What you are counting is “wells producing”. That number counts the new wells that came on line during the month then adds the shut in wells that were brought back on line and then subtracts the number of old wells that were shut down during that month. The number of new wells that came on line in April was actually 153 compare to 188 that came on line in March. Shut in wells brought back on line minus old wells taken off line changed those numbers to 101 in April and 238 in March.
But the numbers that really made a difference are 188 in March and 153 in April.
Ron, I am not sure that the number of well completions is more important than the change in wells producing.
1/ Read the Disclaimer in the Director’s Cut, which says: “The number of completions is an estimate on the part of the director based on idle well count and a typical five year average. Neither the State of North Dakota, nor any agency officer, or employee of the State of North Dakota warrants the accuracy or reliability of this product and shall not be held responsible for any losses caused by this product. Portions of the information may be incorrect or out of date. Any person or entity that relies on any information obtained from this product does so at his or her own risk”
2/ There are huge fluctuations in stated number of well completions that are difficult to explain. That probably proves that this number may not be accurate.
3/ The number of shut-in wells or wells brought back on line could be large during some months, and some of those wells could be relatively new with high production rates.
4/ The number of well completions refers to total N. Dakota wells, although I admit this is not particularly important, given than 99% of drilling activity is in the Bakken region.
4/ From Director’s Cut (May 2015): “To maintain production near 1.2 million barrels per day, 110-120 completions must be made per month.” This statement better corresponds with what I said in my previous post, than with their own numbers on well completions.
5/ Looking in the table below, could someone say that the number of wells completions is better correlated with the changes in production than changes in the Bakken producing wells?
(P.S. just for information: the table shows a rapid decrease in the number of producing conventional wells)
Wells statistics and oil production in North Dakota and N.D. Bakken
Hi AlexS,
Ron has access to Enno’s database and that gives the number of new wells which started producing each month. I have not confirmed Ron’s data but I think he pulled it from Enno’s data which is based on NDIC reports. Perhaps Ron or Enno could confirm. The completion number is the most important figure in my opinion, though I would defer to Ron and Enno’s judgment.
Hi Dennis,
The number of well completions by month can be found in the Directors’s Cut (see my table). Other data is from NDIC reports.
A detailed database obviously could show a real picture, especially if there is data on these new wells combined production during a given month, declines in old wells, and change in volumes due to wells shut in and wells brought back on line.
The timing of well completions is also very important, as if, for example, most of new wells were completed in the end of the month, they contribute little to production in this month. So, a detailed breakdown of factors contributing to changes in production would be very helpful. Otherways, with the data published by NDIC, we are seeing some very strange numbers, like 145 wells completed in October with production down 1kbd, and 48 wells completed in November with production up 6kbd.
Also, the disclaimer in the Director’s cut make me suspicious about their data on well completions.
Hi AlexS,
The completion information in the director’s cut is not very good.
Yes, I got my numbers from Enno’s data. I just counted the wells that came on line.
The Director’s Cut numbers are not reliable. They often do not match the actual count from the field.
I am unsure about those “wells producing” numbers. If a lot of non producing wells were shut down, why would that matter? On the other hand if wells were shut in for maintenance, then that would matter. Though if they had been producing for a couple of years then their production numbers would not be that great.
If 153 wells were completed I think they would pretty well average out over the whole month. I think it would be very unlikely that they would be bunched up toward the end of the month.
But in the final analysis, production was way down and that is the important thing.
Ron,
Are your numbers of wells completed significantly defferent from Director’s cut numbers.
If so, I’m just wondering why, given that the database is based on NDIC numbers.
Alex, I have no idea why. Helms obviously has access to the NDIC data, why he does not just count the wells is beyond me. But sometimes his numbers are radically different. Perhaps he is counting something else?
I was also wondering about this. Maybe an oil guy can explain why the completion date is not always the date that first production starts.
Is he emailable?
Maybe they are missing production equipment? I seldom see the completion date match first oil. But I guess that depends on the well and local rules.
Ron, Enno, thanks
Maybe indeed there is some time lag between well completion and the start of production
Alex, Enno
The lag between completion time and production may be prompted by a number of factors, particularly logistics.
The current online issue of American Oil and Gas Reporter (aogr.com) has an informative, wonky article on facility design that addresses the daunting challenges that operators face capturing and processing associated gas with high decline rate shale wells. The final section, titled Operational Flexibility, nails the topic in summary fashion.
An additional example of logistics constraining production post completion was just displayed by Rex Energy in Butler county, PA.
After simultaneously drilling four wells from the same pad, two were completed, tested, and evaluated. One, targeting the Upper Devonian, was surprisingly more prolifific than the other completed well which targeted the Marcellus.
No production will occur from any of these wells until takeaway capacity is in place, and that is several months off.
Ron,
Excellent update. I gather a 60% decline in oil drilling rigs doesn’t really matter after all. Maybe the drilling industry can pack up and go home as U.S. production takes out 10 mbd. Hilarious dichotomy between EIA weekly figures and the EIA DPR folks.
Anyhow… look at the whopping decline rate at the MIGHTY MARCELLUS. Looks like the first month the Marcellus will actually show a net decline. Is this the Peak of the Mighty Marcellus??
steve
Sorry for those folks who have trouble reading. That’s as large of a graph as I could make.
steve
So, the EIA is saying that–in order to maintain about 16 BCF/day of production from the Marcellus–operators in the play need to put on about 8 BCF/day of new production per year?
To put 8 BCF/day in perspective, the EIA shows that federal Gulf of Mexico marketed natural gas production in 2014 was 3.4 BCF/day.
Mr. SRSrocco
I suppose you are aware there are, at this moment, over 2,300 wells in the Pennsylvania Marcellus alone that are drilled and awaiting takeaway pipelines?
As of last month’s reporting, there are 6,529 producing horizontal wells in the PA Marcellus.
Gerard, as always I am appreciative of your passion for shale oil and shale gas, however economically unfounded that may be. Forgive me but it is clear to me that you and the shale oil and shale gas industry that you re…(sorry), the shale oil and shale gas industry, can’t get past the fact that it cannot make money, regardless of big IP’s, coiled tubing conveyed slick water frac’s and lack of take away capacity. There is no take away capacity in the Marcellus because there is no place to take it. There have been a dozen grandiose plans for take away capacity out of the Bakken that never got legs because of decline rates, so goes the Marcellus.
Technology can no longer save the day, mate. The shale industry cannot sho America the money. It can’t pay its debt. It can’t stand on its own two feet.
I hope you are well.
Mike
Mike I generally read you wall to wall and tree top tall good buddy.
But who is this Gerard?
Mike, OFM
Gerard c’est moi, monsieur.
Mike, I just composed a thousand word response to you, aaannnnd it’s gone! Won’t re-write, but I want you to know I, as do many others, greatly appreciate your posts, as well as the hard work you do and have done these many years.
The Marcellus/Utica output will be shipped on the 35Bcfd capacity that is planned to be built within the decade. (RBN has numerous articles on their site about these pipelines.)
The three ethane crackers – total cost over $10 billion – may or may not get built, but the plans are in the early stages to construct them.
The businesses in eastern Massachusetts are relegated to emplacing underground propane tanks for future heating needs. Minimum three year wait for new gas customer hookups.
The Bakken pipelines will carry several hundred thou barrels/day to Clearbrook by 2017/18.
The hydrocarbons exist, are technically recoverable, and – should economics allow – will be produced.
Looking forward to your future contributions to this site.
Gerard
Coffee ,I presume you are acquainted with THE Gerard the Fox of eternal fame.
You and Mike are in good company and worthy companions.
Those who have not yet been immunized by experience when it comes to fools and their money -and their wives, etc- will be doing themselves a BIG favor if they read the life of Gerard.
OFM
Thanks. Should I ever encounter a rowdy robot in some saloon some Saturday nite, I would be much obliged to have Mr. Roughneck or someone similar, back to back taking on ol’ R2D2 and friends.
And I would have your back, sir.
OFM, thank you for the compliment. Gerard is Coffee, an old oilfield hand, a diver. Big huevos, those guys; not quite as big as us well control guys, but almost.
Mike
Merci, mon ami, Gerard; et vos contributions ainsi.
I agree the hydrocarbons exist and can technically be recovered. I agree also in a perfect world that technology can improve the recovery, and economics of shale oil and shale gas. I envision a perfect world being 120 dollar WTI oil and 8.00 HH gas. But nothing in life is perfect and the one thing predictable about life is that it cannot be predicted.
For all the rhetoric about the future of LTO and shale gas in our country, for all the graphs, charts, models, discussions about production reporting, robots, multi well pads, frac stages, exporting LNG, Bakken this and Eagle Ford that, to me it all boils down to one simple thing: economics. Shallow gets it, and a few others. None of this will work for the benefit our long term energy needs unless…it makes money. It’s not rocket science. This from an old hand who has drilled hundreds of wells in a half century; its gotta make money or your pissin’ in the wind.
This shale stuff is not profitable. If you owe money, you ain’t making a profit. Pay it back, then I’ll be impressed. Until then I am grateful, as should all Americans be, for the grease, providing we don’t have to pay off the shale industry’s debt someday.
2,300 Marcellus wells sitting up there shut in with no take away capacity is way over a billion dollars of spent capital at a dead stop, with only the interest meter running. Sorry, that’s stupid.
Mike
Mike, I have a brother who is a petroleum engineer. He has a client company active in the Marcellus that is selling its gas for 25 cents/mcf.
I won’t mention the client company’s name but it is not one of the companies named up thread. They are one of the more active companies in the Haynesville.
At 25 cents/mcf. I am not sure they can pay the light bill.
John S./Mike
The two biggest factors in 25¢ natgas are:
The above chart re Marcellus’ output shows under 2Bcfd at the 2010 hash mark. The 2015 hash mark is over 16Bcfd. That’s a lot of marshmallow roasting in five years time.
Second factor is the imperative to get retention wells on already-leased land. The fact that the areal extent of the Marcellus dwarfs both the Bakken and Eagle Ford combined (over 30,000 sq miles in PA are permitted for drilling) has led to the incredible oversupply situation at present. The inadequacy of takeaway capacity has greatly exacerbated the situation.
As it is, several of the big outfits there have about 25% of their leased land with no production, and risk losing their hold on that acreage.
Mike
You are 100% correct in the view that, absent economic justification, shale development does not make sense.
Thought experiment … if I told you last June that one of the biggest oil producers in the world would launch a war on its neighbor, fail in attempts to bribe Egypt and Pakistan to send invasion troops to augment their own air campaign, suffer counter incursions losing both military personnel as well as bases (the Saudi head of their air force was killed last week … ‘heart attack’ supposedly), be hit by a scud missile with the accompanying threats of the entire KSA territory subject to extensive missile attacks … and all the while the price of oil semi shrugs these events off … if I were to describe the above scenario to you last June, Mike, you would understandably think I’m nuts.
And yet it is happening.
All the while, the king is dead and an epochal succession struggle is unfolding.
The inlet and outlet channels in Hormuz are still one mile wide each way.
Mike, we may see triple digit WTI sooner than later and be grateful that the hydrocarbons are available.
My memory is not what it once was. I was thinking about Reynard of literary fame- my book of stories being translated from the French makes it a bit more understandable.
Reynard continually fools the shit out of just about everybody. These tight oil operators may have studied up on his legendary trickery.
From wikipedia :
Reynard (French: Renart; German: Reineke; Dutch: Reinaert) is the main character in a literary cycle of allegorical French, Dutch, English, and German fables. Those stories are largely concerned with Reynard, an anthropomorphic red fox and trickster figure. His adventures usually involve his deceiving other anthropomorphic animals for his own advantage, revenge, or pure malice, or trying to avoid retaliations from them. ”
Reynard would be right at home in the tight oil patch.
coffee. Who are the big players in the Marcellus? Range and Cabot are. Rex Energy is a smaller player, as is Magnum Hunter. Any others besides integrated majors?
Shallow
I just tried to retrieve the top five producers in 1stQ2015, can’t find it … but I am certain that a virtual unknown, Antero, surpassed Range for the number one spot. Chesapeake is still reeling from McLendon’s reign, but they were the biggest for awhile. Cabot has spectacular operational as well as production results. EQT has been around since the 1800s and is ramping up steadily. Seneca and Console are big players.
Magnum is similar to your neighbors, Sandridge, in being bokoo shaky money-wise. Rice is a tiny outfit that is targeting the Utica and has a half dozen monster wells producing 14/20MMcfd on restricted chokes. Its first one has been online a year now and has produced about 5 1/2Bcfe (close to one million boe).
I’m still pretty ignorant of these plays, but a couple of sites, esp marcellusgas.org, have a ton of current, granular-level data.
Shallow
I just tried to retrieve the top five producers in 1stQ2015, can’t find it … but I am certain that a virtual unknown, Antero, surpassed Range for the number one spot. Chesapeake is still reeling from McLendon’s reign, but they were the biggest for awhile. Cabot has spectacular operational as well as production results. EQT has been around since the 1800s and is ramping up steadily. Seneca and Console are big players. Rice is a tiny outfit that is targeting the Utica and has a half dozen monster wells producing 14/20MMcfd on restricted chokes. Its first one has been online a year now and has produced about 51/2Bcfe (close to one million boe).
I’m still pretty ignorant of these plays, but a couple of sites, esp marcellusgas.org, have a ton of current, granular-level data.
coffee. I looked at Antero and Range websites. Both have cut CAPEX quite a bit. Antero production in Q1 will be the highest for the year, it is expected to fall as they cut down significantly on drilling and completions, including deferring 60+ to 2016. I think Range is too, but they talk more about year over year, so tough to tell.
Antero has over $4 billion of debt. Range just floated a $750 million bond issuance to pay off their line of credit. Both were very cash flow negative in Q1. Both have a large amount of 2015 production hedged at much higher prices, unlike a lot of the shale oil guys.
There are some huge wells noted, and they both have large acreage positions.
I wouldn’t say they are in trouble yet, but it doesn’t look like their business plans work with sub $2.00 natural gas any more than the shale oil guys work with sub $60 WTI.
My uneducated guess is that they have found a better resource than US oil weighted shale, but are looking at even more depressed prices. Just like oil, wells are not cheap and costs, though coming down, are high.
Wouldn’t surprise me if production falls in Marcellus and slows in Utica. Prices are too low.
The Marcellus has been pipeline restrained for a long time. This is demonstrated by the fact that Marcellus gas has been trading at deep discounts to Henry Hub. It appears as though the Marcellus is reaching a plateau, but currently it is hard to tell if this is due takeaway capacity restraint, the ability for the formation to produce, or for the gas to be produced at a sustainable profit.
In the next month or so, the REX pipeline, Rocky Express, Zone 3 will be reversed. Taking 1.2bcf of gas from the Marcellus to the Chicago market. If the Marcellus has peaked, then we should see a narrowing of the spread between, Marcellus local price and Henry Hub. If the area is just pipeline restrained, we should see and increase in volume.
we shouldn’t have long to wait to find out.
http://www.downstreamtoday.com/news/article.aspx?a_id=47955
Rockies Express Zone 3 East-to-West In Service Date Pushed into Q3
Tallgrass Energy has confirmed that the highly anticipated Rockies Express (REX) Zone 3 East-to-West project has been delayed and will not be completed until July 2015 or later in Q3 2015. The project is set to provide an additional 1,200 MMcf/d of firm transportation service, which has been fully contracted. Once complete, Zone 3 on REX will be able to flow 1,800 MMcf/d bi-directionally between the Clarington Hub and the Moultrie interconnect with NGPL, 600 MMcf/d of which is currently being served by the Seneca Lateral. As of June 1, 2015, East-to-West flows reside around 1,060 MMcf/d.
This reversal will allow Appalachian gas to reach Midwestern markets via interconnects with NGPL, ANR, Midwestern GT, Panhandle, and Trunkline. The aggregate design capacity for these delivery interconnects will essentially double from 1,572 MMcf/d to 3,102 MMcf/d. The Moultrie interconnect with NGPL makes up the bulk of the incremental capacity by adding 1,135 MMcf/d.
In either case, depletion marches on.
Based on the EIA estimates, in order to maintain current production, operators in the Marcellus have to put on line the productive equivalent of Mexico’s 2013 dry natural gas production–roughly every six months–or all of Canada’s dry natural gas production every 20 months.
Or, if we combine the two, in order to maintain current Marcellus gas production, operators in the play have to put on line the productive equivalent of all North American dry natural gas production, excluding the US, every 27 months or so.
Or another way to put it. The EIA is estimating that the Marcellus is currently losing about 3 TCF/year from existing wells. Based on my rough count, the EIA shows measurable dry gas production for about 96 countries worldwide. The estimated current annual volumetric loss of production in the Marcellus exceeds the 2013 gas production of all but eight countries worldwide. For example, 2013 UK dry gas production was 1.4 TCF/year.
Of course, the volumetric decline from existing wells would fall with time, but I am stipulating a “What if” steady state scenario, i.e., how fast does the Red Queen have to run just to stay in place?
Copy of my comment on US decline rates on prior thread:
If we stipulate a steady state US production rate, a 20%/year gross decline rate would require the US to approximately put on line the productive equivalent of current Saudi C+C production roughly every five years, just to maintain current US C+C production for five years.
As I have previously mentioned, according to the EIA the observed rate of decline in Louisiana’s annual marketed natural gas production from 2012 to 2014 was 20%/year (falling from 8.1 BCF/day in 2012 to 5.4 BCF/day in 2014). This would be the net change in production, after new wells were added. The gross decline rate (from existing wells in 2012 and 2013) would be even higher. Citi Research put the overall gross decline rate from existing production at about 24%/year.
The EIA put US dry natural gas production at 70 BCF/day in 2014 (25.7 TCF/year). At a 24%/year gross decline rate*, in order to maintain current US dry gas production, the US has to put on line the productive equivalent of total Middle East 2013 dry natural gas production (23 TCF) over the next four years (again assuming a steady state production rate, so that we would be declining against a constant production level).
*At 24%/year, we need about 17 BCF/day or about 6 TCF/year of new dry gas production, just to maintain current US dry gas production; or in other words, we would approximately need the productive equivalent of a new Marcellus Play every single year.
Using an estimate of about 6 TCF/year for the gross decline from existing US gas production, this volumetric loss of production from existing wells would exceed the annual production for every country in the world, except for the US and Russia.
Mr. Brown
I just wrote a reply to your post and it disappeared. (Black holes do exist, mebbe?)
Gist of my reply concerned the seldom mentioned Utica dry gas.
The Penn State University website, Marcellus Outreach’ has some new, informative maps of both Utica and Marcellus formations.
Takeaway is that the Utica is MUCH larger than the Marcellus.
The wells by Shell in Tioga county, located 400 miles northeast of the WV monster Utica wells indicate the vast expanse of this resource.
The 43MMcf IP that Range just announced as the highest Marcellus IP to date is only a few miles from the Utica’s 59MMcf IP.
As many as 51 gas wells have been drilled on 5 acre pads (Encana in 2011 in the Piceance).
Production from this area is just beginning and is apt to be long lived.
I found it’s a good idea to write a long comment in word processing, and then copy and paste.
In any case, based on the foregoing, it seems likely that in order to just to maintain current US production, in round numbers US operators have to put on line virtually the combined productive equivalent of 2013 dry gas production from Canada + Mexico–every single year.
Incidentally, circa 2011 the EIA estimated that Poland had the largest technically recoverable shale gas reserves in Europe. As noted on another thread, one little problem has arisen: there have reportedly so far been no commercial shale gas wells completed in Poland, and most international companies seem to be headed for the exits as fast as they can leave.
Are the Marcellus decline curves hyperbolic? Or are the wells too young to tell for sure?
Fernando
Hyperbolic, parabolic, anabolic, anorexic … I’m not well versed in technical, mathematical terms.
Average Marcellus wells produce at about 20% initial production at the three year mark.
Laterals are definitely getting longer, more stages/proppant just like the oil guys.
Coffee, they are hyperbolic. This means the decline rate drops continuously. This leads to lower decline rates as wells age, which means that it requires less new wells to make up for the decline. If I know nothing else I assume a large number of wells will have a 10 % decline rate after 5 years. But this depends on well spacing and well design.
coffeguyzz,
Due to the high decline rates of shale, transportation cost are up to 10 times higher than for conventional gas as the invested money has to be depreciated over a few years, which is in stark contrast to conventional gas transportation depreciated for decades. This is the reason for unconnected wells. Much higher gas prices are needed that companies can afford the high transportation cost. Transportation is a major weak point for shale gas.
That problem can be worked around by sequencing well. There are infinite solutions. For example: Bakken and three forks wells can be drilled from 12 well pads. The pads are located relatively close to each other. So it’s easy to work out a profile whereby the wells are drilled and completed on a schedule which allows production to be carried by a single flowline for a pad, which in turn feeds to an adjoining pad. Flowline costs are fairly insensitive to flowline diameter, and the full production can be gathered.
What we see in North Dakota is only the result of very lax state regulations and industry participants who seemed to lack the will to get their act together.
Mr. Leopold
I do not follow your statement on several accounts …
The six and a half thousand producing PA horizontals (out of the 9,000 drilled) are operating on slightly more than 4,000 pads.
Therefore, most production comes from solitary wells.
The gathering lines connecting these wells continue to feed into larger pipelines until ultimately reaching the high pressure, high volume takeaways. These larger pipelines pipelines are being planned/built by the industry’s heavyweights who rely on firm, legally binding commitments from suppliers.
EQT has permitted a pad for 27 wells. As at least three productive zones exist in much of western Pennsylvania – the Marcellus, the Utica, and the smaller, shallower Upper Devonian – operators will have significant opportunity to economically maximize output as the near-million-dollar pads are already operational.
To compare transportation cost from a well from a conventional gas formation with a single shale gas well would certainly be grossly disadvantageous to the latter. However, when there are hundreds of wells on dozens of pads sequentially producing (as per Fern’s observation), the ‘Energy Corridor’ approach as is used in the Bakken – or something similar – will become the relatively inexpensive norm.
coffeeguyzz,
Thanks for your reply. As always it is more complicated as it looks at first sight. It could be also that pipline operators want to look first where the supply is and then decide on a pipline strategy. In my view one of the most supply restraint comes from the drop of futures beyond 2016 to record low levels. Companies like RRC are hedged through 2016, yet can only hedge at low prices beyond 2016. This gives the companies less ability to invest in future projects.
Thanks for the update Ron and Enno.
Ron wrote:
”So according to my calculations it would have taken about 175 new wells to have kept production flat. That’s a few more than I would have thought.”
FWIIW
NDIC records show a net addition of 581 producing wells as from January through April 2015.
Enno’s list shows 645 wells started production for the same months.
Production declined with about 55 kb/d as from Dec-14 to Apr-15.
No matter how those numbers are whipped for confessions the number of monthly well additions needed to sustain production now appears to be in the range of 150 – 180 (which is above what I expected).
I agree with Mr.Likvern.
Based on data shared by Enno Peters (thank you Enno, you are very gracious). I put together completion data for Jan 2014 to April 2015 for the Bakken/Three Forks of North Dakota.
For the most recent 6 months I have assumed that confidential wells from the counties where most Bakken/Three Forks wells already exist are in fact Bakken/Three Forks wells (this may be an overestimate). Output was relatively flat from Sept 2014 to April 2015 and the average new wells completed in the Bakken/Three Forks of ND was about 176 new wells per month over that 7 month period, I am also surprised by this, perhaps new well productivity is decreasing or the new wells from 2014 are declining more steeply than before, it may be too early to tell. Completion data below.
Dennis, I notice your count is a little different from mine for some months. I am sure your count is more accurate. I just counted wells and some of those wells should not have been counted. I see some wells in the 50,000 well number (permit) range. I never see these wells in the Daily Activity Report Index. I have no idea why or what it means when wells are listed in the 50K range.
Ron (and everyone else taking an interest),
I suspect those 50 000 (well number ID’s) are produced water disposal wells and they are all targeted the Spearfish/Madison formation.
Several of these wells have some monthly production reported which I suspect is reclaimed oil (simple gravity process and takes a little time) from water processing which then gets allocated to wells that delivers to the disposal site.
This may explain a portion of the monthly revisions to LTO numbers.
I did some checks for some companies and found the amounts from these disposal wells comes in about 0.1 – 0.2 % of (monthly) totals.
Hi Ron,
Rune is correct, which I would expect. The wells with ID #s of 50000 or higher are disposal wells, my count is not necessarily more accurate than yours, especially November to April includes confidential wells which requires some guessing. The counts through October should be pretty accurate (+/- 1 well, I think), but I may have counted incorrectly.
Dennis, from now on I will sort by well # first and get rid of all those 50,000 numbers before I start counting.
Never mind, just noticed loads of double counting in this months Excel.
I follow the daily reports too, and this month’s production drop has blindsided me a bit, to be honest. I have been predicting next month’s production thus:
1) decline rate for all existing wells
2) adding on all producing well completed and confidential well completed/plugged notices from the daily reports, assuming they will follow an average production profile from the last 12 months for the county in which they have been drilled
I guessed 1.22 million for this month – so I assume that I should have plugged more confidential wells than I did in my model. I’ve tried to rectify this by plugging confidential wells that appear in the daily reports but already exist in the dataset – but some confidentials (e.g. well 27477, completed January 2015) apparently only appear as completed/plugged in the daily reports months (March 2015) after they appear in the published data. I can’t understand why this should be the case.
As for the 50k problem discussed below – in the Monthly Production Reports these wells are classed variously as “Recovered Liquids from Gas Lines”, “Disposal Well Skimmed Recovery”, and “Waste Oil Treating Plant Recovery”. They account for Mason Inman’s 0.6% discrepancy a few months back, and generally have counted for around 7000-8000 bpd in recent months.
Ron, I don’t follow your comments in the article about US production estimates vs ND/Bakken figures.
“That means that from December to April, US production, less North Dakota, had to be up 315,000 bpd.”
“And need I remind you of what has happened to US production since April. The EIA weekly crew has US production up another 237,000 bpd to 9,610,000 barrels per day.”
So, unless ND has a spike up in May, Texas and other states are up over half a million barrels from beginning of 2015? Is that what EIA projections of 9.6 million bopd should be telling us?
It seems TX rigs fell off a cliff in a similar manner as ND. Further, I can’t see any other states having that much of an impact over a four month period.
So TX was underestimated for months? I don’t see how we got to 9.6 million with one of the two states driving the US boom falling and a huge rig loss in the other as well.
Down 110 from June of 2014 with the rig count at 75.
13,750 jobs lost. Translates to no paycheck, no money, and find a new job.
March of 2008, 520 Bakken/Three Forks wells.
April of 2015, 9525 wells in the Bakken and Three Forks.
9005 wells more than in March of 2008.
Each one at 9 million dollars per well.
9005 times 9 000 000 is a big number.
Very big, too big, let’s say it is much too big, bit off more than can be chewed, just have to keep on chewing, nothing else can be done. The banks are going to have a bone to pick after the chewing is over and it ain’t over until it is over.
81,045,000,000 numbers, one through 81,045,000,000 will take some time to get there. Are we there yet?
How long will it take for all of those numbers to return to the beginning, zero?
If General Motors had 81 billion to invest, they could come up with something other than 9000 wells depleting to an unsustainable economic disaster.
It’s only money. Got a million barrels of oil out of the deal.
But, hey, it created a boom not soon to be forgotten.
Ronald Walter. Pretty good statistic about 9,005 wells and $81+ billion dollars to drill and complete them.
Now lets just figure many of those in prior years cost over $9 million. Plus add in all of the $$ spent acquiring acreage, building infrastructure, pipelines, etc. And add on all the interest payments to date.
So we will assume $100 billion which in April produced 1.1 million barrels per day gross. Assume 20% royalty, so 880,000 net bopd to the working interest owners, who paid the $100 billion. That is $113,636 per flowing barrel.
There is some gas production, which helps a little. But offsetting that even more is a low oil and natural gas price, low basis (that has improved quite a bit recently) and high decline.
$100,000 per barrel for a lease only makes sense if oil is $100+ per barrel, OPEX is low, and decline is low.
Thanks for the overall perspective, Mr. Walter. I have been analyzing this stuff in many different ways financially, but this big picture view hits it home.
Economics right now are comparable to early 2000s at best, when oil production of the low decline variety brought $10-30 thousand per barrel and $100,000+ per barrel just did not happen.
So, without the high oil prices from the recent past, which clouds judgment, Bakken production which cost maybe $100 billion to develop is likely worth $10-30 billion in the current environment?
Would like some comments on this “back of envelope” calculation.
I throw out another back envelope calculation. Those 9005 wells are going to produce around $7 billion in pre income tax income in 2015 if the futures strip holds, assuming $250 K of OPEX per well, with one down hole pump change and one tubing hole repair per well, also assuming 10% production/extraction taxes, and assuming $50 billion is still owed on those wells.
7% pretax return won’t cut it when, over the next five years, those 9005 wells will decline to less than half of what they will produce in 2015.
Lets say in 2020, those wells average 40 barrels per day, which may be generous. The wells will need $120+ oil to return the same as in 2015, unless OPEX per well decreases, and/or interest expenses decrease.
Ronald when I see how many thousands of wells being drilled and all the money flowing around in the Bakken shale oil fields and Williston plus other places in ND I just get BESIDE MY SELF WITH EXCITEMENT!!!!! if they are begging for people to work walmart for $17.00/hour think what Ill be getting paid when I come up to ND as a welder!!!! a SKILL!!!!! Im getting ready to grad welding school this fall. will have Mig,Tig,Oxyfuel as well as SMAW and FCAW for my structural and will include pipe cutting. I got my eye on the oil fields in wiliston ND etc. SURE it be cold and yea I will work hard in it BUT I will make great living and future for myself!!! and getting dirty,working hard in cold or hot weather is nothing I have not done all my life on the farm and as a farm hand . NOW!!!! if that is what it takes Ill gladly start as a welders helper or ranch hand to get started.far as weather I just know how to dress for the occasion.
FYI – I understand that the real shortage of welders is in the Gulf Coast off Texas and Louisiana. Good luck!
Dustin, pay attention!
A cutting torch will come in handy from time to time.
Mosquitoes, woodticks, two critters that will make you look like a flea-bitten varmit when you are out there all day long, and don’t forget horse flies and deer flies. You’ll have welts on your skin all summer long. No insects during winter, the cold weather makes it difficult to survive.
-35 degrees makes everything creak and moan. Steel breaks, you might be welding on days when it would be better to stay inside. Cattle need to be fed and watered, you will have to brave the elements each day. No two weeks off every two weeks, Sundays, Saturdays, every day will be a workload.
Texas is hot and the sun will boil your brains out. Never been there, it is too hot and dry, the winters are mild, but that doesn’t count.
Alberta is a great Canadian province and there is cattle and wheat along with oil. Edmunton is a long ways from anywhere with plenty of Canadian prairie in between. The Peace River Valley is more or less the end of the line, after that, you’ll be in the Canadian wilderness. You won’t escape mosquitoes though.
Actually, there is never an end to the work, no matter what that work is. The charts and graphs displayed at this site require work too and it don’t come easy.
Pasture land, wheat fields, oil fields, all require a heavy workload and it won’t stop. Quitting is not an option until you retire and you are not going to win them all.
Oasis is hiring.
Colorado has the best beer in the world, so it would be a good decision to find work there.
Good luck to ya.
Say ‘Hi’ to dn_girl for us…
She’d (or her hubby) be a-twerkin’ for work ’roundabout now for Da Boss-Mans, I figure. Gotta get mugged for them governpimp dental plans ya know.
Don’t worry, in a short time those well plots will get covered with wind towers and solar panel farms. Lots more money to be made, fantastic growth industries to keep the wheels spinning. It costs about 2 million dollars to cover a four acre drilling plot with solar PV, road is there already and power lines can be run out to a main road and a few substations built. More money for the services.
PV only declines at a percent or less per year so it will be 70 years or more before it’s down to half power. Bet the oil people wish they had that kind of decline rate.
My thoughts exactly, Zepp. What is going on in the heads of all those people drilling all those holes? They do the most exact arithmetic over and over to show beyond any doubt that what they are doing is less profitable than the same money in wind turbines in that same windy site.
What?
Besides, wind turbines get better and better, with lots of room to keep getting better for a long time, where holes get more and more worse and less and less chance to do any better.
“….wind turbines get better and better, with lots of room to keep getting better for a long time…” How much better are they going to get? To my knowledge, commercial utility-connected turbines currently deliver 75 to 80% of the Betz limit of power extractable from the wind (at rated operating speed). Of course there are devices around claiming to improve efficiency of turbines, particularly the so called shrouded turbines: But, there appears to be little data to support the greater efficiency claims. Perhaps you know better.
“Better” means anything that makes it more desirable. Like cost. Or reliability.
Eg. Gearbox- biggest maintenance cost. Why bother? No need for a gearbox. Gets rid of some cost as well as maintenance.
Bigger alternator? Sure, So we have a bigger propeller hub. Actually increases efficiency of the blades.
And power kites. Blows everything else away–hahaha.
And intermittancy? No problem. Each unit pumps air one step farther up the pressure ratio, almost constant temp compression at max efficiency. Store the air in a big bag way down in the water the unit is floating on. Power on demand, any time, any wind.
And on and on and on.
Ditto for solar.
So now let’s hear the similar list for holes in the ground.
Gawd! How exhausting, time to take a nap.
You may be right. Apparently the main problem of conventional rotor support structures is gearboxes are performing structural and mechanical functions at the same time; this is especially critical offshore of course. In the Netherlands there is a lot of discussion about whether gearbox failures are due to the gearbox inability to withstand specified loads or to the fact that real loads experienced by the gearboxes are higher than those specified by the turbine manufacturers.
I have always thought the way it’s arranged, the turbine gearbox is just begging to fail. A dumb design for sure, and what are they doing just making the same thing over and over when there are so many better options?
Suddenly, a solution! Switch designers, the gearbox designers go to ND and think about better ways to do that, and the hole experts go to the wind turbines and do them.
Instant result. Both guys say what’s being done now is nuts and we can do better- and then they do it.
That will be ten cents consulting fee, please.
OK, make it two.
I think the gearboxes in windmills are there so they can use induction motors, which don’t require permanent magnets. Induction motors require higher rotation frequency.
You mean generators? I think they just need to beef up their designs. This may be growing pains. But it’s bound to increase the price while allowing the windmill to survive. This will be critical in offshore settings. I suspect the industry is growing too fast and has lots of inexperienced buyers.
Huh? What’s an induction motor doing in a wind turbine? What’s the purpose of any motor, apart from those that position the nacelle to face the wind and those that adjust the pitch of the blades?
They are getting bigger.
Yep, and how’s that for thinking out of the box? Bigger turbine, gotta have bigger box for it, haha. Sigh.
There’s so many better ways to get better. I like the pumped air idea, no alternator, just a crank- conrod- piston(super rugged) pumping up the pressure ratio. Storage, and power on demand from one big central gas turbine.
One nice thing about any storage system is that they can be local. The electric power can be stored in batteries, pressure storage, pumped hydro, and hot salt. The storage could be locally situated and activated by remote signal as wind and solar vary.
Old power plants could be converted into power storage facilities.
Air storage loses a huge amount of energy. It’s a thermodynamics issue. I think the better solution is to build a better turbine. They also need to develop a heavy lifter to carry very large blades from the factory to the site by air.
Isothermal compression and storage do not lose energy, and a close approximation to isothermal is multiple compression and intercooling, as would be easy using multiple stages in a bunch of wind turbines.
it’s a thermodynamics issue.
What you propose doesn’t work. It’s impossible to design a compression system with infinite inter cooling, and there’s no heat exchanger with perfect heat exchange. You know, the more surreal you guys get the less energy I have to try to mentor you. Try to keep things a bit more practical.
goddam it, fernando. It’s obvious you don’t know squat about this subject.
I do, and have some impressive looking pieces of paper from the two most rooty-tooty engineering schools in the country to that effect.
D. G Wilson, the guy who wrote the book on it ‘Design of High Efficiecy turbomachinery and gas turbines” is a personal friend.
Go to page 106 of the second edition and read about intercooled compression.
BTW- no real engineer ever talks about “perfect”or “infinite” anything. They know there ain’t no such.
But sometimes one process gets closer than some other process. Intercooling and store is better than adiabatic and store with heat leak back to local temp.
As Wilson -and any thermo book -will tell you.
Hi Wimbi,
Thanks. Sometimes Fernando assumes he knows more than everybody else.
In the case of petroleum engineering, this is probably close to the truth.
In other areas I will continue to reserve judgement.
Do you have any opinion on the grid stability issue of reactive power making it “nearly impossible” to maintain grid stability with high PV solar input to the system or are you mostly a mechanical engineer with minimal power engineering expertise?
Dennis. My experience with actual grids is pretty limited to elementary physics. My EE friends seem to have a similarly simple sort of idea about balancing RCL circuits with the right C to balance the L so as to get the voltage-current phase angle close enough.
And, I am always of the mind that the best thing to do is to look around and see what is being done already. People using a lot of solar and wind have not been squawking very loud, so, say I, things can’t be all that tough.
BTW, my long experience in engineering R&D gives me a high regard for the capability of a good team to solve almost any problem that has a solution in the realm of applied classical physics.
The problem of human stupidity is not one of those.
Dennis Coyne had a spreadsheet on here a few months ago showing cash flow from bakken wells. With oil at $60 oil companies can produce positive cash flow by completing previously drilled wells. Cash flow from drilling and fracing a well would be close to break even at $60.
With oil at $60 I expect to see in the directors report that the number of uncompleted wells has declined. The continued completion of these wells will support production in the short term, but when those numbers run down, you will need drilling to pick back up or production will accelerate its decline.
Gerd,
Sounds like a great investment. What lunatic would invest their money in a company that breaks even on a point forward basis?
LOL… Steve
Steve,
PROFITABILITY does not matter any more.
Get with the program!
FWIIW,
NDIC data showed 107 net added producing wells in April 2015, this would result in an estimated negative cash flow of about $200M for April.
Enno’s more detailed data show 153 wells had their first production in April -15.
Rune,
I hear ya. I’m putting in a bid for one of the Feds used printing press. If I can get my hands on one of those babies… I can invest in lousy unprofitable shale companies all day long.
Steve
Steve,
You would be very, very busy investing.
And if you by any chance get the winning bid for a printing press, you could just…. print the profits as well before the wells are drilled.
Somewhere around here I have a big old coffee table type book full of tales of the robber barons and the gilded age. I can’t remember which two were involved in this particular story, but one of the two became aware of the fact that the other one was trying to corner the stock of certain company in which he was heavily invested.
So he bought himself a press and started printing off stock certificates and selling them quietly thru various intermediaries.
When one of his guys asked him how much to print to scam the other fellow, his reply was
” As much as he wants so long as that press don’t break down. ”
Nowadays the number of shares and who has them and who is selling them and buying them etc is well known to the regulatory authorities. Printing stock certificates would get you an all expenses paid vacation at the gray bar hotel pretty quick.
But that does not matter to people who understand selling smoke and mirrors. They just adapt to the rules as the rules change and generally stay a jump or two ahead.
The investing public has apparently not learned very much in the last century plus. It is still in effect buying as much as the presses can churn out under the new rules.
It was one of the railroad guys. Jay Gould comes to mind.
Rune,
Brilliant idea. Printing profits sounds like a hell of a lot more fun than wasting time with highly leveraged shale company debt cows.
If the collapse of the subprime housing market in 2008-2009 and its impact on the U.S. economy is any indicator of what’s in store when the Great U.S. Shale Energy Industry finally implodes…. better get your bids in for the Feds used printing press before they run out of ink.
Just saying…
Steve
I have said it before, and I have to reiterate, this just isn’t on the scale of the great-bust-just-passed.
Use the calculation from earlier that came up with $80B to drill ALL the new wells in the Bakken since 2008. $80B is a lot of money no doubt, but it’s a drop in the bucket compared to the earlier fiasco.
$200B was guaranteed to Citigroup alone, over $1 trillion was dedicated to buying questionable materials from Fannie and Freddie, another $1 trillion was guaranteed for consumer backed loans such as credit card paper.
And on and on. Some of these lines weren’t tapped, but it was a shock and awe response for sure.
Heck isn’t the EU printing $80B a MONTH at the present time? Until you’re talking about those kinds of numbers in the oil patch, and you’re not and you never will be, I find it hard to make the comparison.
DuaneX,
It’s much bigger than that… MUCH BIGGER. Depending on the analyst, its been speculated that twice as much money that went into propping up the Sub-Prime Housing Market, has been used to prop up the U.S. Shale Oil & Gas Industry.
It’s not just the Bakken wells that were drilled… thar’s a whole bunch more shale crap wells in the U.S. For example, the U.S. drilled something like 36,000 wells in 2014 to produce its total liquids. How many were horizontal fracked… who knows, but I would imagine the majority.
So, you start adding up say 15,000-20,000 per year for the last 5 years or so… then you got some seriously big numbers. Furthermore, the Banks wrote a lot of derivative hedging bets. There seems to be many layers of financial crap piled on more financial crap in this ENERGY PONZI SCHEME besides the capital to drill wells.
steve
Still not seeing it, though I have no argument with the idea that there are layers upon layers of crap out there.
You could drill 15,000 wells at $9M per well for $135 Billion dollars, each and every year, and just throw them away, meaning all 15,000 never produce a single marketable thing, which I don’t think anyone is actually suggesting, and it would still be a rounding error compared to the efforts expended on behalf of the property markets.
If there are such seriously big numbers, and if banking exposure to energy-related loans is a big risk, go to any major bank’s financial statements and find it.
Go to eBay and buy a 100 trillion dollar Zimbabwean note for twenty dollars US. Printing presses are a waste of time.
I got my Zimbebwean conversation piece note back when they were only four bucks including postage etc.
Shouda bought a sackful seeing that they are already up to twenty , lol.
Unless you change current legislation, you can only buy federal government issued debt instruments with the printing press.
If I understand correctly.
Checks and Balances was the intention I believe.
The government can print money, but it has to be straddled with debt to discourage abuse.
Hasn’t worked so well..LOL!!!!
Hi Gerd,
I think that spreadsheet may have been incorrect. Rune Likvern pointed out to me that I was not doing the break even calculation correctly. If the future price of oil increases in a manner similar to the EIA’s Annual Energy Outlook (AEO) high oil price case (from AEO 2015), then the net present value of future income may be equal to the cost of a new well (assuming a discount rate of 10% and an inflation rate of 3% both at annual rates). That is not the same as a break even of $60/b (WTI), where oil prices are assumed to remain at $60/b in 2015$ indefinitely.
Everybody is making money. The drivers, the workers, the pipeline people, the motel owners, the railroads, the restaurants, the concrete and gravel people and more. Except of course the oil company and investors. It’s a new way to move money around, a merry-go-round economy with only the people reaching for the brass ring as the losers. How wonderfully democratic.
Can’ t forget all that sand, the sand quarry people are living it up. Three local railroads near me and a couple of mainline rails are getting the money too. Redistribution of wealth, yippee.
“Everybody is making money.” Yes we are!
Prospecting for Black Gold
Norm’s next big move: opening a hotel in North Dakota
http://www.inc.com/magazine/201109/small-business-advice-from-norm-brodsky-on-prospecting-for-black-gold.html
September 2011 article. I would guess that things have changed somewhat by now. It would be interesting to see a follow up story. On the other hand, they may have paid for their entire investment in 2 years.
Expectations and investment outlook in Canadian oil production are on the wane as production is expected to plateau much sooner. Let’s see if the expectations fall further in a year or so.
http://www.theglobeandmail.com/report-on-business/industry-news/energy-and-resources/canadian-oil-industry-slashes-growth-spending-outlook/article24872952/
Apparently Great Britain has the highest production costs per barrel in the world. They are getting hit hard by the price drop.
“Lower oil prices will hammer Britain’s North Sea oil industry for decades to come, according to the government’s fiscal watchdog, which has slashed its revenue forecasts for the sector over the next 25 years. ”
http://www.telegraph.co.uk/finance/economics/11667839/Oil-price-plunge-will-hammer-North-Sea-producers-for-decades.html
Apparently Nigerian oil production exports were diverted from the US due to the shale oil boom, with Nigeria looking for customers. Maybe Nigeria will again be exporting to the US as the shale oil boom fades out.
http://www.naij.com/456822-china-dumps-nigerian-crude.html
Less US imports from Nigeria. Yes. Look at Fig 1 in my post
6/11/2014
US oil dependency on Middle East has hardly changed since 2007
http://crudeoilpeak.info/us-oil-dependency-on-middle-east-has-hardly-changed-since-2007
Looks like most of the drop in imports from OPEC has been from Nigeria and Venezuela.
http://seekingalpha.com/news/2168435-exxon-sees-global-emissions-surging-north-america-to-be-energy-exporter
Latest XOM Annual Outlook :
“North America is set to become a net exporter of oil and natural gas, and its production of unconventional will nearly triple by 2040, surpassing the combined output of Russia and the Caspian region as the largest gas-producing area, the report says.”
Smoking BABY Smoking .. New finds in Cuba? .. Trains Leaving Station, better get on… XOM says so.
So XOM is gung ho about actually creating an energy cliff in the future. With friends like that ….
http://news.yahoo.com/union-hackers-personnel-data-every-us-govt-employee-195701976.html
China steals the personnel data of every us government employee.
“Mike Rogers, the former chairman of the House intelligence committee, said last week that Chinese intelligence agencies have for some time been seeking to assemble a database of information about Americans. Those personal details can be used for blackmail, or also to shape bogus emails designed to appear legitimate while injecting spyware on the networks of government agencies or businesses”
When US shale oil took off, China started its own battle
10/6/2015
China’s offshore CNOOC started to peak in 2010
http://crudeoilpeak.info/chinas-offshore-cnooc-started-to-peak-in-2010
The island building campaign by China could not possibly be a more obvious strategy for Peak Oil.
I suggest it is ELM peak oil models that are driving the urgency (Jeff’s excellent work). I used to be Boltzmann Brain IV, but no one cares anyway. I have converted to Satanism in the name of absolute stupidity.
And to justify the multi-billion dollar project expenditures, with risks such as being attacked by the US or Japanese Military, must have a very good reason!!!
Combine that with the multi-decadal, multi-billion expenditures from NATO to build a missile shield aimed a Russia.
Here is a hint: ( Western nations with publicly traded oil companies can’t implement a strategy for securing oil and gas, State owned China and Russia are taking advantage of this…..BURP!!! )…
This can’t possibly be a coincidence.
Is Old Farmer Mac a Russian spy in disguise? LOL!!!!!! (love OFM’s posts!!)
Satan will win the battle between GOOD and EVIL!!!!
Guaranteed!!!!
Military types often refer to islands as unsinkable aircraft carriers.
History ain’t over yet.
The South China sea is full of submarines so makes sense.
Nothing a bunker buster couldn’t deal with. Lol!
Typhoons have a way of undoing any infrastructure on an atoll. There is an atoll in the Caribbean Sea called Swan Island with an airstrip. In October 1998, Hurricane Mitch moved through the area with winds of 180 mph. That can rearrange a flight line and maintenance hanger in no time.
I suppose if they put their minds and backs into the job the Chinese can build better islands than they do motor scooters.
I have no clear idea how you build an island other than to just dump millions of tons of stone in the sea in an ever growing pile. I guess if the stones are large enough – boulders the size of cars and trucks mostly – the pile will mostly stay put in even in a hurricane.Whatever is built on TOP of the pile can be replaced easily enough. They would fly out their aircraft and most personnel in the event of a major storm.
Mac, it depends on what that reef is made of. Reefs can be very treacherous because they can have very heterogeneous rock strength (caused by caves, large pores, leaching, cracks, etc). This means piling rocks can lead to partial reef collapse. Even if we use driven piles to provide support we are limited on the load we can apply, so in the oil industry we try to avoid reefs and build on the flat areas just off the reef shelf.
An island like the Chinese are building can use dredged material, mostly sand and reef pieces found off the shallow sector. Some engineers like to build cement walls, but those usually collapse. The best approach is to pile lots of sand and be prepared to pile lots more later. And I would build a raised platform on steel piles, about 20 meters above sea level, on top of which I would put the sleeping, cooking, generators, and a second one for a radar station about 300 meters away. Sort of like a pair of offshore platforms. This thing would have zero military capability other than the radar.
Thanks Fernando,
Sand obviously makes a lot more sense since stone is probably not readily available anyplace close by in the necessary quantities anyway.
I presume you pile as much stone as you can find around your sand pile to help slow down erosion.
Now as far as military use goes, such islands might be more useful politically than militarily. But if they could build them large enough to launch a few fighter aircraft, helicopters or rockets on short notice that could be a game changer given it might be cheaper long run than keeping a ship on station in the same area.
It doesn’t take much in the line of facilities or personnel to support a few planes that can be rotated regularly on pilot training flights back to the mainland for repairs and scheduled maintenance.
But the primary intention may be simply to plant the flag on these islands thus providing some color of title to nearby waters as territorial rather than international waters.
There have been some good discussions regarding the unexpected situation in ND that we have quite a large number of newly producing wells, but still an overall decline. As others, I expected that we would need about 120 newly producing wells to keep production at current levels, but the actual number is higher, while production has declined.
I have tried to analyze why that is. To do this, I broke total production down into 3 groups of wells:
1) old (producing > 1 month) wells that show a decline
2) old (producing > 1 month) wells that show growth
3) wells producing for the first time
The total increase in production of group 2, minus the total decline of group 1, plus the new production of group 3, should show the net increase/decrease in ND.
I have done this, and the 3 groups, plus the total net increase/decline is shown in the below graph.
What this shows is for each of the 3 groups:
1) The group of declining wells follows the trend of growing overall decline.
2) The total growth from growing wells however has drastically fallen behind during the last half year. The causes of this are unknown to me, but it looks as less effort is placed on accelerating production from existing wells. This of course makes perfect sense in a low-price environment, but maybe there are also other causes, such as restricting new production due to gas-flaring restrictions.
3) Total production from new wells (producing for the first time) has fallen a little, but this is mainly due to a lower number of new wells, the quality of new wells seems still quite similar to 2014 wells.
If these trends continue, indeed a much higher number of newly producing wells are needed to keep production up, compared with earlier estimations from several us (and also estimations by Helms).
On a monthly basis I update a database that includes the monthly oil/gas/water production numbers for all individually reported wells in ND. I have shared this with several on this board. If you are interested in it, just drop me a line. My email is my full name, with a dot between the names, and it’s a hotmail address.
Enno, thanks for the graph.
A hint to those who would like to view a larger image of this graph. If you right click on it, then left click on “copy image”, then paste it into “paint”, you will get a much larger image that is very easy to read. “Paint” is a program that comes with Windows. If you have Microsoft Windows then you have Paint. You could also paste it into Word but that doesn’t help. There the image is not enlarged. But there you could go to “view” and zoom to 200% and get an even larger image.
You say the quality of new wells is similar to 2014 wells. If they are selectively fracking, from the very large pool of unfracked wells, then the quality of wells should be better than 2014 wells. Perhaps they are but the wells are still comparable to 2014 wells.
Three things occurs to me (which are not mutually exclusive): (1) Older wells are declining faster than expected; (2) Operators are running out of sweet spots and (3) Well interference (fracs on new, more closely spaced wells are intersecting already partially depleted areas).
Some supplements to Enno’s work
Continental added 93 producing wells from Jan through Apr 15 (26-27 in average from Jan through March and 14 in April).
First month average flow: 2.4 kb (Jan – Apr), 1.8 kb for Apr
EOG added 14 producing wells from Jan through Apr 15 (none, so far, reported for March and April).
First month average flow: 7.8 kb
Whiting added 107 producing wells from Jan through Apr 15 (23 in April).
First month average flow: 9.7 kb (Jan – Apr), 6.4 kb for Apr
One should not read too much out of data for the first month flows, but this may describe a trend that has been observed for other companies as well.
I presented a more detailed look at those 3 companies in the post linked below
http://fractionalflow.com/2015/06/07/the-bakken-red-queen-is-restrained-with-more-credit/
Hi Enno,
Interesting data. In previous months I discussed that when you complete a well close to an existing well, production in the old well increases. So if the number of new completions which are close to old wells decrease, then the number of old wells that increase production will also decrease. That could explain at least some of point 2.
Now we know why there was no Director’s Cut Friday.
North Dakota oil production down 1.8 percent in April
North Dakota oil production decreased 1.8 percent in April to nearly 1.2 million barrels a day, preliminary figures released Friday show.
Director Lynn Helms said last month he anticipates the state’s oil production to remain between 1.1 million and 1.2 million barrels per day until oil prices recover. Helms was not available to make comments on April’s oil production Friday due to scheduling conflicts….
The percent of North Dakota crude transported by rail remained unchanged in April from the previous month at 54 percent, the Pipeline Authority said in its monthly report.
I suppose we will get the Director’s Cut on Monday.
The EIA drilling productivity report shows the decline from legacy wells for the Bakken at 80 000 bopd per month, after reaching a peak of 85000 bopd last month. This can be verified as a reasonable number.
1) Various estimates put first-month production from new wells in the Bakken between 600 and 680 boepd with 80% oil to gas ratio.
2) We know that average decline curves mean that after 12 months, production has declined to 25% of first month production. Taking the average, we can calculate a monthly decline for these wells.
3) Looking further out in time, average wells decline 50% in their 2nd year, 33% in year 3 and thereafter show a slow decline around 20% per year.
4) Historically we know that over 12000 wells are producing in the Bakken. Taking these numbers, the EIA estimate of decline from legacy wells as 80 000 to 85 000 is a good number.
I estimated that in order to replace this monthly decline, the Bakken requires between 125 and 149 wells to be completed each month, based on first month oil production of between 480 and 595 bopd per well.
The fact that your numbers suggest 175 wells per month are needed to negate legacy well declines, suggests that average first month production is 457 bopd – a little less than the lower end of the range of estimates I used.
DMR numbers suggest that a total of 2066 wells came on stream in 2014 or 172 per month. So with increased legacy drops, the industry in the Bakken has to complete wells at the rate they did in 2014 just to maintain production where it is. Meanwhile, the rig fleet has reduced by 62% in the Bakken. No matter what efficiencies may have come to play since October last year when the rig count peaked, it is impossible to drill and complete the same number of wells with the rig fleet 38% of its former size.
All of which indicates that the EIA drilling productivity report showing a production decrease is much closer to the truth than the EIA weekly report claiming a rise in production.
The EIA estimated decline from legacy wells for all plays reached 347 000 bopd per month. The same type of calculation for other plays shows that light tight oil ought to have dropped by around 500 000 bopd from its peak in December 2014.
This aligns quite nicely with American Association of Rail data showing that crude transported by rail year-to-date in 2015 is down 9% from where it was in Q4 of 2014.
Hi Keith,
There have been some new pipelines that have come online in North Dakota and in addition some of the crude by rail was being trucked in from Canada. There have been some new crude by rail terminals that have opened up recently in Canada so less of this Canadian crude is being loaded at US rail terminals. Most of the crude by rail starts in North Dakota (some of it is from Montana) and we have good output numbers from North Dakota.
Hi Dennis,
Thank you for your response.
The American Association of Rail web pages say that the US figures exclude the US operations of Canadian operators. There is a separate measure of Canadian rail transport which includes cargoes originating in Canada and transported in US, as far as I understand the explanations given.
https://www.aar.org/Pages/Freight-Rail-Traffic-Data.aspx#monthlyrailtraffic
Hi Keith,
I think I was unclear. New rail terminals have opened in Canada recently so more Canadian crude is being shipped on Canadian rail rather than US rail. Before those terminals opened the crude was trucked in to North Dakota from Canada and shipped on American railroads. Less of that is now happening.
https://ndpipelines.files.wordpress.com/2012/04/wb-oil-export-options-4-13-2015.jpg
In addition about 100 kb/d of new pipeline capacity came online in 2014 in North Dakota.
These two effects in combination account for the drop in US crude shipments by rail.
“Average number of new well starts per month from October 2014 through April 2015” by Drillinginfo.
As I understand, this is the number of wells drilled, not completed
Source: http://diindex.drillinginfo.com/archive/perspective-2015-05/
If Drillinginfo numbers indeed are for newly drilled wells, that means that, in March and April, there were more wells completed than drilled, and the fraclog is diminishing
Alex, you are correct, the “wells waiting to be fracked” should have shrank by about 60 in April. Your above chart of “wells completed” is way, way off. As I said, the numbers Helms gives in the “Director’s Cut” is totally unrealistic. Do you really believe only 42 wells were completed in February? Below is the actual count from the NDIC database:
Also the number of spuds can be found at the links below:
2014 Monthly Statistical Update
2015 Monthly Statistical Update
However you will notice the number of spuds does not match completions. I guess wells are seldom completed in the month of spud.
At least part of those wells are service wells (5-10%?), such as water injection and disposal wells. Also, some of those wells have later their permit cancelled, or were dry. Another reason for the difference is that some wells are later not individually reported, but within one of the few well groups.
Ron, I do agree with you. The numbers from the “Director’s Cut” look very strange. That is what I was saying. Your numbers from the NDIC database are much more realistic
Ron, a year ago, there was 114 (!) days from spud to initial production in the Bakken (from April 2014 Director’s cut).
The EIA shows an even bigger number
http://www.eia.gov/todayinenergy/detail.cfm?id=19711
Alex, the spud to initial production time basically is an indicator of how long a finished well was awaiting completion, or awaiting a fracking crew to finish the job.
What the number of spuds per month does tell you is how many wells were started during that month. And it gives you some idea of how long it takes to drill a well. If spuds and rig count is about equal then it takes about 1 month to drill a well. If spuds are more than the rig count then it takes less than one month to drill one well and move to the next.
Yes, Ron, I know this. What I want to say: despite all the improvements in drilling time, it still takes about 4 months
from spud to initial production
Something is going on with well completions, and I guess that nobody knows. I previously posted that on June 1 that the CEO of Core Labs on CNBC said that “last month” only 32 wells were completed in the Bakken. I had 2 questions. Is that right? And, was he referring to May or April [since statement was made on June 1]? At any rate, I guess that the only metric to follow is production, and accept the delay of several months for accurate numbers.
Hi Clueless,
The CoreLabs guy may have been assuming that the information in the Director’s cut on well completions is accurate, it is not very accurate and there are disclaimers that say, the information may be inaccurate.
The data that Enno Peters gathers comes directly from the NDIC, but Enno puts it together in a way that it can be analyzed much more easily.
Maybe Lynn Helms should e-mail Enno Peters to get a copy of the data!
🙂
For those interested in the completion data for the North Dakota Bakken/Three Forks, I have put it below in a form that can be copied and pasted into excel.
Data below:
new wells per month
all 2013 _ 165
01/15/14 _ 111
02/14/14 _ 147
03/16/14 _ 152
04/16/14 _ 183
05/16/14 _ 209
06/16/14 _ 186
07/16/14 _ 194
08/16/14 _ 210
09/15/14 _ 196
10/15/14 _ 181
11/15/14 _ 175
12/15/14 _ 213
01/15/15 _ 149
02/14/15 _ 156
03/17/15 _ 181
04/16/15 _ 153
Sept-April avg _ 176
In Excel just use “_” as a delimiter (underscore inside the quotes) in a text to columns operation under the “Data” tab.
In the following graph we can clearly see the effect of the oil price drop on legacy wells in North Dakota: The number of wells at least temporarily shut down has increased sharply in the last few months. At least some of these may be brought back online in the future, but I guess most will not. All of the wells marked as offline in below graph have not produced ever since.
Hey, this adds a whole new metric to the price decline. I suppose the same thing is happening in Eagle Ford and all the other shale plays.
Thanks, Enno
This is an additional factor to consider
Great catch Enno.
It is from here it gets interesting as many wells are partnerships (2 or several owners having Working Interests and thus obligations for their portions on OPEX and CAPEX).
So what happens if one (or more) of those financially obligated to pay their share does not (temporarily, it may take some time to raise their portion of the funding) have the money readily available?
This could be to pay for some kind of well interventions needed to resume operations.
These things are regulated in the Owners’ Agreements, and in The North Sea there are some companies that temporarily? is not able to fund their portion of operations. One of the consequences is that they are shut out of the information flow.
Some mechanisms are triggered to cover situations like these.
The operator in this situation should file an oil & gas lien. Like a mechanics lien, a timely filed oil & gas lien perfects a security interest in the delinquent interest, superior to that of creditors.
Of course, another reason why a creditor would keep the money flowing to pay OPEX, don’t want to lose the first position.
Hi Enno,
It would be interesting to see the percentage of cumulative wells shut in vs total producing wells.
It looks like this ends up being about 7 to 8% at present. Most of these wells probably have low output, say 300 b/month (or less), but for 900 wells, it would add up to about 9 kb/d of output over a 6 year period. The curve steepened in 2013 and the 500 well increase in wells shut in would amount to a 5 kb/d decrease over 30 months or about 167 b/d/month decrease if it happened linearly from Jan 2013 to March 2015, under the assumption of an average output of 10 b/d/well for the shut in wells.
I was just wondering, if a landowner leases part of his land to an oil or gas company is the landowner responsible for any spills or environmental hazards caused by the oil company activities?
You have got to be kidding! Have you ever seen a farmer responsible for anything?
That’s funny. I recall being pulled over and getting a stern warning from the Highway Patrol: Apparently a chain clamp safety wire holding a perfectly neat and perfectly secure load of drill rod wasn’t quite as well twisted as it could have been. True, a surgeon would have done a neater job. While discussing this with the cop a farmer chugged past pulling a dilapidated trailer with an ancient tractor belching blue smoke. Nothing was secured on the farmer’s load which included an assortment of irrigation pipe, cans of something (probably toxic), a couple of drums and miscellaneous other rusty junk, all bouncing precariously on a flat wood deck, all loose. When I mentioned to the cop that the farmer had an interesting load of stuff he just shrugged and drove off with his: “Have a nice day sir”.
Only if the farmer receives 100 percent royalties and the drilling company is hired by the farmer at a set amount, a contract to drill a producing well, the driller receives payment in the form of money, not the fungible commodity, for the work done. In other words, if the farmer finances it all, then he would be responsible. The driller did the job and is out of the picture, paid. Farmer receives every drop of oil after that, it is his in the first place, the owner of the mineral rights gets it all.
Try telling that to the Federal EPA. If anything, such as crude oil or saltwater, gets into a navigable water, technically the EPA says all are on the hook, including the surface and mineral owners. That is how it is written. However, I do also know the federal EPA has yet to try to enforce same upon landowners/mineral owners.
BTW, navigable water includes the road side ditch, as some of that eventually makes its way to a navigable waterway.
For shallow sand and his tireless and good works on understanding the magic in shale economics.
Goes for other interested as well.
I am exploring the idea (hopefully could get others to lift a portion of the study) of looking at both proven developed and proven undeveloped reserves and gross interest bearing debts for some shale companies.
Data could be pulled from companies 10-K/10-Q statements.
The metric is simple; it describes how much debt each future barrel (from the reserves) [$/b] will have to contribute to retire debts.
This circumvents uncertainties about the oil price, and could be useful for estimates of what oil price is needed to retire the debts (using nominal figures and keeping discount effects and production profiles out of it during the first runs).
This metric could then be sued to range companies.
Any other thoughts out there?
Rune. I think yours is a good idea. However, may want to think about all the moving parts and then decide exactly what data you want mined. I’ll use my favorite in the Bakken, CLR as an example.
First, all reserve information will be in the 10k as of 12/31/14. An oil price of $94.99 and gas price of $4.35 was used for reserve reports, then adjusted for local basis, in the case of CLR, 84.54 for oil and 6.06 for gas and ngls.
CLR shows proved reserves of 1,351,091,000 BOE in the 10K. We need to break these down between oil and gas and PDP, PDNP and PUD.
PDP oil is 333,040,000 barrels and 939,366,000 mcf gas.
PDNP is 9,097,000 barrels of oil and 22,685,000 mcf gas
PUD is 524,223,000 barrels of oil and 1,946,335,000 mcf of gas.
PV10 for PUD oil and gas is $12,181,300,000.
PV10 for PDNP oil and gas is $342,800,000
PV10 for PUD is $10,246,200,000
We also have to keep in mind the PV10 numbers above are non-GAAP. GAAP includes the effect of income taxes. GAAP standard measure lowers us from the $22 billion plus figure to $18,433,000,000. Income taxes knock out $4.3 billion dollars.
As we see, a large portion of the reserves are PUD. In arriving at PUD, CLR assumes they will be able to spend $12.2 BILLION in developing PUD reserves in the next five years (2015-2019).
One further should consider developed v non developed acreage. As of 12/31/14, CLR had net developed acreage of 1,104,213. Non developed net stood at 1,552,048. Of that, 410,481 net expires on or before end of 2015, 345,612 at end of 2016 and 271,597 at end of 2017.
As can be seen, there are many moving parts, and many, in my view, that result in CLR BOE reserves being very overstated, unless either they have access to unlimited borrowed capital, or product prices close to double.
In the above context, it is noted CLR ended 3/31/15 with $6,784,816,000 of long term debt, incurring $790 million of that in just 90 days, from 1/1/15 to 3/31/15. Product prices have improved some, but not enough. As we all know, they are practically unhedged.
I think most shale is in the same boat. Therefore, even though we could compute debt per BOE without too much trouble, my opinion is that BOE reserves for these companies are overstated in the current price environment.
Sorry for the long post. When we talk in billions, it can get long. LOL.
In light of the above, is the reason the CLR’s of the world are continually extended credit is to protect the undeveloped acreage collateral, before it vanishes?
I continue to be baffled as to CLR having an enterprise value of $25 billion, when PV10 at 2014 pricing is $22.7 billion, a large portion of PV10 is PUD and a load of that is on acreage which will expire this year, but which is wholly economic to drill
Oh, yea. Did I mention they borrowed $790 million in the most recently reported quarter. Oh yea, I did, sorry to pile on.
Actually, I do admire Harold Hamm. He was given nothing, one of 13 kids I believe, and started out driving a water truck. Hope for him, and us, we get some more price relief soon.
Hi Shallow sands,
So in effect are you saying that the oil price cannot be taken out of the equation because the proved reserves are determined in part by the oil price? Maybe something simple could be done to guess at how proved reserves would be affected by the oil price.
We could assume by Dec 2015 oil prices will be at $70/b (or whatever figure people think makes sense, we could us $50/b), then take 70/95=74% and reduce proven reserves by 26% to adjust for lower oil prices. It is likely not that simple, maybe there is a rule of thumb, that Mike, Rune, Fernando, or some other industry expert knows that would give us a ballpark figure.
Dennis. Back when CLR 10K first came out, there was a footnote which stated that if the futures strips were utilized as of a date in 2/15, PV10 all categories fell by almost 2/3, which I took to mean down to $8-9 billion.
I now cannot find the footnote, so don’t know if maybe I imagined that, but I don’t think so. Remember discussing it here before.
Don’t know how much of that reduction is less boe v how much is simply lower cash flow due to lower oil/gas prices.
I think come 2/16, shale companies will be in for reserves write-downs of the Shell/Monterey Shale variety.
Of course the higher the price of oil the more hard to get oil you would be able to recover. But I doubt very seriously that it would linear. Shale oil did not gradually become economically recoverable, it suddenly became economically recoverable when the price of oil reached that trigger point where it economically feasible to horizontally drill and frack.
Dennis. I found it finally. Need to read pages 28-29 of CLR 2014 10K.
Holding all other factors constant, a $40 per barrel decrease in the price of crude and a $1 mcf decrease in the price of gas from that used in 2014 could decrease proved reserves by approximately 10%.
Holding all other factors constant, if oil prices decreased $40 per barrel for crude and $1 for gas, PV10 could decrease $13.8 billion or 61%.
Don’t know that is a rule of thumb, and given CLR large amount of PUD and undeveloped acreage, I am surprised it would only result in 10% reduction in BOE reserves.
I agree 10% sounds too optimistic. So a 43% drop in oil prices reduces proven reserves by only 10%? I would think at least 25% would be more reasonable.
I guess that company is worth $3 billion. Is anybody buying it?
This company is worth $17.3 billion
http://www.bloomberg.com/quote/CLR:US
AlexS, doesn’t that blow you away given the numbers I posted above?
shallow sand,
Yes, but analysts assure the public that casflows will soon turn positive, and all those shale companies deserve special valuation metrics, etc.
Where is Steve with his printing press when it is in great demand? 😉
(He should win the bid for those printing presses just by promising to pay cash some days after he has got them fully operational.)
Look, I am not a reservoir engineer. In my youth long ago I prepared lots of financial statements with the assistance of reservoir engineers. Those annual reserve reports were based on proven developed reserves only, using decline curve methods. No volumetric stuff, no proven undeveloped stuff, no PUD horse hockey; that was all fluff that I indeed used in my report, mostly to make myself feel better. Big banks did not care then about how many wells you “thought” you could drill. I remember clearly being told one time by a big bank that I might as well leave all that bull shit out. The reserve reports I submitted were prepared at a given moment in time using the price of oil and gas at the time the report was prepared. Next year, when the report was revised and re-submitted, and the price was different, the undiscounted value of my reserves were different. It changed. Estimating reserves on decline curve methodology if of course price sensitive. In those reports the acceptable reporting standard at the time was to discount those reserves 0n 10,15,20 and 25. If I borrowed money to make a production acquisition all those money guys wanted to know was ONE thing and ONE thing only: if Mike got run over by a vacuum truck, was there enough reserves from existing wellbores for them to get their money back.
The potential number of PUD’s in a “de-risked” block of acreage is fluff. Placing value on those PUD’s in a report; yikes! This is where the shale oil industry and the folks that fund it exit planet earth as far as I am concerned.
Mike
Yes, Mike. One of the many things I have stated ad nasauem is that the energy banks we have talked to talked about loaning us 50-60% of PDP PV10. Little to no value on PUD. Folks, thats on production with a less than 5% decline 100% oil.
The bank lending standards are so out of whack for shale, compared to what we have experienced. It is truly incredible.
I have tried to drive this home, but I’m sure few here have ever tried to borrow money from an energy bank to buy a lease. So I’ll describe it in terms I have also used before.
It is like loaning a guy another $100,000 on his house, when he already owes $400,000 and the house, which was worth $450,000, is now worth $200,000. And part of what is loaned is just so he can pay the interest on the $400,000 loan.
I am not exaggerating
IMO.
Shallow, thanks and very valid points.
As you point out those reserve estimates comes with an oil price (assumption). The higher the oil (and gas) price the higher the estimated reserves and vice versa. This by itself tells us something about the general mechanisms at work, at high prices the debt burden per barrel (still in the shale) is “low” and “high” with low oil prices.
Further the debt burden per barrel increases as long oil is extracted without reducing the debt in the same proportion (all things others equal).
Reserve estimates do not move linearly with the oil (and gas) price.
We have other data also. Most shale wells (call it the average) has a predictable production profile and thus it is possible to come up with some reasonable estimate of the EUR (it is not perfect, but the best we have available).
The below is on a point forward basis.
I found that for a type (pro forma) well having a first year total of 60 kb it would likely be profitable (7% return on investment) with an oil price of $90/b (WTI).
At $60/b (WTI) it needed a first year flow of 90 kb.
(Numbers are approximates and needs to be checked and revised according to the most recent data/information).
At some very low oil price (could be $30/b??) there is just very few exceptional wells that would be profitable. We have the distribution of wells according to their productivity and it is also possible to identify the most productive pools/fields.
Just a little added into what is (admittedly) a comprehensive task/exercise, but hopefully could add another dimension to understanding the magic of shale economics.
Rune, I looked at Whiting and Halcion, did not have time to look at others.
Both have debt to reserves ratio numbers that are weaker than Continental.
shallow,
I think and favor a simplistic and robust approach as a first run.
Debt data (gross interest bearing) and reserves data are readily available for companies with heavy exposure to Bakken LTO. Thus: $debt/barrel (in the ground)
That gives one parameter (easily accessible for anyone interested).
The second metric I would look at is the ratio of debt to quarterly/annual net cash flow from operations (ex CAPEX!).
This metric gives some idea about how serviceable that debt is and also an indication of what CAPEX capacities the company has from net operating cash flow.
For what it is worth and just from browsing the data it looks like Hess, Marathon, Oasis, QEP and WPX has put on some (very) good wells in Bakken in recent months.
Hi all,
I also wondered if the new wells were declining faster so I looked at monthly well profiles for 2014 and compared with the annual well profile for 2013. In early 2014 (Jan to May) the first 3 months of output was somewhat lower than June to Nov 2014. In Dec and Jan the first few months of output was similar to early in 2014 and then in Feb 2015 the first 3 months of output were higher. The well profiles for the first 4 months are very erratic, which makes the model (which assumes a relatively stable well profile) inaccurate.
Chart below uses the data gathered from the NDIC by Enno Peters and the vertical axis is barrels per month and the horizontal axis is month from first output. The well profiles are for North Dakota Bakken/Three Forks wells.
Also note that the first two months of the March 2015 profile are similar to the Jan 2014 well profile (dashed red line) and the first month of the April 2014 well profile was only 8000 barrels per month. The jump higher in February may have been a temporary spike. Perhaps this is the beginning of the saturation of the sweet spots, or it may be a temporary set back like in early 2014, it is much too early to predict.
In the chart below I show well profiles for 2013, 2014-2015, 2013-2015, and 2008-2012.
Clearly something changed in 2013 from earlier wells. I am going to use the 2008-2012 well profile for that period of my model ( a lower well profile is used for wells from 2005 to 2008 and wells before 2005 are estimated rather roughly.) For 2013 and later I will use the 2013-2015 well profile as an estimate, but the fluctuating well profile over the 2013-2015 period (especially 2014) will lead to a mismatch of model to data.
Using the well profiles from above and assuming the 2013-2015 well profile follows the 2008-2012 well profile after 18 months (an optimistic guess), the Bakken output would look like the chart below if 140 new wells per month were added each month until Dec 2016 (also optimistic).
Thank you Enno Peters for the data and thank you Rune Likvern your Red Queen series, which my simple model is a pale copy of, any mistakes in this simple application of Rune Likvern’s previous work are mine. Note that if the future Bakken/Three Forks well profile falls back to something like the 2008-2012 well profile, then 140 new wells per month will not be adequate to keep output at 1100 kb/d. In that case we might need 150-160 new wells per month.
Hi,
I have updated the yearly production profiles and they actually look quite interesting. I grouped the years 2008 and 2009 together and 2010-2102 together. The years within those groups have similar profiles and it was too hard to read with too many curves.
First of all you can see that 2010-2012 has higher initial production than 2008-2009 but also higher initial decline rate. After month 23 they seem to be identical. If you look at cumulative production up until month 28, it is 129.500 barrels for 2008-2009 and 133.400 barrels for 2010-2012. Thats a difference of only 2.900 barrels. So for the years 2008-2012 it looks like the ultimate recovery will essentially be the same.
Then looking at 2013, the initial production is even higher and so is the initial decline rate. After 12 month the curve seem to follow the 2008-2009 curve. Will it decline very slightly more than 2008-2012 and the ultimate recovery will turn out to be the same or will in continue to follow the 2008-2009 curve? Time will tell. Up until month 16 it has recovered only 8.000 barrels more than 2010-2012 and 11.000 barrels more than 2009-2008. So the difference does not seem to become more than that.
Finally for 2014 the initial production is just a bit higher but the decline rate continue to increase. Especially if you look at the first 3 months of 2014 you can see that the initial production is the same as for 2013, but already after 5 months it is bellow the 2013 curve and after 10 months it is lower than the 2008-2009 and 2010-2012 curves. As the spacing between that wells get shorter it has been expected that the ultimate recovery should decline. My guess is that it started to decline already for the wells drilled 2014.
Looks to me like a typical Bakken well will recover an additional 150 to 250 thousand barrels of oil after the first five years. Maybe they’ll recover something like 200 thousand in years 1 to 5 and an additional 200 thousand in years 6 through 25. But by 2035 oil prices should be a lot higher. Which may extend well life so it can recover an additional 25. Are the companies developing the bakken estimating 400 to 450 thousand barrels per well?
You are an engineer, I am not. It may appear that 1/2 of recoverable reserves in this type curve can be recovered from year 6 thru 25; I don’t buy that. If I was an engineer I could explain it properly. It has to do with gas expansion drive mechanisms in shale and depleting reservoir energy, non-Darcy flow in hydraulically induced fractures, increasing GOR, what will happen to water saturations, wettability and the lack of connate water, at least in the Eagle Ford. For a shale stripper well to be operationally economic, on artificial lift, a lot of things have to come together perfectly and nobody, I repeat nobody knows how this shale stuff is going to behave at year 15.
I do not believe in 25 year type curves for these unconventional wells. My instincts tell me shale wells will not be economic after year 15 short of 1o0 dollar oil prices. I would not buy a shale well after year 10, whatever the cost.
Mike
Hi Fernando and Mike,
For the first 5 years the average 2008-2012 ND Bakken/Three Forks well cumulative output is 194 kb. A hyperbolic decline profile with b=1.4 is used to 78 months (6.5 years) and then exponential decline at 10% per year is assumed to 23.75 years, at that point output per well is at 7 b/d and I assume the well is shut in at that point. EUR=345 kb.
The 2013-2015 average well has higher output over the first 18 months (13 kb more cumulative) so the EUR 360 kb for those wells.
Mike, I simply eyeballed the decline curve. I have a pretty good eye for those curves. The decline rate is lower than 10 % at the tail end. I believe these wells may go into the 7 % decline region.
In that case Dennis would have to correct his 10 % decline factor (I also use 10 % if I don’t know any better, but those well curves do show very low declines around month 60, so we ought to consider a hard data point rather than rules of thumb).
The lack of water doesn’t really matter. And all the other factors are included into the decline rate, except for two or three that I can think of: the wells can interfere in the future, the water salinity is so high the wells scale up as pressure drops, and the artificial lift can’t pay its cost and the well life reaches a premature end. I guess time will tell.
I think water will matter, in fact; too much and the well will reach its economic limit sooner. Too little and the recovery mechanism over the last 15 years of the well’s life will be little more than well bore storage. “…all other factors are included in the decline rate..,” sorry, that is the conventional way an engineer would look at an unconventional situation like rod lifting pooped out, <0.1 md shale from 9,000 ft. TVD.
Take a look at AlexS's well profile for a typical EF well, below. The long, flat tail on that type curve is just a bunch of wishful thinking, IMO.
Mike, the recovery mechanism seems to be depletion drive. Are you saying the water comes from an aquifer? If the water comes from within the tight zone being depleted by the well then water production is fairly irrelevant unless it costs too much to lift and dispose. What are you hearing about this topic to make you think this way?
Fernando, I believe the drive mechanism is more gas expansion, actually. There are no “aquifers” above or below the Eagle Ford. I don’t know about the Bakken. “If the water comes from within the tight zone…” is the 64 dollar question for me.
These beautiful hyperbolic decline curves with long sweeping tails that go out to 25 years the shale oil folks shove down our throats look like water-driven clastic sandstones in the Miocene to me. I don’t buy that. Over time, will fluid conductivity to the horizontal well bore in these shale wells diminish with pressure depletion, at a constant OWR, until the well makes 16 BTFPD with a 50% OWR or will WOR increase incrementally at a perfectly predictable annual rate until the well reaches it’s economic limit at 225 BTFPD with a 4% OWR; I don’t know.
It’s easy to plot decline curves. Its harder to envision how the well will actually decline; what’s it going to look like at year 18? That’s the operator in me. I don’t buy into the long tails, that’s all. Its just an opinion.
Mike
Gas expansion in an under saturated oil reservoir is part of the depletion drive mechanism. In these reservoirs the flow paths may be so tiny the gas doesn’t move like it does in a normal reservoir. But it’s still depletion drive. I can envision the well will decline, including the heterogeneity effects as well as the transients. The hyperbolic decline is exactly what one expects in these circumstances. Once we have a trend there will be risk, but one has to use what’s available. If somebody computes for me ln(Q66/Q54) for at least 500 wells I think we can pin down what a future decline curve will look like.
Hi Fernando,
For ND Bakken/Three Forks 2008 and 2009 wells (847 wells total), I did LN(Q65/Q53) because month 65 was the last month of data,
the result is -0.1565, so roughly a 15.6 % decline. The linear fit for month 38 to 65 on LN(Q) vs month gives an annual decline of about 13%.
Chart shows 11% decline for month 39 to 65.
Edit:
Rookie mistake. The monthly decline is 0.011 or 1.1% per month, on an annual basis (I am not just multiplying by 12), the decline rate is 12.4%.
Hi Fernando,
I most certainly do not have your experience looking at such decline curves, in the past you had thought the 10% decline looked reasonable. I will defer to your expert judgment (though I consider Mike an expert as well, and he seems to disagree) maybe a compromise of 8.5% exponential decline would make sense?
At 7% the EUR30 of the average 2008 to 2012 ND Bakken/TF well is about 394 kb and is still producing at 7 b/d out to 31 years. This seems too optimistic to me.
Data for average of 420 2008 Bakken/TF wells below:
month _ 2008
1 _ 7575
2 _ 9955
3 _ 7873
4 _ 6924
5 _ 6581
6 _ 6174
7 _ 5776
8 _ 5468
9 _ 5282
10 _ 5021
11 _ 4861
12 _ 4796
13 _ 4666
14 _ 4475
15 _ 4335
16 _ 4203
17 _ 4068
18 _ 3974
19 _ 3841
20 _ 3608
21 _ 3451
22 _ 3349
23 _ 3258
24 _ 3152
25 _ 2991
26 _ 2927
27 _ 2770
28 _ 2802
29 _ 2682
30 _ 2607
31 _ 2532
32 _ 2478
33 _ 2431
34 _ 2381
35 _ 2343
36 _ 2210
37 _ 2141
38 _ 2102
39 _ 1962
40 _ 1974
41 _ 1965
42 _ 1959
43 _ 1982
44 _ 1972
45 _ 1983
46 _ 1886
47 _ 1877
48 _ 1892
49 _ 1889
50 _ 1845
51 _ 1863
52 _ 1831
53 _ 1808
54 _ 1739
55 _ 1692
56 _ 1670
57 _ 1648
58 _ 1666
59 _ 1628
60 _ 1579
61 _ 1565
62 _ 1510
63 _ 1506
64 _ 1443
65 _ 1475
66 _ 1484
Chart plotting natural log of monthly output vs month (data above) shows annual decline of 14%. A 7 % exponential decline seems too low.
Dennis, what’s the difference bewptween your data and FreddyWs plot? I eyeballed that to be less than 10 %.
Hi Fernando,
Freddy might be including all North Dakota wells in his plot. Today that does not make much difference, but in 2008 the Bakken wells were a smaller proportion of the total wells drilled in North Dakota.
I am guessing here, but my plot is Bakken/Three Forks wells only for 2008, if I combine 2008 and 2009 as Freddy did the annual decline rate falls slightly to 13%.
Does the 10% exponential decline still seem unreasonable? If it does, what about 8.5%?
A 7% exponential decline just seems overly optimistic, and as you know I am not as pessimistic as you are in general.
Hi,
No my graph should only show Bakken/Three forks wells. I have 901 wells for 2008+2009. So a few more wells though for some reason.
Hi FreddyW,
Thanks. I strip out confidential wells that are older than 6 months, so perhaps that is part of the difference in well count, and I also ignore leases with more than one well because figuring out the starting dates for all wells on the lease (well #1 might start production 12 month before well#2, it is hard to pin this factor down).
I also remembered my well count incorrectly it is 897 wells for 2008-2009, so only 4 wells different from your count.
What was your monthly output for the 2008-2009 wells for month 64 (or your last month) and month 52 (or 12 months earlier than your last month)?
Ok then we are very close. I have 49 bopd for month 64 and 57 bopd for month 52.
Hi Freddy W,
Thanks.
Fernando was looking for LN(month 64 output/month 52 output) and using your data we get LN(57/49)=0.1512, or a 15% annual decline rate over those 12 months (from 4.67 to 5.33 years.)
Not sure if Fernando would still think these wells would decline at 7% per year, to me even a 10% decline looks optimistic, but I will defer to the judgement of Fernando, Rune, Mike, and other experts.
Hi Fernando,
An excel file with 2008, 2009 and 2008-2009 average Bakken/Three Forks well data is at link below:
https://drive.google.com/file/d/0B4nArV09d398WnkxLVJYS0dPTkk/view?usp=sharing
Also you can copy and paste 2008 well data from the comment above (if you don’t trust google drive).
Chart was unreadable (for Bakken decline plot) so I will try here. Annual Decline rate is 12%.
If that line holds then it’s 12 % and they are in deep doodoo. I think it’s safe to conclude they need to figure out how to drill cheaper wells or else wait until oil prices are back over $100 per barrel.
Hi Mike,
Doesn’t $100/b in 15 years seem reasonable. Unless we have a severe recession in the interim (always a possibilty, but as difficult to predict as oil prices) I think we will be looking back at the good old days when oil was only $100/b (2015$), I think oil will be at least $150/b in 10 years time ( when most of the early LTO wells will be 15 years old).
You are correct that we only know what will happen through about 7 years for Bakken wells and about 5 years for Eagle Ford wells. I think the Eagle Ford wells will be done after 15 years, but the Bakken wells may make it to 23 years (for the average well if the 10% exponential decline guess is correct).
I expect oil prices will increase as the LTO plays lose steam.
Fernando. The State of North Dakota has a PDF online which summarizes Bakken production since the discovery well in the 1950s. There were not many wells drilled until the late 1970s early 1980s. There were horizontal wells drilled in the 1980s and early 1990s. I think those were mostly drilled in other formations, not in the Middle Bakken or Three Forks.
Yes shallow, but I’m not sure why you mentioned it?
Hi Fernando,
For the Bakken we only really have data out to about 5 years for 2008 and 2009 wells (many of the 2008 wells look like they were refracked at around 66 to 70 months which distorts the data after month 65.)
There has been an increase in the number of frack stages from about 20 in 2008 to 30 or more by 2013, I would think this might affect the decline curve. My guess is that more oil will be extracted over the first 18 months and that there is a possiblity that exponential decline will be steeper than the 2008 to 2009 wells which had fewer frack stages and lower cumulative output over the first 18 months of production.
Would your expectation be that the decline rate of the tail would be unchanged?
Depends. Anything done to bring oil to the front does reduce the tail. I would even argue that putting well’s on choke may increase recovery. On the other hand heavy oil will show a higher recovery factor if the foamy oil kicks in and the well is produced with very large drawdowns. So this is a bit of an unknown to me. Conclusion: assume if they peak more at the beginning their recovery will be similar, until you have hard data.
Hi Fernando,
Sorry for dumb questions, but sometimes you assume I know more than I do, so I wanted to be clear.
My data for more recent wells shows the same as what FreddyW’s data shows (the recovery for months 1 to 18 has increased in 2013 and 2014 relative to the 2008 to 2012 average well (where there has been some variation, but the cumulative well profiles have been pretty close together over the first 36 months.
In 2013 and 2014 it looks like the cumulative well profile is above the earlier average well profile (2008 to 2012). I will post a chart in a wider area.
Hi Fernando,
To finish my thought (I forgot the question) EUR should remain about the same, unless we have hard data that show otherwise.
If we still like the 10% exponential decline approximation and the early well output has increased by 10 to 15 kb over the first 18 months, we should expect somewhat higher decline rates after month 18, in order for the EUR to remain about the same as the 2008-2009 wells. Is that correct?
Yes.
Thank you Fernando. What about the decline rate? You had asked for LN(month 66 output/month 54 output), which we don’t have, but for LN(Q65/Q53) and LN(Q64/Q62) we get about 0.15 and the regression on LN(Q39) to LN(Q65) vs month gives a monthly decline rate of 1.1% and an annual decline rate of 12.4%.
Yes, I saw that. If the curve doesn’t bend over by the end of year six and approach 10 % then it becomes harder to reach. But it’s important to use wells which have a fairly continuous life. Another possibility is to pick wells known to be in the better areas. If those don’t average even 10 % then they really ought to wait for higher prices.
Hi Freddy W,
Nice analysis, thanks. One possibility is that the poorly performing wells from Jan to April 2014 are dropping the well profile for the tail end of your 2014 well profile, this may just be a blip which will correct over time as the more prolific wells from May to November 2014 have more months of production data. This is why I think we need another 12 months of data, I think it is a little early to make a sound judgment.
It would be interesting to hear what Enno, Rune, Ron, and others think.
Hi Dennis,
My graph contains only complete data. So whats there will not change. The curves will only become longer with more data. But of course it is a very uncertain guess. More data is needed. However the trend is definitely there. The first 6 months have higher ip than the first 3 months. But in months 8 and 9 production is the same as the first 3 months. So for the first 9 month we can see that month 4-6 2014 has higher decline rates than month 1-3 2014 which has higher decline rate than 2013 which has higher decline rates the first 12 month than previous years.
Too bad that there is still a size limit for the attachments. It makes it really hard to read my graph. Will that not be fixed soon?
maybe post to imgur and link it here.
Yes that could be an option.
Freddy, can you process the individual well curves to take the natural log of the ratio of month 66 to month 54 for the oldest wells and run an average?
Hi. I´m not sure what you are after. Why natural log? As I wrote above I have 49 bopd for month 64 and 57 bopd for month 52. So thats 49/57=0,86.
The natural log of 0.86, -.15, is the actual decline factor between those two points. That’s roughly the decline factor during the fifth year of life. Looks like I eyeballed it wrong.
Do we have a large well population with production up to 72 months?
Hi Fernando,
Only the 2008 wells go back that far and a lot of those wells were shut in for a couple of months and then came back online with output 20 times higher than before being shut in (which looks like a potential refrack to me). It is difficult to tease these wells out of the data and when they are left in they distort the well profile after month 65.
The key is to see if they stabilize at a given decline rate or if the decline rate keeps dropping.
I got rid of the wells that looked like they had been fracked around 60 to 72 months after first production.
Only 385 wells are in the dataset and the latest month is 77 months.
Link to file below:
https://drive.google.com/file/d/0B4nArV09d398RTZnZmtPaHpEMGs/view?usp=sharing
For month 60 to 77 the decline rate is about 12%. (monthly decline rate is 1.08%). LN(Q77/Q65)=-0.1025 and a regression on month 65 to 77 gives a 10.6% annual decline rate.
I think it’s better to track these old wells and see if they cross over to have less than 10 % decline? My experience isn’t that good with these wells, but once they cross under 10 % you can be fairly assured the well spacing isn’t causing a problem (it’s a rule of thumb based on my observations, don’t ask me to explain it).
Hi Fernando,
No need to explain. This is the kind of thing that 40 years of experience teaches and that no textbook can teach, thanks!
Would you recommend that I stick with the 10% annual decline (after month 77) assumption for now?
Yes. I would wait until you see 12 months with 10 % decline. At that point you might want to change it to 9 %. I wouldn’t try a full hyperbolic fit, because it may be way too optimistic.
Hi FreddyW,
I re-did some of my charts to do “complete” well profiles, that will not change due to new data in future months (except due to revisions in old data). The Chart below has cumulative well profiles on the right axis (dashed lines) in cumulative barrels of output and the left axis is barrels of output per month. Well profiles are North Dakota Bakken/Three Forks average well profiles for 2008-2009, 2010-2012, 2013, and 2014.
Data in excel file at link below:
https://drive.google.com/file/d/0B4nArV09d398VTNCRF91VjE3RUk/view?usp=sharing
The data looks very similar to my data. I use first production month as zero on the x-axis. Perhaps you use completion month? Anyway they are very close. I think it´s better to only use complete data. Otherwise the graph may trick you.
Hi FreddyW,
I agree on the complete data. I use the first month of production as month 1, I have no month 0, so our months are off by 1.
FreddyW, Dennis and others
I have for some time (as in many years) favored looking at developments for the first 12 months totals with the first 6 months totals as a good leading indicator.
The correlation between those for all Bakken wells started since 2008 and that met the criteria described, was found to be 0.962 (close to perfect and based on reported data as of April-15).
The above has been very robust indicators and for an area as Bakken with about 10.000 wells, statistics is a GREAT tool.
A sample of few wells with little flow historic I found could create a deceptive impression of what was going on. For instance, some very good (or poor) wells at the start of the period could create a false expectation of developments.
One way to go about this is to only include wells with at least 6 months of reported production, preferably 12. So as one moves out along the timeline be aware that the wells with less than 6 months history of flow may contain “noise”.
Hi,
I realize that my latest post could be a bit confusing where “month” could refer either to which month production started or how many months the wells have produced. But anyway, the 1-3 month, 2014 curve has data up until month 13 and consists of about 350 wells. So the number of wells are quite high and there are quite many data points.
Freddy,
As you point out the number within the sample matters.
I have some work in progress (still some outstanding, but the goal is to look at all the companies which since Jan 2008 operates around 500 wells in Bakken (as of Apr-15), which should cover a major portion of both wells and production) and so far what has surprised me is the higher decline rates for newer wells, that is those started since 2014.
Similar trend was noted last year by the EIA in Eagle Ford:
“These higher initial production rates are often accompanied by initially larger decline rates, before gradually leveling off to a consistent level of decline for the remaining years of the well life.
While initial production rates have steadily increased since 2009, first-year decline rates in the Eagle Ford have fluctuated between 60% and 70%. Most notably, decline rates over the second year of production have steadily increased from 30% for wells drilled in 2009 to nearly 50% for wells drilled in 2011 and 2012. Since 2013, many producers have been using significantly more proppant (sand or other material designed to keep a hydraulic fracture open) when hydraulically fracturing new wells, which appears to have increased initial production rates, but which was followed by a steeper drop in production. ”
http://www.eia.gov/todayinenergy/detail.cfm?id=18171
Eagle Ford production per well
AlexS,
Thanks and interesting.
For Bakken decline rates are recently up, if this is a temporarily thing is too early to make a conclusion on.
I just describe what the data shows.
There are several methods of describing this.
The method I have opted for is to look at the decline for all the wells by company and by vintage (full calendar year), like all wells started in 2013 and their collective decline from Dec-13 to Dec-14 and similar, like all wells of 2014 vintage and their collective decline from Dec 14 to Apr 15 (or other).
And these numbers show the decline rate recently has increased.
Runs, run it by well and take the average. If a well doesn’t have production on any month it has to be eliminated. Thus we get the decline rate without any oddities. I have an alternate, run it as rate versus cumulative. Have you tried that?
Fernando, I ran the monthly versus the cumulative (it is a well known method) for a company (with average wells) for several vintages.
It increasingly appears to me as the average well reaches half their recoverable after around 30 months of flow, and 300 kb for the average well increasingly looks on the optimistic side.
Initial flow has improved with the years, but looking at totals this improvement appears to diminish with time.
Hi Fernando,
rate vs cumulative can be done at a single point in time, but I am trying to see if the well profile is changing over time. I could easily do a rate vs cumulative for 2008 and 2009, but I posted a link to the data and you can analyze as you see fit.
https://drive.google.com/file/d/0B4nArV09d398VTNCRF91VjE3RUk/view?usp=sharing
Ok great. I look forward to it.
Hi FreddyW,
I mistakenly read your chart. I thought you had a well profile for all of 2014, and for wells from June 2014 to Dec 2014, we do not have 12 months of data.
My curves are not complete, I average all of the data I have for month 1, all data from month 2, etc, so my curves for 2014 would change from month 5 on as more data comes in for future months, the tails of all of my curves would be affected in this way.
I also have the data for the incomplete months, but have chosen not include them in the graph. As I wrote above, the graph may trick you if you don´t know how the individual months have performed.
Hi FreddyW,
I like your method better than what I was doing and will use it in the future, though I call the first month of output month 1 rather than month zero. Otherwise my charts should match pretty closely to yours.
Hi Rune,
Thanks. Chart below with ND Bakken/Three Forks 6 month cumulative output averaged over 200 wells (centered moving average) for wells starting production from Jan 2010 to Oct 2014.
From 2012 to Oct 2014 the 6 month cumulative has been quite unstable.
Dennis,
The 6 months totals (as for wells started per Nov-14) has wobbled around and recently been on a slight upward trend (this has been observed earlier as well).
The correlation I referred to is between the 6 and 12 months totals, thus I expect 12 months totals for newer wells (those as of Nov-14 and earlier) to come up a bit.
It is the younger wells (less than 6 months of production) it is a bit early to draw any conclusions on, and which will be interesting to follow.
The younger wells have steeper decline rates this may be a natural variation, but clearly affects production.
Hi Rune,
Thanks. In my earlier comment I said the stability of the 6 month cumulative had been unstable since 2012, that was a mistake. The period from May 2013 to November 2014 has been a period of relative instability in cumulative 6 month output relative to the more stable output over the May 2011 to April 2012 period.
I understand that earlier you points to the excellent correlation between 6 month and 12 month cumulative output, I was using your observation to show how 6 month cumulative has varied from Jan 2010 to Oct 2014. I should have continued to November as that is the most recent month with 6 months of cumulative data.
Hi all,
I also looked at the correlation coefficient for 6 month vs 12 month cumulative ND Bakken/Three Forks output for wells which started producing between Jan 2010 and May 2014 (April 2015 data from Enno Peters). This is slightly different from Mr. Likvern’s more in depth look from 2008 to 2014, but yields a very similar correlation coefficient of 0.955 for 6635 individual wells. The R squared is 0.913 as shown in the chart below (I forced the y-intercept to be zero), without doing so the R^2 is the same (intercept is -316 with similar slope(0.6213), if intercept is allowed to float). Chart below.
In order to try to see what has been happening since Nov 2014, I looked at the correlation of 3 month cumulative output to 12 month cumulative output for Jan 2010 to May 2014. The correlation is not as good as the 6 month cumulative vs 12 month cumulative (95% correlation coefficient), but is acceptable at an 84% correlation between 3 month cumulative output and 12 month cumulative output.
This simply confirms what Rune Likvern already told us.
I did a plot of the centered moving 200 well average of the 3 month cumulative output of wells which started producing between Jan 2010 and Feb 2015 and found a 5th order polynomial trendline for this data.
The plot indicates that well productivity has been decreasing since Dec 2014.
Nice plot Dennis
Hi Enno,
Thanks. I realized that the proper way to do the trend line is on the raw data rather than on the 200 well moving average, so that trend line above is probably not accurate. I will try again later with a trend line on the actual well data.
Dennis, thanks.
Your work supports my observations with regard to well productivites for those with first flow since late 2014.
Rune,
I am just trying to keep up, and I appreciate all the great work you do. Thank you.
For the 3 month cumulative well output for ND Bakken/Three Forks Wells starting output between Jan 2010 and Feb 2015, I have found a 5th order polynomial trend line, output has stopped increasing, but only a small decline in output since Nov 2014 has occurred, this may be a pause before further increases or maybe output will level off.
A final chart with 6 month and 12 month cumulative output by month, where each month’s average value is calculated. A third degree polynomial trend line is shown. 12 month cumulative is about 1.6 times the 6 month cumulative output. Correlation between these monthly averages for 6 and 12 month cumulative output remains about 95%.
Enno Peters, yes, various authors have suggested that wells with minimal daily production (stripper wells) may be shut in temporarily or finally in the present low price environment. That might cause a production decline of around 200 000 bopd in 2015.
AlexS, it is nice to see DrillingInfo info. However, they are touting an increase in initial production per well (although it is not clear if the number is first month average or something else) as an antidote to reduced drilling. However, the difference is 5%, whereas the rig count has dropped by 62%.
Keith,
I guess this is average first month production per well, although they do not specify.
In any case, with all the talk in the media about increasing well productivity, the gains are rather modest. We should also note, that these gains reflect concentration in drilling activity in the Bakken sweet spots. Thus, the share of the four key counties in the Bakken rig count increased from less than 80% in early 2014 to 95% in May 2015. The share of McKenzie county alone increased from 30% to 42%
Hi AlexS,
That is an excellent point! One that I am fairly sure that Rune Likvern has pointed out in the past. Much of the well productivity gain is just a matter of companies focusing on their most productive areas. The well productivity gains from June 2014 to November 2014 might be explained in this way.
The subsequent decline in well productivity from Dec 2014 to April 2015 may point to an eventual long term decrease in well productivity in the Bakken/Three Forks, but I still believe that it is too early to make that determination. I think it will be 12 months (June 2016) before we can make that call, possibly later.
If the companies are only focusing on their best acreage, won’t they lose a lot of undeveloped acreage, and therefore PUD reserves? See my post above re CLR acreage and reserves.
Hi Shallow Sand,
I admit that I do not know the rules on that, but I would think that Mike, Fernando, Rune, Doug, Ron and others may know.
And as Dennis Coyne points out (above), the data do not exactly show a smooth progression to better production over time. This is also evident in some of the contractor info available (eg Rystad) which shows that not all plays are improving as they progress.
Solar advocates have found in necessary to go the ” nuclear” route in Florida- meaning to try to amend the state constitution to protect the solar industry from the state public services commission which according to this article is so deep in FPLs pocket not even its nose sticks out.
By law there is a consumer advocate there who supposedly represents consumers. The state supreme court has ruled that the psc is not obligated to allow the staff of this advocate ( a state agency !) to participate in making decisions.
http://www.forbes.com/sites/williampentland/2015/06/13/solar-goes-nuclear-in-the-sunshine-state/?ss=energy
”In Florida, the utilities appear to have captured their regulators decisively. This brings me back to Mencken. It strikes me as deeply disingenuous for FPL to describe the solar amendment as a “constitutional ban on consumer protection.” As far as I can tell, the strongest argument in favor or the solar amendment is that utility regulators – and elected politicians – have systematically denied consumers any opportunity to participate in the democratic process.”
MY personal opinion is that most regulatory agencies that operate mostly out of sight and out of mind are eventually captured by the very businesses they supposedly regulate in the public interest.
Solar advocates have found in necessary to go the ” nuclear” route in Florida- meaning to try to amend the state constitution to protect the solar industry from the state public services commission which according to this article is so deep in FPLs pocket not even its nose sticks out.
As a resident of the ‘Sunshine State’ I found that to be a rather ironic choice of words…
https://www.fpl.com/clean-energy/nuclear/turkey-point.html
Turkey Point 6 & 7
FPL is creating the option to build two new nuclear units at our existing Turkey Point facility.
Clean energy my ass! It is stupid, dangerous and completely unnecessary!
Maybe Floridians need the freedom to democratically vote themselves the right to jump over a cliff. I’ll have to put my Florida house up for sale, I suppose.
Democracies don’t last; they fail as power and wealth increase for a few. John Adams
You obviously support the few… Don’t let the door hit ya on the way out!
http://www.rystadenergy.com/ResearchProducts/NASAnalysis/usshalenewsletter
These data from Rystad’s open newsletter show that there was an improvement in the Bakken from 2012 to 2013 and 2014, but in some of the other main plays, there are reductions in first month average production over time.
Hi Keith,
That report is very good, thanks.
A chart from the report that I found interesting is below, Eagle Ford and Bakken expected to peak around 2017 (I think this is reasonable if oil prices go to $100/b by mid 2016), but note the ramp up expected in the Permian basin, i will be interesting to see if this pans out.
On second thought, the Eagle Ford forecast looks too high to me by about 200 kb/d, I expect a 2015 or 2016 peak in the Eagle Ford and I think it will be 1550+/-50 kb/d.
That’s really a great article with some great charts. However it is dated July 2014, well before the price crash. I dare say that the charts would look a bit different if it were created today.
Hi Ron,
The lower oil prices would change things, but oil prices are likely to rise.
My main takeaway from that chart is that when oil prices rise, we are likely to see an increase in output from the Permian basin, this may offset declines from the Eagle Ford and Bakken and keep US output relatively flat (or maybe even a slight increase of 500 kb/d). We will see when oil prices rise in 2016.
More silly news about that stupid Barbarous Relic…. GOLD
Texas Pulls $1 Billion In Gold From NY Fed, Makes It “Non-Confiscatable”
Texas has enacted a Bill to repatriate $1 billion of gold from The NY Fed’s vaults to a newly established state gold bullion depository…”People have this image of Texas as big and powerful … so for a lot of people, this is exactly where they would want to go with their gold,” and the Bill includes a section to prevent forced seizure from the Federal Government.
Texas Governor Greg Abbott signed a bill into law on Friday, June 12, that will allow Texas to build a gold and silver bullion depository. In addition, Texas will repatriate $1 billion worth of bullion from the Federal Reserve in New York to the new facility once completed.
——————–
With the Chinese and Indian citizens consuming all of the world’s annual gold mine supply and the upcoming announcement by the Chinese that they hold upwards of 10-20,000 metric tons of gold in reserve, it makes a lot of GOOD SENSE that smart folks at the University of Texas Investment Management Co., (the second-largest U.S. academic endowment) are taking delivery and control of their own gold.
Folks… when the GREAT GOLD & SILVER RESET finally arrives, it won’t matter how much paper gold or silver you think you have stored at some bank or brokerage account, but rather how much physical metal you hold in your sweaty palms that will count.
Note: Texas Gov. Abbott stated they were building a GOLD & SILVER DEPOSITORY…… Folks have no idea just how little above ground silver is available.
steve
That’s perfect. You can’t make this shit up.
A billion dollars worth of gold at 1200 bucks an ounce Troy. Let us round it up to 1.2 billion for ease of computation.
One million Troy ounces, times a twenty dollar bill that says ‘gold certificate’ that is redeemable to acquire one ounce of gold on deposit at the US Treasury will have a value of 20 million dollars in 1910 gold backed dollars.
Twenty dollars in 1910 is 1200 in 2015, in pennies, what once required 2000 pennies to equal an ounce of gold now requires 120,000 pennies to equal an ounce of gold. Also known as hyper-inflation.
Whether you call them visionaries or call them chuckleheads–or anything in between–you should tip your hat to the Texas legislature and Gov. Greg Abbott, who have now written fears of a fiscal Armageddon into state law..
Late last week, the Republican governor signed a bill establishing the first state-run gold depository in the nation. The Texas Gold Depository will position itself as an alternative to the U.S. government’s Fort Knox and the vault beneath the Federal Reserve Bank of New York.
Its ostensible aim is to safeguard what its supporters say is $1 billion in state-owned gold bars once they’re retrieved from the Fed’s Manhattan vault, protecting them from seizure by outside forces, like the federal government. (More on that supposed $1 billion in a moment.) It will also hire itself out as a depository for private investors looking for a place to store their bullion, pending the collapse of civilization. in the meantime, they would be able to write checks on an account tied to their holdings.
http://www.latimes.com/business/hiltzik/la-fi-mh-texas-and-the-gold-bugs-20150616-column.html#page=1
I copied this from Euan Mearn’s blog. The article itself is behind a paywall.
It appears that even in Australia wind and solar power will continue to be expanded at a steady and fairly fast clip.
Of course the owners of the coal would rather sell it NOW but maybe they will eventually come around to the Saudi view that they ought to save some for their grandchildren. 😉
xxxx
Australian: Australian jobs blown away as turbines kill coal
Alinta Energy yesterday brought forward by 12 years the planned closure of its ageing coal-fired power plants at Port Augusta, 310km north of Adelaide, and its associated coal mine at Leigh Creek, 260km further north. A “massive oversupply in generation capacity” from wind and solar has reduced its share of the state’s power supply from 35 per cent to 15 per cent in the past two years and created net losses of $100 million. Grattan Institute energy program director Tony Wood said Alinta’s coal-fired power plants were the first to be “pushed out the back and picked off by the lions” as owners assessed viability in an industry making way for a required 6000 megawatts of renewable energy capacity to be built in Australia by 2020. The announcement of the closures came as Tony Abbott declared he wanted to limit the growth of wind farms and their “visually awful” turbines. But he said the move to renewables was inevitable.
Note the last sentence.
I am still trying to find some hard numbers on the loss of efficiency of fuel usage in coal and gas plants when they are cycled to match daily load variations. I know this is done on a regular basis just about every where that there is not sufficient hydro to do the load balancing that way.
So doing it to balance wind and sun that come and go as the weather changes is obviously technically possible and is being done already to a substantial extent where wind and solar power are already built out on a large scale.
What I want to know is this.
How much gas and or coal is saved NET by feeding wind and solar power into the grid? Obviously wind and solar require somewhat more hot spinning reserve than otherwise would be needed. So the fuel savings must necessarily be less than one hundred percent on a kilowatt hour for kilowatt hour basis.
SOMEBODY MUST have this data for at least a few utilities. But it is not easily found , at least not by a layman with very limited search skills.
Mac,
There are many variables that make this complex.
The short answer: for a well run utility and ISO, the cost is very low.
Hi Nick,
Of course the answer will vary installation by installation and it will vary day by day. OBVIOUS.
But it is also obvious that it is very easy for an engineer or bean counter at a generating plant to answer this question. The data must be at their fingertips and easily retrieved with a few keystrokes.
It ” boils down” to this . A cold boiler has to be fired awhile to get steam up again. How much coal does this consume compared to the amount needed to run the boiler steadily for say six hours? Of course a big boiler won’t cool all that much in only six hours anyway- but I am guessing it will take at LEAST half an hour to safely bring one back up to operating pressure from hot idle. A gas turbine started dead cold must likewise be warmed up slowly. If it is kept fairly hot it might take only seconds or minutes to get it up to producing temperature.
I am not an engineer but I know such massive and expensive machinery simply cannot be ramped up fast from a cold start except at high risk of doing it great harm. A busted boiler or turbine is not easily or quickly or cheaply repaired.
SO -I should be able to find this published someplace.
If a big solar farm reduces the need for coal for six hours , enabling the utility to dial back a coal boiler that long, how much of that six hours worth of coal is actually SAVED? My guess is that on average the answer will be in excess of eighty percent.
But the folks who know ain’t saying so publicly.
The reason I want it is to counter the arguments of some anti renewable types who claim there is either NO savings or very minor savings of coal and gas when a utility starts feeding in wind and solar power.
A good ”average” answer would of course require input from a lot of different utilities and would change from year to year as more renewable power is added and the art and science of balancing renewables and ff matures.
If a bunch of capable and dedicated people were to work at it they could dig out an approximate annual answer for the nation as a whole by examining the EIA data provided by Uncle Sam.
Of course the weather would impact this answer substantially on an annual regional basis but it would probably not vary much year to year nationally.
But I am not competent to do it .
Mac,
I’ve seen figures for Ireland (which has a pretty high wind penetration) that cycling their CCGTs off and on more rapidly to balance the wind power has led to a much lower overall efficiency for the gas plants, and as such you do end up running somewhat into diminishing returns in terms of CO2 saved as wind penetration gets higher and higher.
The data in question was this blogpost: http://euanmearns.com/the-balancing-capacity-issue-a-ticking-time-bomb-under-the-uks-energiewende/
CO2 be damned for purposes of my immediate question. No offense intended. I am trying to find out how much oil, coal, and or gas must be burnt to provide the additional ”hot spinning reserve ” necessary to integrate wind and solar into the grid. Or, to phrase my question somewhat differently, how much fossil fuel is SAVED by adding in wind and solar power?
There is some good stuff at Mearn’s blog but the basic focus there is to prove renewables don’t work. I am not too sure the folks who hang out there realize that one , fossil fuels DO DEPLETE and WILL BE running short within their own lifetimes. It is perfectly obvious that the regulars there do not believe in forced climate change.
Any data coming from this source would in my estimation be very likely to be cherry picked to make wind and solar power look as bad as possible.
Having said this much the data does often make wind and solar look pretty bad even if it is not cherry picked.
What I want to know is this. HOW MUCH MONEY does a utility or a country with substantial amounts of wind and solar power integrated into the local grid save on AVOIDED purchases of fossil fuel?
If I possessed better computer skills I would try to come up with my own estimate. But I would rather die than think the utilities themselves don’t know the answer to this question.
And I would be extraordinarily surprised if the various players in the renewables industry do not know it as well. The only reason I can think of that it might not be published by the renewables industry is that it would make wind and solar look bad.
The only real reason that comes to mind the conventional generating industry or utitilies keep this data confidential confidential is that it would make renewables look too good.
CO2 is a VERY real issue of course but talking about CO2 is never going to win over a skeptical business person or right wing political type. Money arguments are different. Show such a person the money and you can communicate with him-ESPECIALLY if it is HIS money.
We all know that conventional coal and gas fired generating plants are ramped up and down continuously over the course of a day to follow the following load. We also know that in a lot of places conventionally fired generation is simply SHUT DOWN on a regular basis , often daily, simply to conserve fuel.
So -WHY THE FUCK , pardon my french, is it apparently impossible to find out how much coal, oil, or gas it takes to keep a plant hot in reserve in comparison to how much it takes to keep it steadily producing?
Of course I understand that a GOOD answer is not going to be available. But some sort of range or rough average should be easily computed – by anybody with the raw data and the right skills.This ain’t rocket science.
I could do it myself for a given utility if I had the fuel burn data, total power out , and power in from wind and solar for a month or two , broken down hour by hour.
Mac,
You’re right – this is not a new question. Here’s an analysis:
“The study evaluated two coal plant cycling protocols. The first protocol (referred to as ‘Curtail’) involves cycling coal plants down to their economic minimum generation levels (shallow cycle) to accommodate wind and curtailing wind in excess of the level needed to meet system load. The second protocol (referred to as ‘Deep Cycle’) involves cycling coal plants down to their lower emergency minimum levels (deep cycle) to accommodate wind and curtailing wind in excess of the level needed to meet system load. While the analysis identified no significant difference in the cost of each protocol, there are advantages and disadvantages to each. The Deep Cycle protocol maximizes wind output while minimizing coal burn and associated CO2 emissions. This protocol may result in reduced system reliability as a result of routinely operating baseload coal units down to their emergency minimum loading levels, a condition which increases the wear and tear on these units possibly resulting in more coal unit outages. In contrast, the Curtail protocol results in slightly less wind generation than the Deep Cycle protocol but avoids deep cycling the coal units and the potential downside of reduced system reliability that may occur under a Deep Cycle protocol. For this reason, the Curtail protocol is being recommended as the preferred operational protocol for the PSCo system in the near term given no distinct cost advantage to either protocol.
This study determined that the cycling and curtailment costs associated with 2GW of wind are $0.77/MWh. Average cycling and curtailment costs in the 3GW scenario are about $0.25/MWh higher than the 2GW scenarios.”
So, $1.02 per MWh, or one tenth of one cent per kWh.
http://www.uwig.org/11M-710E_WindInducedCoalPlantCycling.pdf
Some more thoughts:
Dealing with wind and solar “intermittency” is a design and planning question. It depends on the depth of renewable market penetration; the nature of other generating resources; the nature of customer load; the planning timeframe; the business strategy of the utility; the sophistication of the Independent System Operator; and the regulatory environment.
As a general thing, intermittency isn’t an enormous challenge.
Here’s a really basic and important point: Demand Side Management is very cheap, and very effective, but utilities don’t like it because it’s cheap. It doesn’t require much investment, and most utilities’ profits depend on investment. They prefer to build more generation; buy big batteries; etc.
Look at the evening peak consumption problem: it’s entirely an artifact of flat pricing. If people paid more for power in the peak period, just like they pay more for using their cell phone in peak periods (or used to, before telecom costs fell), that evening peak wouldn’t be a problem.
DSM could be greatly expanded right now, with existing tech and equipment – California, and most utilities, are deep in the middle of installing smart meters. And in the long run, think of the effect of 230M plug-in vehicles with batteries. Let’s say they have an average battery size of 30 kWhs. 230M x 30kWh = 6.9 Terawatt hours. That’s enough to absorb the output of the US grid for 15 hours, or power it for that long. That’s an enormous resource for balancing supply and load, and it’s essentially free to the utility.
Another really cheap and effective tool: improved forecasting. Remember the article about Exelon, and how forecasting completely changed their attitude towards renewables? They were achieving 60% market shares, and expecting to do higher levels soon.
Mac, if I may, I’ll split the answer into four sections:
1. High efficiency supercritical powerplants are very difficult to use as load followers for wind. They are designed to work at very high temperature and pressure, and the metallurgy doesn’t take kindly being cycled. This means they don’t reduce fuel consumption very much as wind takes over.
2. The lower pressure lower efficiency coal plants can cut back a little more, but they are lousy load followers.
3. The high efficiency combined cycle gas turbines don’t load follow very well, but new designs can do some load following.
4. Regular gas turbines (not combined cycle) can load follow like a charm. But they have much lower efficiency.
The effect we see is as follows: if many locations wind blows part of the time at peak load, but part of the time when load is way down. The system has gas turbines to pick up peak, and these can be cut back when the load drops. But if wind capacity exceeds a certain percentage of the total daily peak then the whole system goes unstable and the economics are shot to hell (simply because there’s a need to keep a corresponding amount of low efficiency gas turbines standing by, or the large baseload plants have to keep burning fuel but blow energy out the chimney without generating).
This is a fairly complex system which evidently most people can’t grasp. They can insist on these rather inefficient “solutions” which I see being advocated by the solar and wind industry so they can sell their equipment, or by greens who lack the technical education to understand the grid dynamics.
Bottom line, as we see this utter fantasy take over we will see much higher electric bills as well as severe danger of brown outs, voltage spikes, and power cuts. The inability to integrate renewables at high penetration is what leads nations like Germany to shed electricity to its neighbours, and to build a large number of new coal plants. Buddy, what we got here is like a Cult pumped up by commercial interests and weasel populists.
I’ve linked serious studies about this topic here. And there are a couple of technical blogs devoted to discussing possible solutions to the problem posed by renewables’ intermittency.
Try these links, the first deals with your question
http://judithcurry.com/2014/11/05/more-renewables-watch-out-for-the-duck-curve/
http://judithcurry.com/2014/10/22/myths-and-realities-of-renewable-energy/
http://judithcurry.com/2015/05/31/solar-grid-parity/
This is an analysis of UK wind
http://clivebest.com/blog/?p=5829
Thanks Fernando,I will read these links.
I do appreciate just how tough the problem is.
There is a similarly tough problem involved in switching away from our current industrially based farm economy to something more sustainable.
The people who think it can be easily done don’t have a clue. The switch which must inevitably eventually come is going to be a gut wrenching experience that will take decades.
Sooner or later- my guess is within a couple of decades- gas and oil and even coal are going to get to be prohibitively expensive.
We are collectively are going to have to learn how to get by with a hell of a lot less oil and gas.
Part of the answer is that we are going do do without part of the time. Some businesses and industries will have to shut down intermittently to keep the ones that are critical running.
Over building renewables and building a lot of new long HVDC long distance transmission capacity will help a lot. We have substantially over built many other kinds of infrastructure. We will overbuild renewables too.
The local ready mix concrete plant has seven trucks. Only three of them are used on a regular basis and then only from Monday to Friday. But the other four are kept ready and when the plant gets a big order all seven of them roll out.
My family used to produce many thousands of bushels of apples annually – with tractors and trucks that sat idle six out of every seven days. We could have easily doubled our production without buying more machinery. The last remaining and very busy local furniture factory runs eighty hours a week – not one hundred and sixty eight.
Overbuilding wind and solar power capacity is going to be cheaper than doing without.
Life style changes will help a lot.
New tech and existing tech are going to reduce the need for steady grid supplied juice. Batteries big enough to keep ESSENTIAL appliances such as refrigerators running a day or two will probably be affordable for most westerners in a few more years.Most western houses have ample room for water heaters twice as big and twice as well insulated.
I could build a house myself by spending an extra ten grand that would save back that ten thousand in heating and air conditioning expense within a decade almost any place where hot and cold weather matters. In the USA that means almost every where except Hawaii and part of California.
The inescapable bottom line is that oil gas and coal come out of holes in the ground and the prices of them WILL be going up like rockets as depletion takes a shark sized bite out of the ass of business as usual.
I am thinking a coal cartel capable of controlling the availability of coal on international markets is a real possibility twenty years from now.
Part of the solution is that people living in places such as LAS VEGAS are going to have to just pack up and move unless they are rich. And there will be very little incentive for the rich to stay without a middle and working class.
Speaking as a professionally trained farmer I can assure you that overshoot is a VERY real problem and that we are already deep into overshoot. ( Half or more of an agriculture under grads core courses are pure physical and life sciences courses taught in those departments. Most of the rest are applications of what you learned in chemistry , geology ,biology etc based classes.)
Life is going to be extremely interesting for the next century or so. After that the population will have crashed far enough for things to settle down again.
As far as nuclear power is concerned I think fusion power is the power our grandchildren will be researching rather than using commercially and that just one more major nuclear accident will prevent the building of a new fleet of next generation nukes in time to matter- in the western countries anyway.
I sure hope the Chinese are better at nuclear quality control than they are at consumer good quality control. Chinese motor scooters last on average in my estimation about ten percent as long as Japanese motor scooters.
Given the number of old nukes nearing retirement age and the often desperate need for the juice they produce , the odds seem pretty high to me that one or another of them is going to be kept running a few too many years and will experience a catastrophic accident.
The only thing that scares me more than a big new fleet of next generation nukes is the lack of them.
So – In so many words you tell me and the rest of us what you think the world is going to be like twenty or thirty years down the road. Keep the emphasis on energy.
Hi OldFarmerMac,
The judithcurryblog tends to have an alternative perspective from mainstream scientific thinking in many areas. So I would look for alternative sources of information to get a balanced view. Note that Wimbi seems to be a fairly competent engineer based on his comments and his views are about 180 degrees from the views of Fernando, reality might be somewhere between these opposing views.
Note that as wind, solar, nuclear, geothermal, tidal, wave, and biofuel power ramp up, coal will be shut down altogether. Natural gas power plants that are used currently to take care of peak loads (that can be ramped up and down most efficiently) will be the main source of backup power besides pumped hydro, vehicle to grid, fuel cells and batteries.
When natural gas depletes and becomes very expensive, it will be used less and less as other forms of backup become economically competitive.
For an alternative view point to Fernando’s try:
http://web.stanford.edu/group/efmh/jacobson/Articles/I/susenergy2030.html
and
http://cleantechnica.com/2013/07/21/intermittency-of-renewable-energy/
and
http://www.sciencedirect.com/science/article/pii/S0378775312014759
The clean technica piece is interesting because power company executives that have plenty of experience in power company operations essentially say that integrating renewables is unlikely to be a problem.
In fact Fernando’s complaint that Germany sheds excess power to its neighbors is exactly the way a grid is supposed to work, power is moved around to where it is needed by interconnecting grid networks. Using modern weather forecasting the amount of power that will be produced is very predictable and is no different than trying to anticipate loads which is also influenced by the weather.
“… reality might be somewhere between these opposing views.” I’ll second that.
Whattaya mean” between”? I am totally right as always.
“You cannot predict the future but you can invent it”
Now, it happens that I have already invented the future and here it is, folks. Be of good cheer.
The pope said that global warming was a sin. That did it. People can’t understand science but they have frequent personal experience with sin and get the Pope’s message.
The also get the messages of the climate catastrophes suddenly leaping at them from all directions.
And the mass migrations dumping mobs of strangers on their front lawn.
So they at last do what they should have done from the beginning of time- put the true price on energy and all the other things.
When that done, the soulless bean counters had to be counting beans the new way and behold! the world changed choppity-chop, since everybody wants to minimize costs.
Fossil fuels became WAY too expensive, without any possible wiggle room for debate. No matter there was lots left. All the money tipped out of the ff pot and went into renewable.
Solar/ wind became far,far cheaper and got cheaper by the minute as people got smarter about it.
Intermittency was a non-issue when people started to make things that could coast thru it, like all fridges with an ice storage, all freezers with a saltice store, and so on and on. When the wind died, the fridge quit and waited,
Just like any sane designer would have been doing all along.
Ditto with space heat/cool and a ton of industrial processes.
And every community and even household had a trash-to-electricity genset that took anything burnable and put it into the storage of choice.
Nothing to the landfill, which all immediately recognized as the huge resource mine that it is, and started squabbling over who got to grub it up.
Best of all, people quit doing all the mindless, mostly harmful stuff they used to do, and spent more time doing what really makes people happy, which as we all know, does NOT include making junk to ship long distances to some other trash bin, the only profit therefrom being the rake off of the rake-off parasites of yore.
And so on.
I have the highest qualification for this vision-in it I am safely dead and could not possibly benefit from any lies I might have cooked up on the subject.
One of the things that really makes this example of people happy is beer. Now I’m gonna go get one to celebrate the new future disclosed herewith.
Mind e-mailing me your Warp Drive formula. I want to zip over to another nice planet, one where you get rebuilt and a new 499 year battery: Rechargeable of course. I’ve heard there is a nice spot in Andromeda.
It’s just not possible for people to accept 745 watts/horsepower.
Step 1 of denial is “you can do all that with less horsepower”.
Step 2 is “you don’t need to do all that”.
Step 3 is (ever notice how there is a preference for 3 somehow) “maybe you need to do all that and need all that horsepower to do it, but everyone will cooperatively share their horsepower and avoid all tension.”
Save yourself the ticket to A.
Everything I said is happening right now and right here in my little town. People are serious about it, and doing something.
I went off grid a couple of years ago, but am partially grid connected. Run my whole very well equipped house and car on solar, and pump about 4-5000 kw-hrs/yr back to grid, net.
The fridge, etc storage is easy.
I wonder what kind of non-community you people live in.
Watcher, you keep bringing up the 746 number as if it were some sort of important news. It’s just another power unit, about 3/4kW, every freshman engineering student knows that – sounds awful simple to even say it once.
Hi Doug,
As long as we have engineers with some imagination, we have a shot at solving some of the problems we face.
I am reminded of the quote that Robert Kennedy often used in his 1968 run for the presidential nomination (a paraphrase of a quote from Bernard Shaw’s 1921 play,Back to Methuselah),
There are those who look at things the way they are, and ask why… I dream of things that never were, and ask why not?
Dennis: The curry posts are written by a highly experienced electrical engineer and a physicist who also has an economics degree. I reviewed their work and I think it’s sound. And what they write is purely about the replacement of fossil fuels by renewables. This is about hard core engineering, and project planning. My suggestion is that you start getting educated by reading what I linked and stop reading Cleantechnica, that’s a cheerleading bunny site.
The curry posts are written by a highly experienced electrical engineer
How do you know? He or she is anonymous.
He or she gives no sources at all – these articles are purely opinion, with no quantification and highly unrealistic generalizations about wind, solar and nuclear.
I suppose this is a step up from you making highly unrealistic generalizations about wind and solar, but it’s a very small improvement.
Mac, my new Yamaha Zuma scooter was built in Taiwan. It’s every bit as good as my old Zuma built in Japan, maybe better. The scooters built in Red China—errr, ah, Mainland China are junk.
Oh I have no doubt whatsoever that the mainland Chinese are quite capable of building first class scooters – or just about anything else.
If Yamaha puts their reputation for quality on a Tiawanese made bike you can bet it is a quality bike.
The mainland Chinese scooter industry has not yet consolidated into a few big companies with recognizable brand names. They are still making probably a hundred different makes of scooters, all of which are sold imo on the basis of a flashy paint job and a cheap price.They break down very quickly and getting parts for them is nearly impossible. If you could get parts you would need some every month.
ONE new Yamaha is worth at least five or six new Chinese off brands imo.
Yamaha has dealers and parts. Yamahas last.
Now that’s a real balanced view of things, three links to Climate Scientist turned Denialist, Judith Curry’s blog! She has zero credibility in her own supposed field of expertise within the scientific community, so why should anyone listen to her on topics in which she isn’t even qualified to give an opinion. You call that a serious technical blog?! Laughable!
Hi Fred, Doug, Everybody,
I have found over the years that even the most deluded , incompetent , and or out right crooked people still have something to add to most arguments.
Judith Curry is apparently located somewhere along the continuum between ethical and competent and outright deluded.But whoever she is, it is worth knowing what she says if for no other reason than being able to readily refute her arguments.
I suppose Fernando has a big blind spot as the result of being a career engineer who has always had to pay for things in real time, externalized costs be damned. And the things he has worked on have had to WORK without fail as a general rule.
He does acknowledge the reality of depleting fossil fuels and he does seem to have some potentially viable schemes in mind to produce oil and gas for a long time yet in large quantities – at MUCH HIGHER prices of course.
Reading between the lines I gather that he thinks the overall economy can adapt to super expensive oil. I think myself that the richer and best situated western economies could and MIGHT do so – so long as the decline in supply and the rise in the price of oil both come about slowly over many years.
(My opinion in respect to overpopulated poor countries with little in the way of natural resources I usually sum up in a single sentence.
”Don’t get caught in Egypt.”)
If I were an electrical utility engineer or manager the thought of going too far too fast with renewables and a big blackout resulting would scare me silly.
We need a few Pearl Harbor scale wake up events to get our attention.
IF I were possessed of the power to make it happen I might close off most of the international shipping of oil for a few months or arrange the bombing to scrap metal of five or six of the biggest petrochemical plants in the world.
The damage to the economy would be HORRIBLE – not to mention the loss of life. But if doing so were to get us SERIOUSLY working on renewables on a collective society wide basis the price would be CHEAP in comparison to what is most likely coming later.
I fear we are going to get caught with our pants around our ankles by the oil and gas depletion grizzly bear.
Our gracious host Ron believes a general economic collapse is inevitable. I only differ with him on the EXTENT of this collapse, in the hope it need not be universal.
Curry isn’t a “denialist”. She just left her post as the head of the Georgia Tech climatology department, has published climatology textbooks, and just coauthored a paper on equilibrium sensitivity. She is constantly smeared because she doesn’t agree with Gavin Schmidt on the ECS value, and because she agrees that Michael Mann is full of hot air, and she says so in her blog. Mac, what we have here is an excellent example of the degree of incivility, rudeness, and lack of manners which prevails as soon as an individual dares question a single number. These guys are like the Spanish Inquisition’s cheerleading section.
yes but she is a professor, so clearly not qualified to discuss anything that happens in the real world.
She invites guests posts by engineers who specialize in different fields. One guy who writes guests posts is a solid states physicist, others are statisticians, specialists in data acquisition, etc.
The rather lame brain calling, such as calling her a denier just shows a really medieval tribalism and lack of curiosity. By the way, she is giving a talk to members of the British parliament and she is using this language you use to demonstrate the existent of an organized witch hunt. However, she refuses to consider slander suits, which actually gets her sympathy and a lot more clout. Her opponents should keep using little rabbit pellets. They are counterproductive.
ah, it’s just baloney
Fernando Leanme says:
12/06/2015 at 4:05 pm
It’s baloney. I could tell right away when I saw it was linked to a site asking for donations. And the work itself was incredibly amateurish. This is understandable because we are dealing with college professors. They lack the skills for that type of work.
These guys are like the Spanish Inquisition’s cheerleading section.
Nobody expects the Spanish Inquisition.
https://goo.gl/vHG9RI
As for Curry she has become an ideologically motivated denier of science! Anyone can look up her track record and personal history on the internet. The reason she has lost respect in the scientific community is because she no longer does science, she has become a demagogue. She is far from an honest broker.
She hasn’t lost respect with the scientific community. She is getting hounded by the usual culprits, including Mann and his pack of baying puppies. I had a week long debate with them, and that crowd is pretty repressive, tight with each other, and the kind of people who are easily led into joining a lynch crowd. Mostly a bunch of ill mannered anti social bullies. I follow their twitters, so I know the crap they like to use.
Okay, let’s look at a hypothetical case.
We stop all this fantasy about renewables with their unsurmountable intermittency problems and instead focus on continuing the tried and proven, least cost option. New, efficient, clean, supercritical coal baseload plants are built along with some combined cycle base load and some simple cycle peaking NG turbine plants. Throw in a little additional hydro and some pumped storage for good measure.
In 2020 some of these coal plants will be operating but some will still be under construction but most of the NG plants will be up and running. However in 2020 there are serious issues with oil production worldwide Russia and Saudi Arabia have begun to decline and the US shale boom has petered out. The fact that world oil production is in decline is undeniable. As oil prices spike, there is a mad rush to convert more of the transportation fleet to run on NG and demand for NG spikes as well driving up NG prices. With increased coal demand, coal prices also spike.
At its peak in July, 2008 the average monthly price of Australian Thermal Coal at US$192.86 per metric ton was 470% higher than it’s lowest price between May 2005 and the peak, 40.78 in November 2005. During a similar period the average monthly price of WTI peaked at $133.38, 269% higher than it’s lowest price between May 200d and July 2008, $49.81 in May 2005. This sets a precedent for what might happen when the fact that world oil production is in decline becomes common knowledge some time between now and 2020.
Under the above scenario, there will be serious issues surrounding the ability of some nations to pay for their fuel, especially nations that do not have high value exports or services that they use the electricity generated by the fuel to produce. Pray tell, under those circumstances, what would you recommend for such countries e.g. Pakistan, Bangladesh, Nicaragua, Jamaica, Sri Lanka and the Dominican Republic to name a few?
I know renewables alone won’t do the job for Jamaica (I outlined a possible alternative for you a few weeks ago and you ignored it). You can’t even afford 20 % renewables in the short term. I also know using fuel oil like you do is crazy. So you really need to set up a contract for a private power company to build you a coal plant, make sure it has a long term contract for coal coming out of Santa Marta, Colombia. Meanwhile see if you can get small amounts of renewables, and push for energy saver light bulbs. But you do need to get real, and think about the whole country. You won’t survive if the country collapses in 10 years.
You have not really addressed my point which was conveyed in the following sentence:
Under the above scenario, there will be serious issues surrounding the ability of some nations to pay for their fuel, especially nations that do not have high value exports or services that they use the electricity generated by the fuel to produce.
Let me elaborate. Every solution you have touted involves the use of legacy, fossil fuel burning technology, coal to be precise. Implicit in your suggestions is the belief that, fossil fuels (coal) will remain available at prices below those which make renewables of any stripe, a more affordable choice. Here is where you and I have a fundamental disagreement. I believe that fossil fuel prices will continue to increase and pointed to the experience of July 2008 where, Australian Thermal Coal prices went up by 470%, over roughly the same period that the price of WTI went up by 269%.
On the other hand, I do not find the extrapolations done by Tony Seba of Stanford University that, predict a continuing decrease in the price of renewables, to be entirely unreasonable. In fact, he states in his videos that, if anything, his projections tend to be on the conservative side as, they do not take into account step changes that could occur if technological breakthroughs occur. I also, just below, linked to a flurry of news and projections that came out at the recently concluded Intersolar trade show. If anything the news and projections support Tony Seba’s projections but, in this case, they are coming from people somewhat more intimately involved with the solar/renewable energy industries.
Please, I beg you, tell me what your best estimates are for the price of Colombian coal in 2020 and every five years thereafter, with an estimate of what the price of electricity generated using this coal will be. You might also want to factor in the reduction in demand that is likely to occur as more and more renewables are added to the grid, a phenomenon alluded to in a post by OFM further up.
Just in case you think my beliefs are all pie in the sky, the Fiesta Hotel Group based in Spain saw it fit to commission Sofos Energia to install Jamaica’s largest solar PV plant (1.6 MW) as of now.
The Grand Palladium Resort and Spa in Hanover is set to save over $80 million Jamaican (USD 730,495.98) in energy cost per year from the installation of a solar PhotoVoltaic (PV) power plant by local Solar Company, Sofos Jamaica.
This is the largest solar power PV plant in Jamaica to date and was unveiled at the Hotel on Friday May 30.
This project represented a total investment of 3.4 million US dollars by the Hotel which is expected to see full return on its investments after 4 years and 21.9 million US dollars in energy savings after 30 years.
Maybe you might want to send Fiesta a memo to let them know they wasted their money, since electricity prices have almost halved since this plant has been installed and there is no way electricity prices are ever going to go back up! Incidentally, I had the opportunity to speak to a Sofos engineer at a local renewable energy expo last year, who showed me their on-line monitoring app (real time, on his smart phone IIRC) and told me that the plant is consistently outperforming their projections.
Island boy, and you keep ignoring the key element I mention: lock in your coal price with the supply at Santa Marta. Pay a premium but get them to index price 80 % to inflation and 20 % to USA coal price index. That’s the key.
Look, none ipof what you propose is affordable. You ought to stop that me I myself approach and think about the country. This isn’t about you living in an isolated solar panel equipped house as the country falls apart around you.
You need a fast track get away from burning oil products. You could try for a compressed natural gas supply coming out of a USA port (look up compressed natural gas transport by barge). Or you can try coal with the price escalator locked down. Mix that in with industrial scale wind and you should be able to get help with finance. But you really need serious engineering work done. The only outfit I would trust to do an honest job would be the MIT energy institute. They won’t do for the detail studies but you may get a low price for a one year conceptual guidance document.
Unlike you, I have little faith that many countries, including mine, will be able to work out sweetheart deals with companies/countries that involve access to supplies of fossil fuels, at prices significantly below the market rate going forward. Many countries in the Caribbean are already beneficiaries of one such deal through the PetroCaribe Accord with Venezuela. In the case of Jamaica, your good budy Hugo arranged with his counterparts in Jamaica to have a part of the debt for deliveries of oil to be converted to long term low interest loans. See http://petrocaribejm.org/overview .
While I am not particularly a fan of this special arrangement, I have to acknowledge that it is probably one of the main reasons why Puerto Rico’s energy debts are substantially larger than those of Jamaica. I am also aware that this arrangement has led to a substantial pool of funds being available for public sector projects.
Along a similar vein, as far as your reference to energy saving bulbs goes, the government of Cuba donated four million energy saving light bulbs free of cost for distribution to Jamaican households. This donation resulted in “The Cuban Light Bulb Scandal” where it is alleged that certain persons in government set up companies to distribute the bulbs at a cost to the government of the Jamaican equivalent of over a million US dollars!
I am not particularly proud that my country has to accept these gifts from foreign governments, since we do not earn enough to pay for the things we need outright but, you should know that there are many Jamaicans who do not share my views and think that Fidel and Hugo are great friends of Jamaica.
Why would any party in Colombia be interested in any long term contract to supply anybody with coal at anything other than market prices? Are they worried that prices will fall or that they wont have a market for their coal?
Islanboy, i was in the business for 40 years. Long term indexed contracts have been common in the past. There are huge LNG contracts prepared on such terms (there is also LNG traded in the spot market). I don’t know how much influence you have over Jamaican politicians, but the better option may be to secure some preliminary studies. Talk to the MIT energy institute and offer to pay for a study they can perform over a period of say two years, cost should be about $2 million.
If you wish tell your contacts to write me. I’ve supervised large studies in the past, and I can give them some tips. I don’t charge for this type of mentoring.
I’m also interested to see a side study to consider integrating Jamaica with Cuba using a deep water high voltage DC cable system.
Unfortunately, we have to cross the Cayman trench, but on the other side we have a large amount of land with 1500 to 2000 meter tall mountains.
I would also like to point out that, the whole LNG fiasco in Jamaica started back sometime about 2003 when, a former administration in Jamaica got it into their heads that under the Caricom Single Market and Economy, Jamaican consumers were entitled to access to Natural Gas at prices similar to consumers of NG in Trinidad and Tobago, giving allowances for the cost of liquefaction and re-gasification.
Note that the price of NG in T&T allows their electricity to be priced at some US 3c/kWh, giving their manufacturing sector a substantial advantage over that of the other islands in Caricom.
In trying to research the whole fiasco, I found some interesting articles which chronicle some of the developments with the earliest one dated February 21, 2003, Here they are, listed in chronological order:
Jamaica, T&T in natural gas project
T&T restates commitment to LNG study
The following is a Google search results page as the full article is behind a paywall.
Google results for “Trinidad and Tobago rejects Jamaica’s LNG rate request”
T&T’s LNG back on the front burner
If one reads the last article only, one might get a sense of the reason for my dislike of the idea of purchasing fuels from anybody. On a personal level and on a national level, I would just love to be able to give the middle finger to all sellers of fuels!
Well, I suppose you will agree that asking the Trinidadian government to subsidize gas debt to Jamaica was pretty dumb. And then there’s the future gas shortage looming for Trinidad (I consulted for somebody interested in Trinidad gas and in very familiar with what goes in there).
Mac,
Here’s an analysis:
“The study evaluated two coal plant cycling protocols. The first protocol (referred to as ‘Curtail’) involves cycling coal plants down to their economic minimum generation levels (shallow cycle) to accommodate wind and curtailing wind in excess of the level needed to meet system load. The second protocol (referred to as ‘Deep Cycle’) involves cycling coal plants down to their lower emergency minimum levels (deep cycle) to accommodate wind and curtailing wind in excess of the level needed to meet system load. While the analysis identified no significant difference in the cost of each protocol, there are advantages and disadvantages to each. The Deep Cycle protocol maximizes wind output while minimizing coal burn and associated CO2 emissions. This protocol may result in reduced system reliability as a result of routinely operating baseload coal units down to their emergency minimum loading levels, a condition which increases the wear and tear on these units possibly resulting in more coal unit outages. In contrast, the Curtail protocol results in slightly less wind generation than the Deep Cycle protocol but avoids deep cycling the coal units and the potential downside of reduced system reliability that may occur under a Deep Cycle protocol. For this reason, the Curtail protocol is being recommended as the preferred operational protocol for the PSCo system in the near term given no distinct cost advantage to either protocol.
This study determined that the cycling and curtailment costs associated with 2GW of wind are $0.77/MWh. Average cycling and curtailment costs in the 3GW scenario are about $0.25/MWh higher than the 2GW scenarios.”
So, 102 cents per MWh, or one tenth of one cent per kWh.
http://www.uwig.org/11M-710E_WindInducedCoalPlantCycling.pdf
That study mistates the actual cost. I had to read the darned thing to figure out they assume two types of subsidies kick in to aid the wind case. The better approach is to state the true cost and then list these subsidies or externalities as separate line items. Those subsidies have to be paid by somebody, and the way they are estimated needs to be explained very very clearly. Conclusion: the study fails. I wouldn’t use it as is.
There is a plant cycling component and a wind curtailment component.
Mac is interested in the plant cycling component. PTC and REC values are only included in the curtailment component, which is clearly shown as a separate item.
If you’d prefer to ignore the real costs of pollution (as internalized by PTC and REC values), then if I read it correctly, that would just reduce the wind curtailment costs, reducing the overall cost of integrating wind into the grid.
Hi Fernando,
I guess it depends on how you define a “true cost”. In my opinion the “true cost” includes the external costs. Every study makes assumptions, those assumptions should be made clear. The full social cost of any future choices should be evaluated when deciding the best path forward and policies should be enacted to tax companies for any externalities. When that is done, subsidies can be eliminated.
Dennis, the cost estimate should list clearly what are the actual costs, and if the authors want to list what they think are external costs, as well as subsidies they expect to get, then those need to be listed separately. Lumping everything is pretty dishonest. Furthermore, anybody who accepts a lumped cost needs to have his head examined.
Where do you think comes the cash to cover those “externalities”? That’s chargeable to the end user, or to the taxpayer. And that’s a charge they feel now, not in 50 or 100 years.
I’m getting tired of seeing studies like this, they are worthless. If I had had a consultant or an internal team deliver something like this I would have taken their heads off and displayed them mounted on pikes in the parking lot entrance.
Fernando,
I’m not sure if you’re being disingenuous, or if you just didn’t read the report.
The report took into account actual, current tax policies, for a real utility facing real investment decisions. If you had received a report (back before you retired) that ignored the actual tax consequences of an investment, how quickly would you have fired the authors?
Sort of following on from OFM’s question above, Intersolar, Europe’s largest Solar Industry trade just concluded on Friday. With lots of upbeat news about the industry, I present for your Sunday afternoon/evening reading pleasure:
The pv magazine weekly news digest
Intersolar Europe opened its doors this week, prompting a flurry of bullish solar market reports outlining a glittering future for the renewable energy. That is, if the politicians and regulators play along. Energy storage was one of the most discussed topics (both at the show and in the wider industry), although inverters, India, Britain and the U.S. were also in the spotlight….[snip]
The EES Europe exhibition, which runs concurrently with the Intersolar Show, has grown five-fold on last year, with an entire hall at the Munich Convention Center given over to advancements in storage systems, applications and innovations…..[snip]
Most battery systems cost around $800/kWh today (although Tesla has said its Powerwall system will be more like $500/kWh after inverter costs and installation). By 2025, says Roland Berger, costs could fall to $200/kWh.
“Currently, battery storage would add another USD 0.14/kWh to the LCOE, but this is expected to drop to only USD 0.02/kWh within five years. In Germany, in fact, household solar PV and battery storage will reach grid parity by 2016,” said the report….[snip]
The “massive” price declines have help solar become a cost-competitive energy source, including a 75% drop in PV system prices in the past decade. As such, it should be viewed as a “low risk investment” by the financial community, said the association.
The report added that in several European countries, PV system prices of €1/Wp for installations over one MW below are common, while for competitive tenders, prices of around US$1/Wp are not unusual. Declining module prices outside of Europe have helped to lower costs – minimum import prices on Chinese modules to the EU “have maintained prices at a higher than market level” – as have falling prices for inverters….[snip]
Overall, global solar market growth up to 2020 will be uncertain, but PV capacity could reach between 70 to 90 GW in 2020, say analysts. The right frameworks and market design need to be in place. If not, the market could stumble, said the association earlier in the week in its comments on growing the solar market to 2020.
Utility-scale solar is expected to drive growth, due to its increased cost competitiveness. In the rooftop sector, self-consumption is said to be becoming the “backbone” of distributed PV development.
Geographical changes
Marking a significant change from just three years ago, Japan, which connected around 9.7 GW of PV in 2014 is set to boost global solar growth, as is the U.S., which added over 6.5 GW last year. In Q1 2015, it installed 1.3 GW, according to figures from the U.S. Solar Energy Industries Association (SEIA) and GTM Research, which added that solar energy accounted for 51% of all new energy generation in the quarter.
Based on its latest Solar Deal Tracker, also released this week, IHS says more than 32 MW of utility-scale solar projects – over 5 MW in size – are currently under development or construction in the U.S. as companies hurry to complete them before the ITC deadline on December 31, 2016……[snip]
Overall, however, China, which has recently raised its PV installation targets to 17.8 GW, is set to lead the solar charge. In the report released by SolarPower Europe, the association said China had installed 5 GW of PV in Q1. Achieving this year’s target, it continued, will be contingent on a number of factors, chiefly “unlocking” the distributed market.
The PV Market Alliance added that China could remain the top PV market until the end of the decade, unless India manages to play catch up.
India’s bright future
In Bridge to India’s India Solar Handbook, also released at Intersolar, it said the country’s growing solar capacity could see it enter the international top five. For this year, it estimates growth of 250%. It added that while 2014 saw only 3 GW installed, it could increase this to 100 GW by 2022.
Speaking to pv magazine at Intersolar, Gyanesh Chaudhary, the CEO of Vikram Solar further said that India’s module manufacturing capacity now standing at almost 3 GW and that the country’s solar manufacturers had “come of age”.
Increasing solar importance
In its report, SolarPower Europe notes the “key” role solar has played in helping the renewable energy industry overtake nuclear power for the first time in Europe.
Solar is said to cover more than 1% of current world electricity demand. Specifically, says SolarPower Europe, it is meeting over 7% of demand in Germany, Italy and Greece. Across Europe, solar accounts for 3.5%, while a total of 13 countries are said to be meeting 1% of their energy needs with the renewable energy. For the last five years solar PV, along with wind and gas has been the most installed source of electricity in Europe.
Thanks for this link, Islandboy.
It is hot and sticky and Sunday afternoon so I will be in my easy chair all day and will read it in a few minutes.
”Solar is said to cover more than 1% of current world electricity demand. Specifically, says SolarPower Europe, it is meeting over 7% of demand in Germany, Italy and Greece.”
Greece and Italy have a good solar resource. Germany is a poster child when it comes to being a poor place to install solar but methinks the Germans are scared of having to import depleting fossil fuels from enemies old and new – as well as pinning a lot of hopes on maintaining their exports based economy going forward by exporting wind and solar equipment and services.
I am unable to find the necessary data and manipulate it to get an answer but I am ready to BET good money that the NET cost to Germany of subsidizing solar power until NOW will be recovered by saving on the purchase of imported oil and gas within a decade.
A lot of interesting things posted here.
Bottom line, of course, is that oil companies drill, complete and operate wells to make money.
Can pretty well see what our first 6 months is going to be, know how much the oil check will be and what payroll, electric, chemicals, insurance and other big expenses will be.
Bottom line, in first half of 2015 we are going to make about 11% of what we made first half of 2014. That is all income, less all expenses, CAPEX, OPEX, everything.
For perspective, imagine you had a great year at your job and made $200,000. Now this year you are looking at $22,000. Hard to get efficient enough to pay the mortgage, food, utilities, etc, with that big of a shock to the system.
So I guess we, including me, can analyze this stuff in a hundred ways. Bottom line, all oil producers have taken a big hit.
The public companies have to put forth happy talk. I would too if I were them. It has been a rough 6 months in this industry. Hope it gets better, and doesn’t stay the same or get worse.
I guess in line with us, here are some earnings for 2014 and projected on the NASDAQ site for 2015:
SM Energy. 5.64. -.03
Marathon Oil. 1.70. -1.23
EOG. 4.95. .11
Whiting Petroleum. 4.15. -.59
Continental Resources. 3.43. -.02
ConocoPhillips 5.30. .40
Hess. 3.98. -3.22
Apache. 5.94. -1.17.
Anadarko. 4.13. -2.19.
Pioneer. 4.74. .52.
I have discussed here that GAAP earnings are very misleading, that most are burning through much more cash than the earnings show.
Interesting to note that the earnings consensus for 2017 for these companies is close to actual 2014 earnings, so apparently analysts see $100 oil in 2017.
shallow sand
You are right, GAAP earnings could be misleading. It makes sense looking at operating cashflows and capex
Indulge me one more time today folks and thanks in advance if Ron posts another lead article before I get back to say thanks later.
Does any body know of a site that has posted a fairly comprehensive list of technologies and strategies that will be useful in dealing with peak fossil fuels?
I have in mind something fairly detailed rather than just generalities.
I am working on a book and don’t want to miss anything if I can help it.
OFM, Get one of these: http://www.terravivos.com/secure/quantums.htm
Perhaps A Start:
http://www.independentlivingnews.com
http://www.offgridworld.com
http://theeconomiccollapseblog.com
http://offgridquest.com
http://offgridsurvival.com
http://modernsurvivalblog.com
If you haven’t seen it you might want to check out DO THE MATH by Tom Murphy. No math to worry about and an easy to read physicist’s view. I like it. Subtitled “Using physics and estimation to assess energy, growth, options.
http://physics.ucsd.edu/do-the-math/
That do the math is pretty good. But the posts are really really long.
Sadly, Tom’s articles, while fun, aren’t very useful. He insists on killing strawmen, like infinite growth of commodity consumption, or enormous grid batteries for seasonal renewable lulls.
Try the MIT papers and articles about energy, you can search using “MIT energy”.
Here’s a simple article, it’s nice easy reading
http://www.technologyreview.com/featuredstory/428145/the-great-german-energy-experiment/
A report about solar energy
https://mitei.mit.edu/futureofsolar
Managing large scale renewables penetration
https://mitei.mit.edu/publications/reports-studies/managing-large-scale-penetration-intermittent-renewables
Nuclear power.
https://mitei.mit.edu/publications/reports-studies/future-nuclear-fuel-cycle
While you are at there are hundreds of more recent papers in the MIT library.
In the renewable energy world things are changing very fast something written in 2010 0r 2011 might not be quite up to date in terms of the state of the art technologically, the costs and the political and economic implications…
Here’s a sampling of three that I found interesting.
http://ceepr.mit.edu/working-papers/
WP-2014-006
A Framework for Redesigning Distribution Network Use of System Charges Under High Penetration of Distributed Energy Resources: New Principles for New Problems
Ignacio Pérez-Arriaga & Ashwini Bharatkumar, October 2014
Abstract | Full Paper [PDF]
WP-2014-005
The Remuneration Challenge: New Solutions for the Regulation of Electricity Distribution Utilities Under High Penetrations of Distributed Energy Resources and Smart Grid Technologies
Jesse D. Jenkins and Ignacio Pérez-Arriaga, September 2014
Abstract | Full Paper [PDF]
WP-2014-004
Modeling Intermittent Renewable Energy: Can We Trust Top-Down Equilibrium Approaches?
Karen Tapia-Ahumada, Claudia Octaviano, Sebastian Rausch, Ignacio Pérez-Arriaga, April 2014
Abstract | Full Paper [PDF]
That’s too specialized. I think it’s better to get a broad view of what has been going on.
Per this article, the Director’s Cut for the April North Dakota data isn’t going to be released until Friday, June 19th. Also, for the first time in, I believe, years, Lynn Helms won’t be doing a press conference this month to discuss the newly released data and take questions from the media.
The director’s cut won’t be out until Friday, June 19th? That don’t make any sense. I guess the reason he is not doing a press conference is that he doesn’t have anything optimistic to say.
Does Pinker reference both LeBlanc and Keeley? If so, then it’s still a cherry-pick. A circular reasoning from Pinker’s bible. Hell, you even quoted another bible here yes? Yikes!
But in any case…
If you are re-contextualizing and decontextualizing people (and everything else) in part by gutting their communities; putting them into governpimp-policed/wardened/sherriffed zoos/cages/farms/parks and drawing down their planet to, in part, ‘throw Monsanto/factory-farmed ‘meat’ & ‘veggies’ at them through the bars of their cages to pacify them’, and plowing their planet into oblivion for that zoo-park– which includes deep-sea drilling and fracking and whatnot– and kicking the can down the road to potential statistical fat-tails for all kinds of increasing violence and die-offs (Did Pinker write his most recent work with ISIS/ISIL/IS around?) of both species and humans, then I think it’s more than fair to ask that question. As you would seem to do well to yourself. Possible answer (say it fast, no pause-brakes):
‘All-over-the-fucking-place-wake-up-Ron.’ 😀
It also got ‘moved-forward’ (like debt, like the proverbial kicked-can-down-the-road) as well as displaced through eco/community draw-downs and plunders; human-cages/parkland; Walmarts/developer shlocks, and various other industrial ‘short-term-only pacifiers‘; threats of violence, such as by gun-toting granddaughters, and generally those toting guns/handcuffs/battons/tasers/pepper-sprays/etc.; poverty and land-grabs and suffering from stuff like those (yep, those are violent, just maybe not by Pinker’s potentially-blinkered/hypocritical standards/statistical cherry picks/etc.)
Pinker’s ostensible cherry picks seem partially along the lines of that tribes-in-question were not technically or entirely hunters-and-gathers, not entirely ‘prehistoric’, and many seem to think that agriculture played a large role in increasing violence as well as diminishing health and ecosystem vitality. There are other problems as well that I’ve read.
The domino comic is highly relevant in these and many other contexts. such as you’re turning the living planet into a park/relative-dead-zone to ‘help quell violence/danger/scariness/etc. in every living thing’…
To extinction.
Loose translation: ‘I will now place my head firmly up my ass where Caelan’s comments and some other elements of reality are concerned.’
You can rationalize that away if you wish, Nick G– the lack of ethics and other apparent logical problems in this, your statement– as long as you don’t truly believe it for yourself, or expect other, more enlightened, ethical people to swallow it.
Pinker and his gang maybe would have us all living in a real life (death) version of The Truman Show.
…Paying taxes like good little prostitutes, be shiny, happy and ‘just so’, and of course smile for the CCTV’s in your washroom mirror.
I think I kind of did.
This guy seems to have some of you, ideologically– by ‘symbolic power’– by the balls. Firmly.
(Looks a tad like Pinker, now that I think about it, if maybe with less of a hairdo.)
Try to move. You can’t, ay? Hahaha…
Or if you can move, then maybe it’s because you and your world have been/is being ecologically and ideologically (etc.) castrated. (Seems to make sense.)
To Change Everything
Does Pinker reference both LeBlanc and Keeley?
Pinker does not mention LeBlanc. I don’t remember if he mentioned Keeley. But LeBlanc does mention Keeley in two places in his book. Keeley’s book came first, then LeBlanc then Pinker’s two books. But all three make their arguments on different evidence. Of course you would not know that because you have read none of them.
Your anarchist link “To Change Everything” proves that you are an ideologist. Ideologists always put their ideology over any and all evidence. I was reminded of you this morning while watching “Meet The Press”. Bill Clinton was talking about the Republicans and their “Trickledown Economics”, saying it has been tried and has never worked. But this is the line by Clinton that reminded me of you:
Their convictions are so great that they are undeterred by evidence.
Are you being deliberately obtuse?
Violence happens– we kill for and eat meat– and I am uninterested (to put it mildly) in being caged by your own apparent particular brand of ideology because it’s not only unethical, and impinges on my freedoms, but is an unfolding disaster.
What part of unfolding violent disaster do you not get, Ron?
I mean, we’ve spoken about this to death here and on TOD, which is why I am astounded that you really give a shit about Pinker’s findings in this light. Do you suddenly not care about the planet? Don’t need any more nappies?
It’s like, who gives an academic shit, in a sense, about about prehistoric human violence when we are often-violently offing Mother Earth– which includes us– in a slow death of a thousand cuts? In a sense this whole Pinker/LeBlanc/Keeley past-violence thing is academic/trivial/moot. Assuming they are even correct.
Pinker: “There is less per-capita violence today than in any questionable time-period researched, as per limited evidence, dubiously-interpreted by our team of state apologists.”
Caelan: “What lot of good that does us if there is still more violence today, ay? Even by your own questionable standards? In terms of absolute numbers on the same-size planet? Population 7 billion and counting?”
Pinker, and/or those bouncing off his work (and vice-versa), appear to be comparing apples to oranges.
Look Caelan, I really don’t give a shit about your ideological bullshit. The idea that we can change everything and make it a better world by adapting your anarchism is just stupid beyond belief. Ignorance gone to seed.
I am interested in Pinker because I am interested in human nature. I have been a student of human nature all my life. I know that people, at an early age, adapt a “world view” that usually stays with them all their life. In perhaps 99% of the people it is set as if in cement.
I am interested in what will happen, not what you think could happen if only everyone adapted your philosophy.
What I really don’t give a shit about Caelan, is your philosophy.
Bye now.
Then maybe it is simple ethics, like pure participatory democracy or legitimate authority, you don’t give a shit about.
Maybe you think bombing/threatening people into submission at home and overseas is the way to go, like what you paid through the nose in taxes for the Iraq fiasco that’s still going strong(er). The beloved State in action.
And ethics, whether you want to believe it or not, is tied to the well-being of the planet, thus, to us, our communities, to a stable culture, not one that collapses all the time.
And ironies of ironies, if we continue to live this coercive/systemic-violent deathstyle and can’t wrap our heads around something like anarchy(/permaculture) anyway, then we will likely get it, or something like it, if we’re lucky, when the dust settles. (And that’s what I have in part been suggesting. I have no illusions that we can achieve it, just that we must try, as per ethical responsibility. It seems less of an ideology per se, and more of something borne of a sound moral compass.)
And then I guess our descendents, if we are to have any, may get a sense, first-hand, if humans were more violent then as now.
Oh if only I had a time-machine…
“Bye now.” ~ Ron Patterson
Bye-bye… Have a peaceful, anarchist week.
Ron is right – F-CK you!!
Acknowledging The Arrival Of Peak Government
“The predominant Western model of governance assumes, incorrectly, that a ‘separation of powers’ within the State will limit the State’s appetite for control…
…elites within the State — systemically protected from the risk created by their policies — will experience a rising sense of omnipotence as their private power rises in tandem with the State’s expansion.
These powers also offer State elites a way to radically lower their own risk and dramatically increase their private gain by leveraging the State’s vast powers to their own private benefit.
…not only does each agency and branch of the State seek to expand its reach and power, so, too, does every individual within the State who can leverage the power of the State to protect his/her own individual gain…
There is a great irony in this concentration of power in the State: the power is concentrated to protect the citizenry from predation and exploitation, but that concentration becomes an irresistible attractor for all those seeking to increase their private gain via monopoly, cartels, collusion, fraud, and other forms of predation.
The wealth that can be concentrated in private hands is not limited or self-regulated, and so private concentrations of wealth inevitably exceed the ethical threshold of individuals within the State… and become the financial equivalent of cancer…
Rather than protect the citizens from exploitation, the State’s primary role becomes protecting the private gains of elites who have taken effective control of the State’s vast powers…
This dynamic creates a positive feedback loop (i.e., a death spiral) of higher taxes and lower investment in productive assets.” ~ Charles Hugh Smith
A simple question: how does anarchism deal with a shortage of resources? When an autonomous anarchist commune experiences few years of bad harvest, and their children are starving, how do they deal with it? Have a discussion on whose kids will die and whose not? And suppose there’s another commune nearby, which has enough food, what do the anarchists do? And I mean this as a serious question.
Hi Strummer,
While it may be a simple question to you, the answer may be complex. (I have seen something similar to an answer before some time ago which I might try to track down.)
In any case, while I will try to respond as best as possible when/if I have the time, I would encourage you and/or whoever else to look into the answer for yourselves in the mean time, if you haven’t already.
One off-the-cuff suggestion might be to cross-reference ‘The Parable of The (violent) Tribes’ with ‘anarchism/anarchy’ and see what comes up, and maybe attempt to enlighten some of us hereon with it, since, for one, some things are everyone’s problem, not just mine.
At the same time, I have finished Permaea’s first edit and have resubmitted it for publishing consideration as an article for The Permaculture Research Institute of Australia’s blog. This ‘manifesto’ touches on similar issues and would be worth letting this blog’s readership know once it’s up, whether at that site or elsewhere.
Incidentally, I lost count how many war-scenes of Ukraine in the news (generally, Russia Today’s) consisted of older people left behind, some sobbing in the dark of some basements. I also seem to recall reading something–perhaps Dmitry Orlov’s work– about older people being some of the more vulnerable in collapse scenarios. What with peak oil and peak government presumably being around the corner, and what with some people, such as hereon for example, apparently depending on BAU/gov’t for pensions and various government-dispensed benefits, this might explain some, say, peculiarities, hereon.
you’re a fanatic.
Thanks! ^u^
Here’re some nice quotes for you as a gesture of appreciation:
“The cost of sanity in this society, is a certain level of alienation.” ~ Terence McKenna
“It is no measure of health to be well adjusted to a profoundly sick society.” ~ Jiddu Krishnamurti
“It is just as difficult and dangerous to try to free a people that wants to remain servile as it is to enslave a people that wants to remain free.” ~ Niccolò Macchiavelli
“…when the police enforce the law, they do so unevenly, in ways that give disproportionate attention to the activities of poor people, people of color, and others near the bottom of the social pyramid. And when the police violate the law, these same people are their most frequent victims…” ~ Kristian Williams, ‘Our Enemies In Blue’
“Premise One: Civilization is not and can never be sustainable. This is especially true for industrial civilization.
Premise Two: Traditional communities do not often voluntarily give up or sell the resources on which their communities are based until their communities have been destroyed. They also do not willingly allow their landbases to be damaged so that other resources—gold, oil, and so on—can be extracted. It follows that those who want the resources will do what they can to destroy traditional communities.
Premise Three: Our way of living—industrial civilization—is based on, requires, and would collapse very quickly without persistent and widespread violence…
…
Premise Ten: The culture as a whole and most of its members are insane…” ~ Derrick Jensen
Strummer, if you are reading this; Premise Two seems to somehow partially address your question.
HI Caelan,
xxxx
Loose translation: ‘I will now place my head firmly up my ass where Caelan’s comments and some other elements of reality are concerned.’ xxxx
You really ought to think a little once in a while. So far as I can tell the only person in this forum interested in your drivel is YOU.
I used to say your heart is in the right place to indicate a little sympathy for your obvious idealism.
Of all the people who have ever commented here in this forum you are one of the two with their head the FARTHEST out of sight. The other thankfully is gone.
Any attempt to reason with you has about the same chance of success as reasoning with a mule.
Argueing with a fool or a true believer is a total waste of time.
How old are you, mac?
Incidentally, just a friendly reminder that this is a Peak Oil blog.
Obviously Peak Oil has nothing to do with anarchy. Peak Oil might cause anarchy, but it definitely won’t be Caelan’s buffoonish version of it.
Your silly idea that converting to anarchy will solve the worlds problems is receiving no support.
If you don’t have any new arguments to make, I think we have all gotten your point.
thanks!
Old enough to know better than to respond to you again so long as you do not insult me personally. Being an old and irascible southern mountains hillbilly, and proud of it, I am more or less culturally conditioned to respond in kind and escalate..
You need to remember to take your meds. Otherwise the nice fellas in the white coats are going to be coming for you.
If you and your father who you have mentioned you are taking care of live on governpimp/governnanny (disability, pension, etc.) benefits in a commonly-gutted uncommunity full of wage-slavery and those who don’t know how to farm, make/build for life’s basic necessities, or do much of anything else for themselves, and you see your own mortality approaching in a dubious world/dystem/anti-utopia such as this, then I can understand and empathize with some of your glaring irrationality. I sort of use ‘anarchy’ more as a convenience for now, but still… It would seem that some people are letting ‘Fox News’ or even some kinds of bibles do some of their ‘thinking’, defining and writing for them.
And, since you’re talking meds, I haven’t forgotten mentioning my ongoing self-study of wild edibles and medicinals and you suddenly making offerings of joining you on the farm. Did we also talk about poppies & growing them? Opium? Painkillers?
Over here, yesterday, while waiting for the ferry, I noticed a sign/expression posted in the window of a boat docked nearby: It said, “Born to hunt, forced to work.”. Funny how it appeared just like that to me just now in the face of a blog that seems to have fallen off the deep end or at least become increasingly narrow. A blog predominantly of pensioners perhaps.
Anarchy is about equality, legitimate hierarchy, peacefulness, resilience, sustainability, true community, taking care of each other and so on. It is not Fox News’ or other old faded hackneyed and/or bible-thumping versions of ‘chaos’. Chaos, if anything, is the State, in a manner of speaking.
Anarchy has every relevance– and vis-a-vis this system/BAU that you and others now seem to cling so tightly to, desperately even, perhaps with some fear– to peak oil.
Global peak oil is right around the corner yes? 3 years or so or almost now? Then what? What happens after that? We all drive our EV’s along a glittering rainbow and into the sunset?
Fernando you are a fool.
I have offered many people an opportunity to visit our farm free of charge. A few have accepted. Most are too busy.
You are the only one whose invitation has been withdrawn. When I made it , I was still of the opinion that maybe if I could talk to you in person I would be able to GAIN something from the experience- that we could both gain something.
That invitation was obviously one of the biggest mistakes I have made in a long time.
Now as far as poppies go -you better hope you can manufacture your own pain killers if society collapses and you get your anarchy.I am hoping for the continuation of business as usual and being able to get my physician to inject my bad knee with cortisone and draw off the excess synovial fluid in hopes of avoiding getting an artificial knee.
If bau collapses I am prepared to do the best I can using the remedies my seven or eight times removed grandmothers used – including home grown opium- if I ever succeed in locating some real opium poppy seed.
IF bau does not collapse then I will not actually make any.
Business as usual is keeping ME alive. Business as usual is keeping my Daddy alive. He would be in agony from rheumatism and various other ailments without modern medical care.Life is tough when you get close to the century mark.
Having an electrical grid and air conditioning is VERY nice when it is ninety five outside and humid- as it was a couple of hours ago. It is still over ninety.
If the grid goes down I will have to move him into the basement of the large barn to keep him cool in this sort of weather.
Yes both of us are on SS and Medicare etc. I can and still do enough work to support both of us – assuming no really bad luck on the health front. Before too much longer I will be too old myself to do much physical work.
I am also a rentier class filthy capitalist piglet and make a habit of robbing a few tenants a third of their income for the privilege of living in rentals that I built PERSONALLY with hammer and saw in hand. So I am not apt to starve.Rich I am not but neither am I impoverished.
My tenants are free to go live in the little house on the rock in the lake you seem so fond of. I ask only thirty days notice of intent to move out. Getting back and forth to work and a grocery store in that little boat would be lots of fun on a cold rainy windy day.
Fortunately I will be able (hopefully ) to supervise for some years yet and expect to have a couple of wage slaves or sharecroppers living in little tin houses on the back forty with outside plumbing only and working daylight to dark for me for food and cigarette money-if bau collapses.
You wouldn’t know sarcasm if it bit off half your ignorant backside but everybody else in this forum will understand I am making fun.
You aren’t just a fool. You are a WORLD CLASS fool.
If you cease to mention me I assuredly will not mention you.
Otherwise I am not very busy right now long since having reached the age at which strokes and heart attacks are very real possibilities if you exert yourself in the heat. So I mostly stay inside on days like this.
And being a Scots Irish hillbilly I enjoy a fight or argument just for the sake of participating in it.
But right this minute until dark I am going out to water the new fruit trees etc.. The view is fantastic and it is dead quiet except birdsong in the orchard.
I have a comfortable chair to sit in between times moving the hose and a paper back copy of Victor E Frankel’s ” Man’s Search For Meaning” in my back pocket already.
Frankel is a man who knew a few things about violence.
“Fernando you are a fool.” ~ old farmer mac
Some of us left name-calling, etc., back in high-school, old farmer mac (and they were better at it) but if you’re going to do so, one would think (aside from I), that you’d at least get the name right, assuming of course that you are referring to someone other than ‘Fernando’.
Otherwise, you would seem to fall even further under your own ad-hominem label, yes?
And speaking of which, and for someone who declared in writing that he would make an effort to ignore ‘Fernando’, your success is really quite remarkable.
“And being a Scots Irish hillbilly I enjoy a fight or argument just for the sake of participating in it…” ~ old farmer mac
So you want to argue or ignore? Make up your mind. It sounds like you are having an argument with yourself as you cultivate your particular brand of personal PR for the gullible and masterfully-contrast it with another. We are not worthy! LOL
Unlike some people– maybe you too– I prefer arguments in the mutual interests of getting at truth, as inconvenient or hard to handle as it might be for some.
Your previous mention hereon of some notion of yours of moving to Canada aside, I will assume you got it good, and the Canada angle was really just sarcasm, you ‘filthy capitalist piglet’, you. LOL
“You are the only one whose invitation has been withdrawn. When I made it , I was still of the opinion that maybe if I could talk to you in person I would be able to GAIN something from the experience- that we could both gain something.” ~ old farmer mac
Really ay?! Love the comedy!
I have to wonder how much of what you write you actually believe and/or think about before you commit it to text.
Might be even more interesting if you hit the poppies…
Well you know, I had thought of inviting you over for a “Three’s Company” (wink-wink nudge-nudge) gay marriage to myself so you could get citizenship here and I could Italian one-arm salute the governpimps in one fell swoop, etc.. So we’d have both the US, the farm and Canada! ^u^
But you are the only one whose invitation is withdrawn.
Remind me again why am I getting called a fool?
Fernando, since OFM was replying to Caelan, I think he meant to say Caelen.
RENEWABLE POWER
Most commentators and articles referring to the intergrating of renewable energy into main power grids seem to have very little knowledge of the complexities of electrical power management and the effects of severe weather on wind turbines and solar systems. Gear box failures are so prevalent that the German Insurance industry now mandates gearbox replacement every five years. At over $300,000 a pop plus the removal, that is quite a cost. To think that you can just put a lot of solar power from single phase homes or installations into 3 phase power grids without complications is to show a lack of understanding.
Severe weather can cripple any wind turbine or solar array – most of you in the US might remember the big blackout in the Eastern US and Canada in 2003. The primary reason apart from the severe ice storms causing falling trees to short out power lines was the lack of REACTIVE POWER available to control the voltage which caused power failures to cascade throughout the grids tied in those areas. Wind turbines and solar cannot provide Reactive Power other than on a limited basis as it does not travel well.
You cannot have large amounts of imbalance on different phases otherwise you shear generator drives. Contrary to general belief it is not low or nil wind that causes problems with wind power but severe thunderstorm and hurricane conditions that can destroy them or cause them to close down with winds above about 55 m.p.h. Some years ago all wind turbines in South Australia closed down when temperatures rose above 42C for a prolonged period as this caused overheating and started fires and below certain low temperatures close down limits also apply, especially with ice imbalance.
I will do a post for Ron soon with links to expert article to back up the above remarks
RJK,
Totally agree. Furthermore… the full energy EROI cost for solar is much lower than previously thought.
Charles Hall and Pedro Pietro wrote a book on the EROI of Spain’s Solar Industry. They calculated it was a hefty 2.45/1 when considering all energy costs.
Makes you wonder how low Germany’s Solar Industry EROI is when considering its sunshine and climate is less ideal than Spain.
Steve
That value of 2.45/1 is way higher than Hall’s calculation for ICE powered transport from oil which is a whopping 0.6/1.
Much as I like Charles Hall’s general approach, after reading some of his papers on solar EROEI, I became disappointed. He and his colleagues are using economics to calculate energy comparisons. Using payback times to calculate EROEI does not make much sense to me and leaves large room for error.
EROI has real potential to be a useful metric, but at the moment the methodology is so fuzzy and flawed that people can twist it to get out whatever conclusion they want. The more papers I’ve read on EROI, the less certain I get about more and more of the results.
Yes Sam, it gets even crazier. Solar panel life is calculated to 80 percent of original output, which is about 30 years. Imagine if oil wells were shut down below 80 percent of their original output, that sure would change the ultimate recovery.
When pumps break down, pipelines fail spilling all over the landscape or water and trucks or trains break down; that is not counted against the oil energy. But if windmills break down, whoa baby, they are unreliable and expensive.
If refineries are wrecked by storms or covered with ice and can’t operate that is OK and not even considered. If similar things happen to wind turbines or solar panels, that is a reason not to use them.
With that sort of logic, since houses burn and sometimes destroyed by storms we should not have houses.
We’re allowed to have endless discussions about depletion, bad oil economics, AGW, raping the land with tar sand development, etc. but it seems as though you don’t want to hear any comments about any negative aspects of renewable resources. I’m relatively aware of the problems being imposed on our planet via the exploitation of fossil fuels but I’ve also seen the ecology of major river systems destroyed by hydro electric projects, to provide one example. Or, is that a taboo subject?
I’ve also seen the ecology of major river systems destroyed by hydro electric projects, to provide one example. Or, is that a taboo subject?
I have to agree! I’ve seen it first hand in Brazil. BTW, I’d hope no subject is ever taboo! In terms of ecological destruction there are hydro electric projects that are worse than coal.
http://amazonwatch.org/work/belo-monte-dam
Doug, we were talking about what is included in EROEI not freedom of speech. Solar and wind are apparently held to a much higher standard when comparisons are made to fossil fuels, a typical tactic to suppress. I can understand that since so much money and careers and politics is invested in fossil fuels. Spin, spin, spin.
As far as the lifetime of the panels goes, I can maybe forgive that, since we’ve not yet got much long-term data on comercial plant operations to try and figure out % failure rates and so on. But yes, lots of scope for people’s personal biases to shine through.
You mean ‘much higher’ don’t you?
No… LOWER.
Ok, thanks!
I have a 58 year old MF Tractor that refused on Modern Gas-o-line, but with
tweaks and additives it now runs. It was not Easy.
Most domestic loads are single phase. 🙁 North America is a Single Phase motor Haven. AC Units, Sewage & Pool pumps, etc. A 10kW PV System is not a problem when many houses in the South have 20+kW Resistive Strips in the HVAC that Slam 0-100% with frequency. The Power Co’s Love these. Most PV Systems over 15kW are 3 phase.
A simplification from SMA on Reactive Power, but there are multiple solutions from many vendors.
Reactive power made easy:
http://www.sma.de/en/partners/knowledgebase/sma-shifts-the-phase.html
Note this works at NIGHT also.
http://www.sma.de/fileadmin/Partner/SMA_Connect/WP_QATNIGHT.AEN132110W.pdf
I scanned something recently about the grid-tied issue– possibly as an article over at The Permaculture Research Institute of Australia’s blog.
In any case, I really wish some people would cream a little less over their technofetishes and more over fundamental resilience, which seems more of a priority, like maybe along the lines of that Maslow’s hierarchy of needs thing.
Most commentators and articles referring to the intergrating of renewable energy into main power grids seem to have very little knowledge of the complexities of electrical power management and the effects of severe weather on wind turbines and solar systems.
Yep, however that doesn't include the CEOs of power companies and most of them are on record for the feasibility of integrating renewable energy produced by wind and solar into the main grid. Technology continues to change very rapidly. They are also on record as being aware that the full cost of fossil fuels will continue to become more and more expensive as time goes on and all of them have said that there will be a carbon tax in the works within a few years and they are calculating that into their future expenses. Someone provided a link to an an interview with some of those CEOs upthread.
As for storms and hurricanes, well they are a fact of life where I live and from what I have seen in the past they massively affect the current grid with or without renewables. BTW in Florida at least all solar arrays on rooftops have to be able to sustain 150 mph winds, that would be a Cat 5 hurricane. I can't imagine that commercial installations have less rigorous requirements.
To be honest it really gets tiring to hear over and over again how difficult all these problems are to solve. Well duh! No one has suggested life in a Peak Oil world would be a walk in the park! However there are plenty of reputable people who are working hard to develop technologies that will allow us to depend less and less on fossil fuels. My suggestion is that people also start reducing their own fossil fuel footprints as well!
BAU was fun while it lasted but the bills are coming due and the piper will be paid one way or another.
Utilities tend to go along with the flow as long as they get to make their costs and put a profit on top. California’s request to put on a $2 billion set of batteries didn’t meet many objections, they just went out and started buying batteries, and the California ratepayers can eat the cost. At some point in time they’ll realize they have screwed up their economy. But hey, it took the Russians 70 years to get rid of communism.
Steve,
http://www.nrel.gov/wind/pdfs/41548.pdf Note the conclusions from all their tests at the National Renewable Energy Laboratory at Colorado. The designers don’t understand the dynamics of Thunderstorms
Fred,
Isn’t it wonderful that you can’t kept a conversation on track and be polite. I never mentioned fossil fuels or carbon taxes nor do I think it is great to burn coal so much, or have to burn such a lot of oil the way we do and waste it like your country does with your high 19 million barrel per day usage. But I have lived in the real world and operated complicated electrical systems and I don’t believe for one moment that so called CEO’s of power companies have said that or, if understood, intended to say that, because the physics of electrical power say you can’t intergrate large amounts of DC power and intermittent power into grids and keep them stable. Three phase AC power needs frequency, voltage and phases within quite fine tolerances to keep the grid stable. It is not like pouring water into another jar of water. Do you have any comprehension of what I said about Reactive Power? Whether it is tiring to hear about the solving of these problems or not there are some things in physics which just are what they are. As far as solar panels are concerned it doesn’t matter so much what the wind speed is, if they can stay secured, but if they get hit with six inch hail they are finished and that is what you can get with really big storms.
BP Oil with their solar division, if they still have it, would only guarantee their panels against hail up to one inch. How do you think a panel would handle something the size of grapefruit? I would like to see other forms of power and solutions help us to change but other then newer reactors with 4th generation type Thorium systems it is very hard to see what will power our world in a few short years.
I know wind and solar won’t, not because I don’t want them too but the physics tells me they can’t
You wouldn’t think that a hailstone the size of a soft ball would rip a hole through the roof of a steel grain bin with six gauge sheet metal, but it can and has. Makes a nice sized hole to let in some sunlight.
Only a few dozen out of millions of panels were damaged during “Super Storm” Sandy.
I have no source. It will be Interesting to see when a Cat 4 or 5 Blow hits the Gulf coast.
New Orleans now has thousands of RoofTop PV Plants. PV Panels are Cost Effective Cladding considering building heat gain in the South. A 320W Utility Panel is Under $250 in Quantity. It’s possible the extra 3-5 lbs/sqft may keep roof from blowing away or limit the penetration of flying branches. Flying trees – Forget IT. Replacing Panels on Rails is Easy compared to dealing with roof leaks which will quickly trash a dwelling.
Hi RJK,
I am neither an engineer nor a physicist but I do communicate with people in both professions. I believe there are at least as many physicists who believe wind and solar CAN get the job done as there are who do not.
No well informed renewable energy advocate thinks renewables are going to support our current day business as usual economic model. Your objections are those of an engineer who says”’ I can’t- given current budget restraints and or current reliability restraints.” ”I can’t- there is not enough high voltage long distance transmission capacity.” ” There is not enough conventional or pumped hydro to load balance.” ” There are no suitable sites available to build more pumped hydro.” ” THAT particular technology is too expensive” . ” The customer will sue us unless our service is very close to one hundred percent perfect.”
Inch sized hail is actually pretty rare in most places. If panels are destroyed by hail they can be replaced quickly and easily – the rest of the solar farm would be ok. The customer will get used to some service curtailments. HVDC lines WILL be built. Better and cheaper equipment to convert low voltage dc to high voltage three phase will be designed and will be built- and the price of it will fall like a rock as production is scaled up.
We have a fairly good sized window of opportunity remaining to work on the transition. Every ton of coal, every cubic meter of gas saved is a ton or meter that can be used to EXTEND the life of our finite supply of fossil fuels.
I readily agree that the OWNERS of backup generating capacity must be fairly compensated for their investment and for current and future operating expenses.BUT the capacity needed to back up renewables basically already exists to a very large extent. We are getting nearly all our juice from the EXISTING fossil fuel and nuclear industry. With demand flat or growing slowly I just don’t see building some additional gas fired peaker plants being that big a deal.IF we use wind and solar to the extent we can there should be plenty of gas to run these backup plants for decades to come – for as long as they are designed to last perhaps?
Now here is an argument involving costs that I have NEVER seen refuted by ANYBODY.
When we generate five percent ( and we are either there or very close ) of our electricity using wind and solar then we are saving pretty close to five percent of the money we must other wise spend on DELIVERED coal and gas. That adds up to a hell of a lot of money on a nationwide basis in a year. That savings will be realized again and again in CASH for the life of our EXISTING wind and solar farms.
But that is not all. When you reduce the demand for a commodity the price of it tends to fall. I have not been able to come up with any hard figures on HOW BIG this effect is but I believe the impact on the price of coal and gas is already significant and growing all the time.This savings is obviously distributed across the entire economy given that so many people buy gas to heat their homes or run their businesses and farmers buy so much in the form of manufactured nitrate fertilizers etc. Everybody uses steel. Cheaper coal means cheaper steel.
If the grid is it exists today cannot be upgraded to handle substantially more renewable power then we will have to scrap the parts that can’t be upgraded and start over. WE just don’t have any choice except nukes or doing without.
I am not especially opposed to nukes but I doubt very seriously that enough will be built soon enough to save our collective butts.One more serious accident will delay the issuance of new nuclear construction permits in western countries five or ten years.
Utilities are not gods but the people who work for them tend to think they are, that the utility must have complete and total control all the time. That model worked for a long time , and it worked quite well.
But control is passing to the customer now, to a substantial and growing extent.
I have been conducting an informal study of what a typical small business person or home owner can do to live with intermittent power for several years now and the possibilities are nearly endless. Two thirds of the intermittency problem can be dealt with at the consumer end of the grid excepting heavy industry.
It won’t be fun but we will learn to deal with intermittent electricity shortages the same way we have learned to deal with traffic jams, crime, sick kids , and a million other problems.
Unbiased information regarding heavy industry is hard to come by but I believe a good many industries will be able to successfully adapt to intermittent power shortages if it means getting their power cheaper most of the time.Maybe the ones that can’t adapt will have to move to places with lots of hydro capacity or countries with lots of nukes.
Amazing, another it can’t be done. I guess all those reports I read about Germany, Portugal, Spain, and Denmark must be pure BS. Just stuff made up to make solar and wind power look good but of course the power is really made from fossil fuels. The thousands of wind turbines and millions of solar panel installations are there just for show, they would crash the grid if ever actually used.
I’m glad the truth has been brought out. We should all prep our caves now and pay no attention to those solar farms and giant spinning windmills, just another conspiracy by the environmentalists.
And how does saying “…three phase AC power needs frequency, voltage and phases within quite fine tolerances to keep the grid stable…” translate into saying: “…another it can’t be done? I know Dutch engineers responsible for offshore wind turbines in the North Sea who are frequently citing serious problems but they’re not saying it can’t be done. I for one am interested in what this guy has to say because I care about real life issues as opposed to cornucopian dogma.
“because the physics of electrical power say you can’t intergrate large amounts of DC power and intermittent power into grids and keep them stable.”
Proof is in the pudding.
Reactive power is merely the phase changes in current and voltage that happen when alternating power is applied to capacitive or inductive loads. Nothing new.
Yes, if it were only that simple. Reactive power flow strongly influences the voltage levels across a network and both voltage and reactive power flow must be carefully controlled to allow a power system to be operated within acceptable limits. This is NOT easy to do.
See below.
Power factor off Unity, I and V out of sync. You derate for the max as you move away from Unity. The 50/60 Hz grid is one big wondering monster dynamic LC Circuit pull-pushing on/by megatons of spinning Armatures at base frequency plus harmonics.
1% Fuel Shortage? Really Ugly !
PV Source circuits must be derated by a 1.56 Factor in the NEC. Why 1.56 you ask? – Just Because its Solar Stupid !
Portugal power. http://www.centrodeinformacao.ren.pt/EN/InformacaoExploracao/Pages/EstatisticaDiariaDiagrama.aspx
Spanish Wind Power
https://demanda.ree.es/eolicaEng.html
Denmark power graphs
http://www.emd.dk/el/
as far as I can see it solar and wind can be installed up to a certain fraction of the total desired capacity. Spain sacrificed 50 % of the available hydro to make space for very expensive solar. Wind gets backed up mostly by gas turbines. One can conclude the system is working well, but it’s way over designed, and future renewables increases are going to be extremely expensive to achieve. This means there is almost zero chance that Spain can achieve those eu targets now that the economy is growing at 3 % per year. I wouldn’t bring up Spain to debate wind and solar applicability, it’s fairly unique because it has the best solar exposure in Europe and pretty decent wind, plus it has nuclear and a very good set up of gas turbines, plus a connection to the French grid.
Hi Fernando,
I think that Europe and North America, China, Japan, and developed Asia and much of South America can interconnect their grids using HVDC and eventually get to 50% penetration of widely dispersed wind and solar power with hydro, nuclear, vehicle to grid, fuel cell, battery, and natural gas backup.
As experience with these systems is accumulated and natural gas and coal prices rise, engineers will figure out how best to deal with grid stability issues and the grid will be upgraded accordingly. Demand management and peak power pricing along with efficiency improvements and thermal storage will also be used in response to higher energy prices in general.
You often say this won’t work in developing nations, this is correct, those nations will continue to use a mix of with higher fossil fuel power generation as developed nations lower the costs of renewables and work out any system bugs.
At some point the costs of renewables will fall below the cost of fossil fuel generation and the technology will be transferred to currently developing nations.
Nobody is claiming this will be easy, only that over time (30 to 50 years) it can be done.
Dennis, forget a South America interconnect. There are too many political and physical barriers. I’ve never said 50 % penetration is out of the question. But the renewables incentives put in place are incredibly stupid, and it should be evident that set up is going to cost a bundle.
One of the big problems I see is the interference of an emerging renewables lobby which has a voracious appetite for subsidies. Another problem is the sheer volume of non technical cheerleading crafted by amateurs (of which Cleantechnica comes to mind).
Hi Fernando,
I agree the subsidies are not great policy, but in the absence of effective taxation of externalities, it serves to level the playing field.
When externalities are properly taxed, then subsidies can be removed and we can let the market work.
Assuming that climate sensitivity is low, as Lewis and Curry do, will lead to an underestimate of external costs of carbon emissions. A mid-range assumption for TCR (1.8K) is more sensible in my opinion.
Nobody is claiming this will be easy, only that over time (30 to 50 years) it can be done.
My thoughts:
1. Solar and wind are being done right now. Solar in particular is the best energy source right now in some situations (e.g., no grid and no easy access to other fuels).
2. As fossil fuels become more scarce and more expensive, we will have to look for other energy sources. It’s more a matter of must, rather than can.
3. As other energy sources fall to the wayside, we’ll use what we have to work with, and if they aren’t sufficient to conduct business as usual, we’ll make the necessary lifestyle changes because we won’t have an alternative.
Yes, but the subsidy schemes being introduced are perverse. They don’t make much sense. And a lot of it happens because we gave too much mindless cheerleading.
Do you know what I feel like? Like I felt in late 2002 when I saw the large child at the White House advocating an Iraq invasion using lies and without having any idea of what that invasion was about to involve. Today I see ANOTHER large child at the White House using similar techniques to get the country involved in something he evidently knows nothing about. Somehow, this country seems to elect idiots for president one right after the other.
Subsidies happen because incumbent industries fight desperately to prevent simple, effective solutions like carbon and fuel taxes.
The result: you get complex schemes like subsidies and cap & trade because…you have to do something.
Isn’t it wonderful that you can’t kept a conversation on track and be polite.
If I was being impolite I apologize, though frankly I’m not sure exactly how you concluded that. Granted I did express some frustration.
But I have lived in the real world and operated complicated electrical systems and I don’t believe for one moment that so called CEO’s of power companies have said that or, if understood, intended to say that, because the physics of electrical power say you can’t intergrate large amounts of DC power and intermittent power into grids and keep them stable.
Ok, call me a cockeyed optimist but I have read plenty of technical information saying that you absolutely can integrate large amounts of DC power and intermittent power into grids and still keep them stable. And the link provided upthread has Power Company CEOs talking about that and they also talk about Carbon Taxes, I never suggested that you had said anything about that.
Though I admit I am not an engineer or PV expert so perhaps I’m just another gullible layperson without a clue who believes those engineers who disagree with the gist of your statements . But I also accept that BAU is over and that there real physical limits to it’s continuation, as I see it they affect our fossil fuel based infrastructure even more severely than alternative energy generation options.
As for grapefuit sized hail, yeah if that hits something it’s pretty much toast. So how does your average substation or typical fossil fuel based power station hold up to that kind of hail? I think talking about Storms, Hurricanes, and grapefruit sized hail in this context is pretty much a strawman arguement.
Green Energy Bust in Germany
Even the green minded volks in Deutschland are jaded by Big Wind and the ennui that was thought to not be there is now the zeitgeist.
Big Wind has gargantuan flatulence.
More oil is better.
More beer is even better than more oil.
More cow bell.
Green Energy Bust rebuttal
http://www.dissentmagazine.org/article/green-energy-bust-response-to-will-boisvert
As usual the people who keep saying it is a bust either don’t have the correct information, have put on their blinders because of their ideological leanings, are cherry picking the data, or are just plain lying.
The truth about the Germany energy experiment may not be as rosy as some say but it ain’t half as bad as others are saying. Being on the cutting edge of paradigm change is bound to raise hackles.
But I’ll certainly vote for more beer!
heres an article from December 2014
ON DECEMBER 3rd the German government announced plans to redouble its Energiewende, or “energy transition”, and accelerate progress so that the country can meet its goal of a 40% cut in greenhouse gases (from 1990 levels) by 2020. The same week, E.ON, a big German utility, announced its decision to split into two companies. One will focus on traditional nuclear and fossil-fuel electricity generation, and the other on renewable energy, electricity distribution and “energy services” for cost- and climate-conscious customers. Both decisions have been seen as evidence that the Energiewende has failed. But what has gone wrong?
The Energiewende has two main policy tools: generous support for renewable sources of energy, and an exit from nuclear power by 2022. The government supports renewables by promising those who install solar panels or finance windmills a fixed, above-market price for each kilowatt-hour of energy they feed into the grid. Those renewable sources have grid priority, meaning they must by law be drawn upon before other energy sources, like electricity from coal, gas or nuclear plants.
The above-market prices meant that many Germans rushed into renewables, from installing solar panels on barn roofs to buying shares in wind farms. Renewable capacity expanded quickly, and now accounts for an impressive 27% of electricity production. But the renewables rush began as utilities also invested heavily in new fossil-fuel generation, especially modern gas-fired power plants. The simultaneous dash to renewables and new fossil-fuel power plants resulted in overcapacity and caused wholesale prices to tumble, which has battered the utilities’ profits.
At the same time, the prices paid by consumers have been rising. This is because of the above-market prices guaranteed for renewable energy. On a sunny, windy day, a flood of renewable energy surges into the system; it must be, by law, bought by grid operators first, with the producers paid those above-market rates. Those rates are subsidised by a surcharge on customers, and the surcharge must go up when more renewable kilowatt-hours are poured into the system. But an unintended side-effect of the policy has been that renewables undercut relatively climate-friendly natural gas on price.
…”……… The result is that prices have gone up and the use of renewable sources has expanded, but Germans have ended up emitting more carbon dioxide as a result of the extra coal—hardly the result the architects of the Energiewende hoped for. Fixing it is one of the current government’s top priorities—as it should be.
http://www.economist.com/blogs/economist-explains/2014/12/economist-explains-10
Talk about oil and reserves and wealth, political arrangements and so on. There is no sustainable order, complexity or regeneration of worn out infrastructure based upon limited resources or renewables for that matter. The problem can be traced to the Maximum Power Principle and the desire for growth which has been unleashed by the evolution of a technological society. Humans in their technological form are a cancer. Doesn’t really matter how you organize it politically as long as its growing exponentially and consuming the original system. We are on course for evolutionary suicide. Perhaps the bullet, moving at speeds of millimeters per year, has already left the chamber and is aimed at our overrated brains right at this moment. Just inches to go and it’s all over.
http://www.iaees.org/publications/journals/nb/articles/2014-4%282%29/invasive-cancer-as-an-evolutionary-suicide.pdf
Here is something I find interesting. It is obvious to me, as it must be to others reading this blog, that the economics of oil production, as it is being practiced in the Eagleford and the Bakken regions are just bat shit crazy. Millions of dollars are being pissed away!
My question is, would it be any more crazy, or less crazy if this money was being used to install wind, solar, small hydro, pumped storage, batteries and EVs to run on all the electricity generated by these renewable sources?
Right now the money that is being pissed away, is unlikely to ever be repaid and after the “oil” that is extracted is burnt (taking the kids to soccer practice in the 16 mpg Suburban), there will be little to show for it. If the same money were to be used to build CSP plants with 16 hours of thermal storage, they would generate “almost baseload” power for decades.
The definition of Insanity is doing the same thing over and over again and expecting different results! Albert Einstein
Developing the EF and the Bakken sure seem to make sense at the average price we saw from mid 2010 to mid 2014. Oil companies aren’t power utilities. They invest in what they know. And thus far wind and solar require heavy subsidies, this limits the cash flowing into such ventures.
Spoken like a true “oil man”. The Crescent Dunes Project near Toonpah, Nevada is estimated to cost in the region of a billion dollars. That billion dollars built a one of a kind, 110 megawatt, CSP solar tower plant with ten hours of thermal storage. According to the Wikipedia page this plant should be able to generate 110 MW for at least 12 hours a day (52% capacity factor) and generate 485 GWh per year and revenue of $65.475 million per year at the PPA price of $0.135 per kWh ($135/MWh) and $1.636875 billion over the 25 years of the PPA. While the price under the PPA may seem high, this is for electricity delivered during the mid day peak demand period AND the late evening peak demand period.
If three hundred of them were to be built they would not cost a billion dollars each, so the $300 billion spent on the shale boondoggle, could have built more than three hundred Crescent Dunes Projects. That’s more than 33 GW of almost zero carbon, dispatchable electricity generation, capable of generating a total of more than 145.5 TWh per year or more than 3.5% of US total electricity consumption for 2014. Very little risk and very real returns. More than can be said for the shale boondoggle.
best wishes for less boondoggles
So? The two aren’t mutually exclusive. USA produced oil backs out imports from human rights abusing monarchies, dictatorships, and corruptocracies. Solar power displaces coal.
So have at it. Put your money into gazillion gigawatts of solar power. And don’t forget to include the batteries in your subsidy request.
How many batteries? Numbers…
I’m going to work a rough number for an interconnected 100 gigawatts renewable wind power facility distributed in Western Europe, designed to deliver a steady 30 gigawatts. It’s going to be a rough number, but it’ll give you an idea.
Okay.
Of course, that’s expecting a single power source to provide self-balancing, something that’s not required of any other power source, such as nuclear or coal.
For instance, it would ignore the fact that wind and solar are inversely correlated, so that the combined variance is much lower.
But, it’ll be a start.
If you were an EV advocate, which obviously you are not, you would have written, EVs back “out imports from human rights abusing monarchies, dictatorships, and corruptocracies. Solar power” can provide energy for EVs.
The point I am making is that, the shale boondoggle is akin to a man buying a fish, as opposed to buying the equipment needed to catch fish. Sure, the equipment is going to cost more than a fish but, using that equipment, the man can supply himself with fish for the rest of his life.
What is being sought is energy and people or nations now have the choice of buying energy in the form of fuels or buying equipment which can be used to harness energy from the environment, albeit intermittently in the case of PV or wind. (Note that the CSP project linked to above, is for all intents and purposes, dispatchable)
It is quite obvious that you don’t buy into Tony Seba’s “Clean Disruption” while, I find his predictions well within the realm of possibility. As such I view these investment decisions as a matter of embracing the future rather than hanging on to the past.
I am sure you are intelligent enough to figure this out but, you are just being your usual self!
North Dakota production projections (from NDIC presentation of 5-10-15)
I can’t seem to find that presentation. Got a link?
Here it is: https://www.dmr.nd.gov/oilgas/presentations/APIMinot050715.pdf
p.8
Sorry, should have been 05-07-2015 presentation.
Note that if we assume the 140 rig case has 140 new wells per month for 27 months, that adds up to 3780 wells from May 2015 to July 2017. This scenario matches my 140 new well per month scenario fairly well, where the average output is about 1150 kb/d from July 2015 to Jan 2017.
Show me the Oil. Nation by Nation – Exporters and Importers – NET Winners and Losers
http://peak-oil.org/the-oil-production-story-pre-and-post-production-nations-2015/
Top 10 produce 2/3 of global Oil
USA IMPORTS about what #3 Russia Exports.
Longtimber,
One aspect of US imports of crude oil that I mention from time to time is that refineries importing crude are selling refined products overseas, to Latin America and the Caribbean especially, where demand exceeds refining capacity. The US is a refiner to the world (and maybe beginning to face competition from Saudi Aramco JVs with various oil companies but that’s another story.)
I remind myself of this when I find that I’ve, without thinking, been regarding US crude imports as oil we need here for our use in the US. Much of it gets us moolah from abroad.
Value added is everything these days with commodity prices where they are. Wonder what a ballpark percentage of Total “Oil” is exported and what the dollar value would be?
This article deserves some attention: http://www.vox.com/2015/6/14/8767823/psychology-global-warming
The focus of the article is the climate change discussion. The reality is that the 10 items under discussion affect just about everything that has to do with overshoot, from the physical reality, to the political reality to the human social reality that impact on the issue.
In fact, this article and the items it discusses is probably simply part of the wisdom of considering the results of dealing with large numbers of humans. The article seems quite insightful and should prove helpful in making better progress in dealing with all sorts of issues. However, being who I am, I have a feeling that those who will make the most of the research detailed in the articles are the usual suspects who are trying to sell us something we don’t need.
So it goes.
I just can’t get my head around the population problem. Even if we were to lower population by one percent a year that would mean about 150 million excess deaths each year to start. That is essentially all of Germans and the citizens of the United Kingdom disappearing in a year and a few more million elsewhere. I can’t see any way to accomplish that in a civilized manner. Even massive wars have not accomplished that level of excess death.
Birth rate is slowing but I don’t see how that will achieve the reduction.
Barring miracles on the technological and economic fronts Mother Nature is going to take care of the population problem.
Nobody can say for absolutely sure such miracles will not EVENTUALLY come to pass, but nobody who understands the ABC’s of biology and economics thinks they are coming in time to prevent human die off on the grand scale.
A great many people who do understand the facts are extremely reluctant to say so publicly. Nobody really cares for the bearers of bad news.
The people who are lucky enough to live in places such as North America, Russia, Brazil etc – places with lots of resources and relatively small populations in comparison to those resources -MIGHT escape the die off.Geography counts, military power counts. They might not. The roll of the dice will have a lot to do with it.
Don’t get caught in Egypt.
I have it, we will move women to eastern hemisphere and men to the western hemisphere. No direct contact or trade will be allowed between them for 55 years.
That should solve the problem.
“Rachel, Rachel, I been thinkin’, what a fine world this would be, if all the women were transported far beyond the Northern Sea.”
As always, there’s a solution. Us engineers can think up dozens of ’em, if you ain’t too picky.
Here’s a few more for the amusement and comfort of all.
Soap operas. Proven highly effective. Written to be totally addicting to the great masses of whatever place, containing implicit connection between well-being and few kids. Goes with free tv and associated pv.
No migration. Everybody knows they gotta solve their own population right there and by themselves. No just running over the border to the place that has had better luck. ( I once heard the pres. of Mexico make an off-hand remark that he had no population problem because “we can just ship them over the border”.
To help them fix their own problems, better off nations spend real money transferring the means to do it. OFM keeps saying don’t go to Egypt. I say, do go, carrying tons of stuff that sets up the Egyptians to be a world class manufacturer of all kinds of energy-intense things using the huge gobs of solar that dumps on them totally unused every day of the year.
The Bundeswehr rightly worries about migration across the Med. But they know all about solar– send it to Egypt, and btw, to all the other Egypts as well. They know full well that the Red Sea has more sun than Hamburg. Their solar is misplaced a bit too far north and way too far gloomy.
And, just to keep everybody happy, cook up some coffee bean or other that is also a libido suppressor- turns the mind from ass to glass or something to that effect.
usw.
Or we could circulate a pamphlet to all the teenage boys and girls telling them the realities of raising a family. That should cut down the desire to breed.
Sorry buddy, the desire to breed has nothing to do with it. It’s the desire to something else that’s the root of the problem. In my neck of the woods, very few pregnancies are the result of a desire to procreate. It is the act that results in pregnancies that is irresistible and when faced with the opportunity for pleasure, it takes some amount of fortitude to decide that acting in the absence of a means of contraception is not such a good idea.
The best way of getting people to procreate less is to give them lots of stuff to do in the way of employment and entertainment.
In many parts of the world this going to be a slight problem as there are far more people than there will ever be jobs for.
These things have been discussed here ad nauseum and populations are growing fastest exactly where they should not. I have a bad feeling about how this is going to turn out. Unfortunately, things might take unexpected turns like the sprinkle described in Jeff’s comment further down, turning into a deluge.
Right! A lot of people make that mistake. They confuse the desire to fuck with the desire to have children. They are totally unrelated.
Have you every wondered why, unlike most mammals, apes do not have a breeding season?
Islandboy the desire to procreate is built in at a subconscious level. The drive to have sex is apparently causing the desired result, children. Doesn’t matter what our conscious mind thinks about it, the older inner mind runs the show.
We might have changed the odds, but only a fool would be surprised when the acts results in pregnancy.
Nature does not give a crap about what we think or even what we do. If we don’t procreate, we disappear. If we procreate too much or too fast, we get our collective butts kicked back to lower levels because errors build up and limits can only be pushed back so far.
If as you say “the desire to procreate is built in at a subconscious level. The drive to have sex is apparently causing the desired result, children. Doesn’t matter what our conscious mind thinks about it, the older inner mind runs the show.”, then what is the point of “circulate a pamphlet to all the teenage boys and girls telling them the realities of raising a family”? This will appeal to the conscious mind which is pointless if it “Doesn’t matter what our conscious mind thinks about it, the older inner mind runs the show”. Ron said it best a couple of posts up using language that I would not feel comfortable using in “polite company” but, which is exactly to the point.
Two things need to happen.
1) It needs to be hammered into peoples heads that sex without contraception is a good way of getting pregnant.
2)Contraception needs to be affordable, available and convenient.
I have posted here before about the strong objections to the idea of distributing free condoms in schools in my neck of the woods. This in an environment where there was a scandal of a cell phone video making the rounds, showing a teenage boy and girl, having sex, on a stair case, at school, in their school uniforms, in broad daylight, in view of a few other kids! But no! making condoms available in schools would only encourage the innocent to have sex. Give me a freaking break!
islandboy
The pamphlet thing was realistic humor, just having a little joke about “if I knew then what I know now”.
Sorry, your humor went straight over my head. As said elsewhere on this thread, these things don’t come across well in exchanges such as these, unless you resort to using emoticons or such.
Seriously though, I would accept that the vast majority of the time, when people think of having sex, they do not think they are going to “make a baby”. Their thoughts are very much focused on the pleasure they will experience during the act, especially at it’s climax.
I was brought up to always consider the consequences of my actions. As a result I passed up some amount of opportunities to have some fun that, I had not properly anticipated. It has worked since I am yet to “bring forth” any offspring but, somehow I get the feeling that this is NOT an evolutionarily successful trait. I wont be passing anything on to any succeeding generations at this rate!
Hi Marblezepplin,
From 1965 to 2005 the World’s Total Fertility Ratio(TFR) was cut in half (from 5 births per woman to 2.5 births per woman on average over her lifetime). If the World’s total fertility ratio falls to 1.5 births per woman by 2050 (a slower rate of decrease than before) then population falls to 4 billion by 2150. The chart below assumes average life expectancy levels off at 90 years, paper is at link below:
http://www.demographic-research.org/volumes/vol28/39/
PDF at link below:
http://www.demographic-research.org/volumes/vol28/39/28-39.pdf
Chart is from page 1153 of the paper (Figure 1). Caption for the figure is below:
Figure 1: Global population size from 2000 to 2300 resulting from alternative
global fertility levels as indicated (TFR to be reached by 2030-2050
and then kept constant) combined with a maximum life expectancy of
(a) 90, (b) 100 and (c) 120 years
Chart is figure 1(a)
2.0 and above look like big trouble. I wonder if there is enough time to wait to 2100 to get a reduction in population. A lot can happen in 85 years and at the current rate of destruction of the environment, I would say factors other than lower child birth rate have to come into play.
.
Marble, finally, someone who understands the real problem. Indeed we do not have 85 years to wait for population reduction.
Also, Dennis, the fertility rate falls in developed countries for one reason, it falls in undeveloped countries for a different reason altogether, overpopulation, overcrowding, stress, malnutrition, disease brought on by living in unsanitary conditions and so on.
But you are a very smart person Dennis, so I am sure you knew that already. I am just repeating it here for those who were unaware of this very obvious fact.
They say in Brazil it fell due to soap operas showing highly successful women with few children
http://siteresources.worldbank.org/SOCIALPROTECTION/Resources/280558-1138289492561/2158434-1308331671204/duryea_ee_conf_brazil.pdf
Hi Ron,
In some undeveloped countries the TFR is very high, the change in TFR is mostly a matter of access to contraception, women’s rights and access to education, government policy and social convention.
In less developed nations there is higher infant mortality and lower life expectancy due in part to poor living conditions and less access to medical care, this actually tends to boost the TFR.
Factors other than lower child birth will come into play chop-chop if we enforce the no-migration rule.
Awful consequences? Sure, so gimme one that isn’t.
Hi Marblezepplin,
Many thing can happen, it is impossible to predict, the point is that if the World manages to transition to something more sustainable and that the situation for millions of people continues to improve as it has for many over the past 50 years, then fertility rates will fall and population will decline.
If there are wars, famine,and/or ecological disaster then mortality rates will increase and population may decline faster. One problem with higher mortality rates is that humans tend to respond with higher fertility rates as mortality rates increase.
The future is a mystery, but higher fossil fuel prices and the depletion of fossil fuel resource could ultimately be a net positive as we transition to alternative forms of energy and use expensive energy resources more efficiently.
Or it could be a disaster.
All we have to decide is what to do with the time that is given us.
J.R.R. Tolkien, Fellowship of the Ring
Wet One, thanks for posting this link. It is indeed very insightful.
I don’t think the article would be very helpful to those trying to sell us something. It basically tells us a lot about our nature. And basically it tells us that we are going to do nothing about global warming until it is too late to do anything.
But what the hell, it’s already too late.
“it’s already too late”
Oh I don’t know Ron. There are couple of billion plus new souls on the way that will be here soon. Maybe they’ll help us deal with the problem. (surely I don’t need a yellow face here?)
The huge logic error is to say only us doubters have ulterior motives and the other side is all pure worried about the environment. Hello, the government scientists trying to explain climate change to us all live on the taxpayer funded grants and fame of their science. If you are a “scientist” at the public universities you might as well become a truck driver if you don’t believe in manmade climate change. Heck, in some of the blue states, you probably couldn’t even get an elementary school job if you don’t follow the official Democratic narrative that humans are changing the climate and it’s not all natural variations due to us still coming out of the last Ice age.
If it’s cold, if it’s warm, if there are hurricanes, if there are none, if humming birds have a bad year the answer is always the same, manmade climate change! No additional discussion or alternate views are allowed, even if the government scientists are discovered using faulty or fudged data. If they have a model making temperature predictions for the next ten years, they should let the other side make theirs and get it out in the news, but no that’s not allowed to happen especially since the media in this country is only willing to report the left’s side of every story.
These are just some of the things that personally fuel my deep distrust in the climate science, no matter what that article says. Just seems like the entire left wing of the United States has jumped on the bandwagon the government funded scientists built for them, and ever since they choose to automatically dismiss any other opinions, or shun and blackball doubters.
Sam Nickels, Please watch this!
I agree, a few other left-wing scientific beliefs also annoy me:
– Germ theory: Have you ever seen a ‘bacteria’ or ‘virus’ in real life? I haven’t. Left wing scientists created these to get us to pay money for ‘antibiotics’.
– Round earth theory: if the earth was round why do we not fall off the sides? Have you ever seen it for yourself? Blatantly another left-wing conspiracy.
– Evolution: How does a banana turn into a cow? Woah! My brain hurts! Crazy left-wing nonsense.
– Smoking and lung cancer: smoking doesn’t cause lung cancer as I had a neighbour who smoked and lived until 80, he died of heart failure NOT cancer, ergo this is another left wing conspiracy to harm the struggling tobacco industry.
I know of lots more left-wing conspiracies if you are interested.
Mocking those of us who don’t share your political views is not the way to win support. If you had just stuck to trying to rationalize the extraordinary scientific claims behind climate change, you might have had a chance, but the way your side has gone about selling climate change has turned it into just another leftist CAUSE, a la the ‘everybody is special’ or social justice movements. Won’t ever work with the vast majority of us here in Middle America who work hard, pay our taxes, try to raise our families with traditional values, etc. But, I suppose to the left I’m just another fool in flyover country who bitterly clings to my bible and gun and would best be eliminated from the face of the earth, right? Whatever.
Why are you hating on me for my right-wing beliefs?
I’m giving you undeniable evidence that the left has been scamming you with other ‘scientific theories’ like the ones I mentioned above. Why attack me (the messenger), I’m on your side. The enemy here is the left-wingers and something called ’empirical evidence’.
God will forgive your sin.
“God will forgive your sin.”
Well, maybe not. It seems to me that God is good to all, except the wicked, and His mercies are everywhere, except when He is punishing the wicked. I suppose He will reward all the right-wingers and punish all the left-wingers; or He will punish right-wingers and reward the left-wingers. In any case, it’s clear the meek get to inherit earth which, it seems, may turn out to be punishment.
wonder what Pope Francis’s agenda is…..
http://www.theguardian.com/world/2015/jun/15/pope-francis-destruction-ecosystem-leaked-encyclical?CMP=share_btn_tw
” Won’t ever work with the vast majority of us here in Middle America who work hard, pay our taxes, try to raise our families with traditional values, etc.”
You have my sympathy , especially given that I come from your sort of background.
But as the older generation dies off , the beliefs of the next one coming along change substantially. If you live to be old you will despair of the beliefs of your grandchildren.
Hardly any God fearing and Jesus loving patriotic American who send his kids off to university has a clue as to what his kids believe by the time they graduate.
My parents bought me an encyclopedia when I was in the third grade. If they had had ANY IDEA what was in that encyclopedia they would have burned it immediately.
My father insisted that I take economics classes. I came home and frustrated him no end with my new ideas. For instance, I told him that monopolies were bad for consumers…
Science itself is a conspiracy.
We only have the Bible to go by.
And we should be tossing out all modern medicine because it’s based on “science” rather than the Bible.
We should also be giving up electricity, modern transportation, and many other things because they are tied to scientific discoveries, which of course can’t be trusted. They are the Devil’s work.
Hello, the government scientists trying to explain climate change to us all live on the taxpayer funded grants and fame of their science.
During my 17 years at NASA Marshall Space Flight Center and University of Alabama, Huntsville, I worked with dozens of scientist who worked on climate science. The salary of none of them depended on their findings. They got paid no matter what they found out. Many of them, in the late 80s and well into the 90s, were skeptical. I know because I worked on their computers and I would always ask them. As time went on some of the former skeptics would just grin and say something to the effect, “well I am not going to say just yet”. But as time went on the skeptics became fewer and fewer until they were, for all practical purposes, none.
The very idea that that many scientists could all violate their oath to seeking the truth, just for politics or some other silly reason… is absurd beyond belief.
But you do have a point about peer pressure. Take the creationist idea that the world is only 6,000 years old. At any university, if any scientist argued that this 6,000 year old earth theory was actually a possibility, he would be laughed off campus. After all, the evidence of a billions of years old universe is so overwhelming that any scientist who still believed in a young universe is thought to be an idiot. Though just 200 years ago it would have been an accepted theory on any campus. But the march of science has relegate the young earth theory to the dustbin of history.
Likewise with the “Man cannot change the climate theory.” Just a few decades ago it was an accepted theory, even among university professors. Nowadays the evidence of anthropocentric global warming is so overwhelming that any scientists or professor who argues for the “God Only” theory is thought of as an idiot, and justifiably so.
Most scientist and college professor do not suffer fools gladly.
true but you’re leaving out the fame angle. I mean the chance to walk down the red carpet at The AGW Awards in a tux or backless dress is irresistible.
The whole idea of a young universe is thrown out if you just watch the skies. If the universe was only six thousand years old, then light from stars over six thousand light years away would not have reached us yet. Stars would be popping into view all the time with the star maps constantly growing. Very little of the Milky Way would be visible let alone any external galaxies or globular clusters.
Of course the creationists would come up with something magical to take care of all that. If they haven’t then they are just a waste of space (pun intended).
Ron makes a good point that we cannot just ignore the conclusion of a large group of scientists who tend to think logically and independently. And yet, skepticism should still be welcomed and addressed, rather than ridiculed.
And yet, skepticism should still be welcomed and addressed, rather than ridiculed.
Canabuck, up to a point. When the criticism is legitimate, based on evidence or at least logic and reason. But when the criticism is nothing but an attack on the scientist, calling them name, saying they are on the take, or are left wing fanatic, calling them “warmist” and such nonsense, then it should be ridiculed.
So Canabuck, when someone says something like: “Just seems like the entire left wing of the United States has jumped on the bandwagon the government funded scientists built for them, …”, then that is nothing but an ad hominem attack on the people doing the science and deserves nothing but ridicule.
point taken.
However, I would still address the concern first. And minimize my ridicule.
But then there are still issues like “solar forcing” that come up:
Solar Forcing. And i don’t have time to read up on the subject.
“Ron makes a good point that we cannot just ignore the conclusion of a large group of scientists who tend to think logically and independently. And yet, skepticism should still be welcomed and addressed, rather than ridiculed.”
One must also consider the laws of unintended consequences that cause a complete opposite result then affected.
Suppose the US & the EU completely abandon coal fire plants next week and switches all electricial power to NatGas. Thus drawing down the remaining NatGas at an accelerated rate. Western economies collapse as depletion causes prices to soar, which leads to civil wars, regional conflicts and eventually full blow nuclear war, utterly destroying the environment. I am sure there will be a flood of replies such as: “Well, that will never happen”. For about every megawatt of utility supplied Solar wind, they will also build 20 to 50 times megawatts of natGas fired power plants as the coal plants are shutdown. Its cheaper and easier to build a 500 MW NatGas power plant that operates 24/7/365 than it is to build solar and wind that operates very intermittently. The new EPA rules are set up so power companies can transition to natGas since there is no penalties or regulations to switch from Coal to natGas.
We will continue to see jobs and production move to Asia were there are no pollution controls and which will increase global CO2 emissions as more and more Asians adopt western livestyles (driving cars, running A/C, etc), as also providing the capital, manufacturing capability, and technology to build a first world military complex. In the West, we will see rising unemployment as jobs move to Asia. Of course this has already happened. The wars and breakdown of western power will begin after depletion begins, but if you read the daily news its easy to see the war drums, China building miltary bases in the south China Sea. NATO moving troops and miltary equipment into eastern europe and Russia countering by positiong tactical nukes to balance NATOs postering. We still haven’t breached peak petro liquids & NatGas yet, but its coming.
http://www.energytrendsinsider.com/wp-content/uploads/2013/08/Coal-Consumption.png?00cfb7
Nothing you or any western gov’t is going to curb Asian coal consumption or prevent increases in global CO2 emissions. What ever curbs the West implements will be dwarfed by consumption in Asia (see above chart). Until the very recently due to economic declines in Asia, the US was shipping its unconsumed coal to China to burn in their power plants, so regulation on US power plants did not impact US coal production significantly.
The only way Asia consumption will decline is with a severe economic global recession, which will lead to political crisis in the West as well as Asia, which will cast the die for global war.
Between India and China, there are close to 3 Billion poor people seeking out the Western lifestyle. They don’t care about the environment, or the future, all they care about is a better standard of living, and they want it now. I think China and India now have a combined middle class that is larger than the Middle class in the US and possibly both the US and the EU combined, and they are buying new cars and installing A/Cs, and adapting to the western consumerism style.
“There is no scope for moral superiority in the climate talks, least of all a moral superiority based on unfounded national stereotypes. Collectively, we are wrecking the delicate atmospheric balance that has allowed human civilisation to flourish. Collectively, we have to sort this out. And it will happen only by taking responsibility for our impacts, rather than by blaming other nations for what we don’t want to do.”
http://www.theguardian.com/environment/georgemonbiot/2015/jun/12/china-excuse-inaction-on-climate-change
They don’t necessarily think independently. There’s a lot of career pressure to conform because climate change has been turned into a political circus.
By the way, I spent part of my career serving as the designated contrarian, my role was to police and poke holes in projects and designs. So I got trained at looking for things that didn’t fit properly. The IPCC work has such a problem. The pieces don’t fit properly, there’s a series of disconnects, and this means the people in charge need to be removed.
You will experience a lot of resistance to your views, and, frankly, you’re probably used to it. No worries, everyone here is entirely to familiar with the experience of being shunned or tossed aside for their strongest convictions.
I say forget the models, forget the bundling of climate data from various sources and intents. In fact, I firmly believe that a genuine conclusion on all this global warming stuff can only be apprehended by forgoing the multitudinous flaws of collectively interpreting data collected by hundreds of institutions with agendas.
We need to ask questions that have zero possibility of being corrupted by interpretation. Climate science gathers data and interprets; every piece of that puzzle is ripe for corrupted practices.
The only thing immune to corruption is the physical properties of the molecule being discussed. Shine sunlight on CO2 (or O2, CH4, N2, O3, any gas) and it will, 100% of the time, without any need to “average” or “interpret” data absorb and reflect precisely the exact same wavelengths of light. The physical properties of a molecule and the absorption/emission spectra of that molecule are invariable and set by its electron configuration.
All that is needed to get an ultimate answer, uncorruptable by agendas or influence, is to read the emission spectrum of CO2. Luckily, it is extremely easy to do such a thing with spectrometers. In our cars, homes, or greenhouses sunlight passes through glass without being absorbed. It travels right through.
The sunlight then hits an object – your dashboard, carpet, a desk, whatever – that object absorbs the energy of sunlight and re-emits some of that energy as infrared waves (commonly called heat). Even though the wavelengths of sunlight past right through the glass (this is literally why glass is clear) the infrared waves are absorbed. If human eyes saw in infrared glass would look opaque! This is all easily testable, no need for interpretation; these are the immutable physical properties of these molecules, and you can test it yourself.
So energy passes INTO the glass room freely, but after it hits an object, and is re-emitted as infrared energy (also an immutable, testable, and confirmable physical property of any material), it travels back toward the glass. Because the glass is composed of molecules that allow sunlight through, but absorb infrared light, they trap the infrared light. It’s better to think of the trapping of infrared light not as the trapping of “heat” or “warming”, but as an accumulation of EM waves – heat is just a way of discussing how many infrared waves are bouncing around.
If CO2, or any molecule in the atmosphere, does NOT absorb sunlight, but DOES absorb infrared, then sunlight will happily travel all the way through the atmosphere to the planets surface. When it hits the surface it is absorbed and re-emitted in the spectra of whatever molecule it hit. I know you see where this is going, so I’ll advise you to do two things:
1. look up the physical properties of various molecules and see what EM waves they absorb and what they emit, then compare those absorption/emission spectra to the composition of sunlight. These are immutable physical properties, so they are not subject to interpretation and agenda, which is great!
2. If you want to go the full monty, then it is incredibly easy in the modern era to get your own spectrometer and do this yourself. Not only are the physical properties of any molecule identical (all CO2 gives the same absorption/emission spectra), but you can literally do the experiment yourself!
This info is all that is needed to at least come to a logical conclusion as to whether or not CO2 acts as a glass window in the atmosphere. It’s actually extremely simple, and no form of collecting or interpreting data can change it.
I firmly believe that a genuine conclusion on all this global warming stuff can only be apprehended by forgoing the multitudinous flaws of collectively interpreting data collected by hundreds of institutions with agendas.
Brian, why would all these institutions have agendas? Why would NASA have an agenda? Why would NOAA have an agenda? Why would the University of Alabama Huntsville have an agenda? Why would universities in England, France, Australia or Germany all have an agenda? And why would they all have the exact same agenda?
Don’t you think it’s a stretch to accuse everyone and every institution that disagrees with you as having an agenda?
The agenda the vast majority of them have is a search for the truth. Why is that so hard to understand?
The agenda the vast majority of them have is a search for the truth. Why is that so hard to understand?
Because
https://www.youtube.com/watch?v=MMzd40i8TfA
With deference to Ron and others here who accept the science, global warming denialism is largely a US (North American) phenomenon, ostensibly the result of a sophisticated media campaign, funded by vested interests with a huge stake in industries that, benefit substantially from the burning of fossil fuels.
Outside of the US, where the fossil fuel industry influence is far less pervasive, the views expressed by those, largely in the US, whom I shall refer to as sceptics, are largely considered really, really, really backward or dumb or unscientific or something along those lines. People outside of the US who display such scepticism are often immediately dismissed as having a vested interest or just having their heads too far up where the sun don’t shine to be taken seriously,
Sceptics really have no idea how bad (stupid) they look from the perspective of people in places outside the immediate sphere of influence of the fossil fuel industries. I know they (the sceptics) are going to want to rip me to pieces but, I don’t give a $#!t, so proceed!
{flame suit on.
Don’t be silly. I don’t think the Chinese, Indians, or Nigerians worry too much about global warming. They may see it as a weapon they can use to secure a power shift from self immolating western societies.
Ron, government bureaucracies have agendas. The same applies to corporations. Within bureaucracies (government and corporate) we see groups or clans evolve with their own agendas.
Let me give you an example: after the USSR collapsed the Russian elites struggled for control of the production apparatus. Yeltsin was poorly educated and surrounded by a group of people who ranged from dishonest to nationalists to idealists. But all of them agreed communism had failed, and they dreaded its return. Because Yeltsin couldn’t get these bands to agree the bureaucracy split into bands, and each had a very different agenda.
An interesting alliance emerged between Gazprom and the military. Gazprom was controlled by dishonest managers, but it wasn’t fully privatized and didn’t fall into the hands of the oligarch mafia. In return for military support they started advocating projects to employ the military industrial complex, and this led to a very tight alliance between Vyakhirev, the Gazprom president and Nikitin, a very influential super engineering manager linked to the nuclear submarine builders at Sevmash. This alliance led to gradual emergence of Gazprom as the lead company developing the Prirazlomnoye offshore field, as well as their inroads into Sakhalin projects.
I think the USA bureaucracy works to some extent in the same way, there are alliances between bureaucrats and greens, weapons builders, Israel lobby, you name it.
The USA EPA and NOAA are taken over by very politically inclined individuals (I know simply by reading their Twitter). They are going full pedal to the metal to get Hillary elected, and this makes them set the table for the triunvirate of democrat party politics: environment/CO2, military industrial complex, and Israel lobby agenda. Thus the Democratic Party has an odd three legged agenda. The social agenda is diluted because homosexual marriage, equality for minorities and the other ideas are mostly a reality and I don’t think legalizing 12 million illegals is that popular with the working class, it’s a zero sum game for the democrats. That leaves those three I listed as their main focus. And that means a heavy dose of bias and look out for your career in the government bureaucracies.
Fernando, your examples are very poor. Of course there was a power struggle in Russia after the collapse of the FSU. What the hell did you expect?
And concerning EPA and NOAA, the right wing idiots want to shut them down, especially the EPA. Hell Rick Perry would also shut down the departments of Commerce, Education and Energy. (He finally remembered the third one, Energy.) And why do the right wing want to shut down the EPA and all the other agencies? Because they support science instead of their stupid right wing ideology.
And why would NASA have an agenda? I can tell you that a lot of the scientists that I know at Marshall wanted to find that there was no global warming. But the data showed them otherwise. So just like the scientist who earlier disbelieve in Plate Tectonics until an avalanche of proving data came pouring in, they also became believers.
That’s how scientist are trained Fernando, they are supposed to be skeptical of any new theory until the evidence proves it is true. They were and it did.
And why would universities have an agenda? More to the point, why would they all have the exact same agenda?
And why would universities have an agenda? More to the point, why would they all have the exact same agenda?
Also, if the goal now is to repudiate all universities, is the goal also to end the training of future scientists? Are people now becoming so anti-science that they don’t even want more scientists to be trained? Are we now going to freeze all the world’s scientific knowledge to what we know now because we no longer like the results?
Is it also time to think about burning scientists at the stake because they might suggest ideas we don’t want to hear?
You know, the idea of shutting down American universities because they produce scientists who might have “agendas” would have interesting consequences.
All those businesses that hire science and tech PH.Ds would have go look elsewhere. They already do hire foreign nationals because they don’t feel they can get enough qualified Americans (or so they claim). But now their scientists would be trained in other countries.
So in order to spite government with “agendas” we’ll punish private companies by making it harder for them to get scientists because we’ve shut down the programs that train scientists.
And perhaps will shut down government-run weather watching and collecting agencies. So farmers and insurance companies and the like either won’t get that info anymore, or it will only be available for a fee to private companies that take over the job. Of course, the private companies might end up with the same data and perhaps the same predictions, but we’ll embrace those because they aren’t government or university numbers. Right?
Sadly, we seem to be getting there.
Republican governors are de-funding their state university systems as fast as they can.
Ron, it’s not whether there is global warming or not. You are in a trap, missing the real point. The issues are a lot more subtle. It’s not whether it’s warming, it’s to what degree it can be attributed to humanity, the future attribution, what us the impact of emissions cutbacks, and issues such as climate sensitivity. This later point is a huge unknown. So by focusing on “right wing republicans” you miss the scientific and engineering debates. I’m leaning towards a lower climate sensitivity caused by neutral or negative feedback, I think the models run slightly hot.
Now let me show you what happens according to my model. This is documented in several posts in my blog, but I’m going to link one from last year
http://21stcenturysocialcritic.blogspot.com.es/2014/11/obama-china-europe-co2-plan-results.html
Fernando, read your blog. You do a pretty good job. But you say I am missing the point. Perhaps I am but not nearly as far as you miss my point. But first your comments about the politics.
I talk about the right wing because they are the deniers. They are the nut jobs. And they are led by the champion of all nut jobs, Senator James Inhofe who says humans are arrogant to believe they can cause climate change, only God can change the climate.
Now my position since you don’t seem to have a clue as to what it is. I am convinced that the current global warming and the changes in climate it causes are entirely caused by human beings. But it is way, way too late to do anything about it. We are well past the point of no return. Also our population is already way past the point of even medium term carrying capacity. And by medium term I mean half a century. Whether it be resource depletion, chaos brought on by overpopulation and food shortages, or radical climate change, one of them, or a combination of all of them, will take us out.
We are but observes to this grand drama of world destruction. But I am ever the wild eyed optimist. I am firmly convinced that there will be survivors.
I am convinced that the current global warming and the changes in climate it causes are entirely caused by human beings. But it is way, way too late to do anything about it. We are well past the point of no return.
I don’t know enough about the matter to know what we will do about climate change.
However, I believe economics will bring changes, whether people want to argue about science or not. Fossil fuels will get more expensive. Income inequality will likely increase. The combination of the two will likely lead to reduced consumption.
Those who don’t believe the science of climate change probably won’t escape the realities of a changing world economy. Just because they may think it is their right to use as much CO2-rich fuels as they wish, that doesn’t mean the economics will favor their doing that.
Saying everyone should have the right to own a Hummer doesn’t mean most people will do so or can do so.
Ron, government agencies have agendas dictated by their bosses. In this case the malfeasance amounts to ensuring only the information which supports the expected outcome is seen. There are also subtle issues, ranging from the choice of color palettes they use in their maps, to outright skulduggery, such as suppressing information if it doesn’t fit the story line.
And let’s make something perfectly clear: I don’t support the Republican Party. This means your complaints about whether they want to shut down this or that is irrelevant to the debate. To me this is just another example of the garbage we get for government.
Fernando, your theory is basically conspiracy theory nuttiness. I worked with these guys for 17 years and they had no agenda dictated from above.
Data is data Fernando. You can fudge the data but then if you do you risk someone else taking the same data and pointing out your error. Then your reputation is ruined. So the data is data and your theory is just plain silly. It is the people with no data that deny global warming. One can always put on blinders and refuse to look at the data.
But you should step back and take a long look at what you are implying. And that is almost every scientist in the world is joined in a silly conspiracy to say that global warming is real when it is really a hoax. And they all fudge the data to back up their false claims.
Because Fernando, thousands of them are all saying the same thing! And most of them don’t work for the government.
From the arguments I have read, the underlying reason some people want to dispute GW, or CO2 as part of the process of GW, is not wanting the economic changes that might go along with reducing CO2.
However, it seems to me that the lifestyle changes are coming anyway.
The reason coal is less desirable than natural gas is pollution. Natural gas is cleaner. The fact that natural gas produces less CO2 than coal may be a plus, but that’s not why utilities have been making the switch.
The move to drive more fuel efficient cars is likely inevitable because of the cost of fuel rather than CO2 issues.
Now, the one industry that will likely benefit the most from CO2 concerns is nuclear. So if there is a conspiracy, why aren’t we pointing fingers at those who want to sell us more nuclear power plants?
Ron, thousands of them aren’t saying the same thing. How many people actually lied and distorted information when they convinced the American people to back the Iraq invasion? Or do you think they really believed their own bs about the WMD?
Fernando, thousands of scientists are saying the same thing. And not one scientist tried to say Saddam had weapons of mass destruction.
But don’t try to mix apples and oranges. What a few politicians said in the White House has absolutely nothing to do with what thousands of scientists all over the world are saying.
And I think it really naive of you to try to connect the two. And saying it was naive is just me trying to be kind. I could have used another word.
As an American who lives abroad, I find it hillarious that Americans think that scientists from other countries are going to put their reputations on the line in support of American politics.
No scientist living in Germany, China, Australia, etc,etc is going to blatantly lie to help Hillary Clinton win the office.
It would risk destroying their career and they would gain no benefit from it, as no one in America gives a poo poo about what foreigners think when it comes to our politics (generally speaking).
No one outside of America gives a shit about American politics except for entertainment value and how it affects them personally.
Watching guys like Rick Perry pray for rain in Texas is quite amusing to those who didn’t grow up with that kind of astonishing foolishness.
Key point:
Scientists gain status by convincing their peers (who they are competing against) that the EVIDENCE supports their hypothesis.
That is what they are going for. And it is damn hard to convince people of anything.
If you get a 97% agreement, across cultures, religions, personality types…you can be damn well sure there is good evidence behind it.
And there is generally not very good money in it (especially climate science). If you go into business, you can make money, but you give up “The search for the truth” aspect of it.
Ron, the reason why these organizations have an agenda is pretty simple, to crush all competition from private free enterprise because most gov’t agencies are naturally inefficient due to having no profit motive. Corporations–American or not–are driven by profit and have efficiency as one of the means to maximize profit. So, while once in a while gov’t might get something right (efficiency, in this case), it is relatively rare compared to a private company that stands to make a profit from the work it does.
Ron, the reason why these organizations have an agenda is pretty simple, to crush all competition from private free enterprise because most gov’t agencies are naturally inefficient due to having no profit motive.
I’ve been waiting for someone to suggest that the government end all government transfer payments, all government jobs, and all government contracts. It will never happen. The economy would come to a dead stop, so politicians don’t dare do it.
Try telling everyone who gets government money, whether in the form of SS, Medicare, a government paycheck, a government contract, and so on, that the money will stop tomorrow.
Generally the people who say they want less government mean they want someone else’s government money cut, but not theirs.
The advantage of ending all government is that it would shut down the economy, which would stop consumption, which would be better for the environment.
People just wouldn’t have any money to spend, so they wouldn’t be driving much, they wouldn’t be living in big houses, they wouldn’t be consuming so much electricity, there wouldn’t be any more roads built, and so on.
So indirectly the shrink-government folks would encourage the slow-growth, or the degrowth movement.
Jeremiah, I worked at NASA for the last 17 years of my career. (As a contractor, not a NASA employee.) And I take your comment as an insult. We got the moon landing right. We got the Mars landings right, with only one failure.
The Hubble Space Telescope, developed at Marshall, is a perfect example. The first lens was faulty because of budget cuts. They didn’t have enough money to test it properly before deploying. But when the money was reinstated they got it exactly right. Now look what your so called “agenda” has given us.
True, we had some failures along the way. But we likely had far fewer failures than if there were a profit motive.
And Jeremiah, your explanation does not explain why NASA would get the climate data wrong when they get almost everything else right. How could having an agenda cause to get every temperature measurement wrong time after time? How could having an agenda cause them to get the photographs of the arctic sea ice wrong, photograph after photograph after photograph?
Sorry to break it to you, but NASA’s climate division headquarters (which it sounds like you probably didn’t have to deal with during your time as a contractor) has a long history of “adjusting” data to create an appearance of getting their science correct and advancing the agenda to shut down the private sector, especially the private fossil fuel energy sector. This is in spite of the reality being the complete opposite. I can refer you to abundant evidence and numerous examples, http://www.climatedepot.com/2015/01/18/update-feds-conning-the-public-scientists-accuse-nasa-of-misleading-lying-about-hottest-year-claim/
Really? You post a denialist web site as your authority? How if I post about a thousand scientific web sites as mine, and I could of course, would that affect your thinking on the subject?
Ron, if you simply accuse the guy of posting a link you don’t like then you are the one in denial. From a purely scientific point of view, the SURFACE temperature differences between 1998, 2010, and 2014 are statistically insignificant. You would have been better off looking over the point and then responding the total energy level in the ocean appears to be higher. NOAA s recent paper discarding the Argo buoys as the reference does throw a kink in THAT argument. But I don’t suppose you follow the details.
Sorry to break it to you, but NASA’s climate division headquarters (which it sounds like you probably didn’t have to deal with during your time as a contractor) has a long history of “adjusting” data to create an appearance of getting their science correct and advancing the agenda to shut down the private sector, especially the private fossil fuel energy sector.
You do realize, don’t you, that not all scientists work for NASA. You are suggesting that all the scientists in other countries are also conspiring to post fake data? So many scientists around the world conspiring to shut down private enterprise. That’s quite a deal, isn’t it.
wonder what those scientists at the private universities are thinking
That’s right! Don’t forget all the left wingers in the U.S. Armed Forces! I mean those wackos in Navy doing all that “climate change research” such as ice extent or sea gauge measurements. Or those radical Air Force nut jobs doing weather work. They are doing all that work just so they can help maintain that global left wing conspiracy and save their jobs. Their forces would never pay them to do this work without Climate Change. A big worldwide conspiracy to fudge data on behalf of climate change is so much easier to believe than that hacks are being paid to deny science on behalf of extremely powerful industries who would be negatively impacted economically by any response to the data. It shouldn’t weird at all that random retired petroleum engineers are actively dismissing the results of virtually every U.S. sea level measurement. He’s an expert who has always found the cause to be subsidence (even when it is happening to places that were stable for at least 500 years)! The other guys have an agenda…
/sarcasm
The NASA temperature data analysis is done by two outfits. One is at the University of Alabama at Huntsville, which releases the UAH data set, the other is RSS. All other scientists use the data as released by UAH and RSS.
The same applies to quite a few of the other sets. There ARE some differences in the way the data is massaged to establish an average. I think most groups use an outdated method. Berkeley Earth has a better system, but they use the data as established by either NOAA or NASA. I think the last NOAA release is bogus. The NASA data seems to be fine.
Brian Rose – Love the analogy and to run with it a bit we probably shouldnt leave the baby in the car seat with all the windows up.
Brian, the debate isn’t about CO2 or its absorption spectrum. The debate seems to center on the nature of feedbacks, the cloud feedback in the tropics seems to be hot spot. There are other issues, such as the temperature record, the way the energy is removed down into the ocean depths, and the role of aerosols.
I’ve also found an interesting field which involves the forecast of future emissions (the RCP8.5 as designated by the IPCC AR5). That forecast is total nonsense. But it’s what they like to call the “business as usual” case. Thus the IPCC edifice starts out by using a nonsense case to justify actions. And I got a problem with that.
Perfect. The fossil fuels industry spends tons of money and influence to push a Panglossian future where there are no problems with BAU (to help maintain BAU) , and then deniers (likely most also being on the same industry’s payroll) use the results to claim we can’t believe the overwhelming data on climate change because of the Panglossian nonsense (to also help maintain BAU).
I don’t think the fossil fuels industry has a common point of view. There is no overwhelming data to support extreme actions. And insulting people by calling them deniers is bad manners. It earns you a guaranteed rejection.
So apart from your tedious motivated-reasoning bullshit, do you have any geophysical or statistical reasons to doubt the data on climate? Because that’s the only stuff that actually matters in this subject area. Everything else is just noise which can be ignored.
Yes, I have serious questions about the net energy imbalance. I just saw NOAA defame the Argo buoy data which seems to be the only reliable means to measure ocean energy uptake. If they tell me the Argo surface record is flawed then I got the jitters using it for very subtle changes at 1000 meters below the sea surface.
By “defame” I assume you mean “applied some form of data processing”. Which, having wasted a lot of breath attempting to explain this to Euan Mearns, is a perfectly reasonable thing to do.
No, they defamed the Argo buoy data. The latest version assumes ship readings are more accurate than buoy readings (there’s a 0.12 C difference, the ship’s temperature readings run hotter). The ocean energy uptake measurements are looking at changes in the 0.01 degree range down to 2000 meters. Now NOAA comes out and states the data taken by seven thousand buoys needs to be corrected UP by 0.12 degrees C. Interesting?
Hi Fernando,
Sam seems very competent and also follows the science closely, perhaps you are in error?
I thought the correction was in older data that was gathered during World War 2 where there were other matters at hand and perhaps corners were cut in the interest of keeping ships on the surface. I have not read any of the recent papers on the buoys, so perhaps I have misunderstood.
http://www.realclimate.org/index.php/archives/2015/06/noaa-temperature-record-updates-and-the-hiatus/
Chart from post above below:
Dennis, the correction was done this past year to ARGO buoy data. Those buoys are a fairly recent development.
Fernando,
Your essential problem is that you are a drive-by shooter type of analyst.
You really have no commitment or possibly aptitude for doing a formal analysis such as what DC regularly provides.
And that is the way of the pseudo-skeptic and denier.
“Many Republicans resist accepting the overwhelming scientific evidence of climate change because they fear it will be used as an excuse to expand big government. Here’s what should give them pause: by delaying action on reducing global carbon emissions for more than two decades, we have already significantly increased the likelihood that disruptive global warming will lead to the kinds of government interventions they most fear and seek to avoid. Climate change is, in fact, already causing an increase in the sorts of extreme weather events — particularly floods, extreme droughts, and heat waves — that almost always result in large-scale government responses. The longer we wait, the more massive the required intervention will be.
In the future, as the devastating effects of climate change unfold here in the United States, natural disasters will result in a greater reliance on government — especially the federal government. (Of course, our grandchildren will not call them “natural” disasters, because they will know all too well who caused them.) What this means is that the work climate deniers are now doing only helps ensure that we will be less ready for the full impact of climate change, which means greater government interventions to come. Put another way, climate deniers are now playing a crucial role in creating the nightmare they most fear. They are guaranteeing the very future they claim to want to avoid.
And not just at home. As climate change unfolds around the globe, climate disasters will give undemocratic forces the justification they seek to commandeer resources, declare martial law, interfere with the market economy, and suspend democratic processes. This means that Americans who care about political freedom shouldn’t hold back when it comes to supporting climate scientists and acting to prevent the threats they have so clearly and fulsomely documented.
To do otherwise can only increase the chances that authoritarian forms of governance will come out ahead in a future in which our children and grandchildren, including those of the climate deniers, will all be the losers, as will our planet and so many of the other species on it. Recognizing and emphasizing this aspect of the climate equation may offer some hope of enabling more moderate Republicans to step back from the brinkmanship of denial.”
http://www.tomdispatch.com/post/176011/tomgram%3A_naomi_oreskes%2C_why_climate_deniers_are_their_own_worst_nightmares/#more
Huh. Reading about how the ozone hole problem was addressed is just remarkable.
Once upon a time, politicians were able to rationally look at the science and act accordingly. It seems like doing such a thing is all but impossible today.
Is that weird?
Not really weird at all. CFCs were banned by the US Environmental Protection Agency and other international agencies followed suit. It required no act of congress nor any vote of the people. DDT had a similar demise. There was no right wing movement against them as there is against any action to limit CO2 emissions.
The banning of CFCs and DDT required no mass conversion in the minds of people and required no sacrifice by anyone.
The global warming problem is a different animal altogether.
Naomi Oreskes isn’t a reliable source for anything. She’s a propagandist. You should read her Twitter, she tries to repress any expressions by young scientists who fail to toe the party line. She’s as bad as Norgaard, who wants to give psychiatric treatments to people like me because we don’t like the IPCC’s work.
Reminder about 1st of month oil pricing. June 1 is defined.
The March 31 event of this year said that as of 1 April the average price of first day of month of the last 12 prior was $81/b. This defined the “reserves impairment” for collateral vs 90s before.
As of end of this month, the new valuation price for “reserves impairment” will be $69. $12 loss from $81 or a 15% decline in value of in-the-ground collateral from 1 April of this year.
The well completion totals are going to continue to decline for reasons other than fracker choice to “wait for a higher price”. It’s not their decision. It’s the lender’s decision.
Just for some balance, I do NOT think this is a good idea:
Solar Space Race Already Underway
Has space-based solar power just had a breakthrough moment?
Alternative Energy News reports that on March 12th, 2015 Mitsubishi Heavy Industries, Ltd. (MHI) successfully conducted a ground demonstration test of “wireless power transmission.” In the test, MHI successfully transmitted 10 KW of electricity via microwave to a receiver 500 meters away. This test also confirmed that advanced control technology could direct the microwave beam to stay on target. Will this success pique other countries’ interest?
Japan plans 1GW Space Solar Plant by 2030
Japan, China, India, Europe and the U.S. have research programs to harvest solar energy from space. Following the Fukushima Daiichi nuclear plant accident, Japan conducted a review of all its available energy options. In 2014, the Japanese Aerospace Exploration Agency (JAXA), considered the global leader of space-based solar systems, presented a 25-year development roadmap of ground and orbital demonstrations that culminates in the 2030s with a 1GW commercial system.
While this somewhat solves the intermittency problem, it adds several layers of complexity, a lot further to haul the construction materials and a lot more difficult to arrange for trips to perform unscheduled maintenance. At any rate, when Elon Musk was launching the Tesla Stationary Storage product, he expressed a view on space based solar power, saying “Now a lot of people aren’t clear on how much surface area is needed to generate enough power to completely get the United States off of fossil fuels, most people have no idea, they think that it must be some huge amount of area like, maybe you need these satellites in space, and like sort of space solar power. If anyone should be in favor of space solar power it should be me but, this is completely unnecessary because actually very little land is needed to get rid of all fossil fuel electricity generation in the United States”. If he said it, it must be so! >;-)
That would make one hell of a weapon. A little nudge and they can fry the Mao mausoleum in Tienamen square.
An article, and images, I find rather disquieting:
Migrants force their way into UK-bound lorries in broad daylight in shocking new footage as Calais struggles to deal with thousands trying to cross illegally to Britain
http://www.dailymail.co.uk/news/article-3081389/Migrants-force-way-UK-bound-lorries-broad-daylight-shocking-new-footage-Calais-struggles-deal-thousands-trying-cross-illegally-Britain.html
Even more disquieting: their living conditions: illegal refugeecamps with no resources at all. Covered by the woods, or not. Covered by plastic, or not.
http://www.dailymail.co.uk/news/article-2721311/Hundreds-desperate-refugees-Africa-Middle-East-set-squalid-Jungle-2-camp-Calais.html
The weather is pretty nice at this time of the year. What they need is a conveyor belt system to take them to ships which take them back to the African coast. The EU policy is completely irrational. It’s going to get fixed, but I sure hope this place isn’t crawling with terrorists by the time new laws are in place.
I believe Ian Morris refers to climate change, unregulated mass migration, pandemic and state failure as the ‘Horsemen of the Apocalypse’. I’m sure decreasing net energy flows don’t help either.
http://www.nytimes.com/aponline/2015/06/06/world/europe/ap-bc-eu-italy-migrants.html?_r=0
The steam of people out of the collapsing areas of the Middle East is, I believe, the largest movement of refugees since world war 2. It’s frankly a bit scary. The population of the middle east has exploded in recent years, and what with the peaking in oil production of various states and the fact that it is going to be one of the parts of the world which climate change will hit hardest, it seems unlikely that the flux is going to decrease any time soon. It’s awful seeing suffering on such a scale, espcailly all the children (who make up a big proportion of the population) who had nothing to do with it all. God knows what we can do about it though. There’s no way in hell we can build a wall. Never has worked, never will.
I wonder if we are entering an age of massive and increasing migration, on a global scale, as people flee civil unrest, e.g., Libya, and poor economic conditions. Assuming that things continue to get worse in places like Greece and Venezuela, which seems likely, one would expect to see increasing emigration out of these countries.
Well, population growth in the near future is largely projected to be centred in Africa and the middle east. Certainly there’s a large number of places in these regions which are unpleasant to live in, and merely adding more people seems unlikely to improve matters in this regard. More people would seem to indicate more migration being the likely outcome.
As regards Greece, I think “worse” is somewhat relative when compared. I visited last year and while certainly things have been much better there, they still have functioning water, electricity and so on. A heaven compared to Syria I’m sure.
A sign of the times, from the US in the Thirties:
Sam, the ones we are getting here seem to be subsaharan, they are brought in by smugglers, and for some reason we get tons of Senegalese. Or maybe the government only releases the guys from Senegal? They only started trouble in town one time, but we really can’t keep them here, there is too much unemployment. So we need to ship them to Brussels.
Resilience just picked up this article about solar power in Australia which was originally posted at Yale 360.
It is well worth a read when it comes to understanding the ” right now TODAY ” potential of solar power, especially in places with a good solar resource and high electricity prices.
As the industry continues to scale up , and fossil fuels continue to deplete and thus get to be more expensive, we WILL learn how to live with lots and lots of solar power- even if it means just running a dual wiring system in our homes and businesses and diverting some electrical loads to an entirely off grid status.
As a matter of fact I have a good friend in Hawaii who has TWO solar pv systems- one grid tied and one that is not. The independent system runs his air conditioning – when he needs it- and charges up a battery bank adequate to run his lights, cooling fans , computers, refrigerator etc at night. He has had this independent system for over a decade iirc.
http://www.resilience.org/stories/2015-06-15/despite-hurdles-solar-power-in-australia-is-too-robust-to-kill
Mac, the Australian government was forced to cut back the subsidy for solar, because as ordinally set up it was irrational. The subsidy is what induced the home solar panel purchases.
Here’s a recent MIT paper discussing these irrational subsidies used by governments in the USA:
http://ceepr.mit.edu/?wpdmdl=630%22%20%3E%3Ci%20class=
Quoting from it:
“This analysis reveals that there is a great deal of variation around overall and regional means of many performance measures, and some vary substantially over time. Some of that variability reflects the poor design of current U.S. subsidy policies, which also leads to social inefficient operating decisions. Section 5 provides a brief discussion of some implications…..”
Mismanagement of anything involving government is a given, considering decisions are made by committees and various players meeting in conference. We all know that as such things go , subsidies are sledgehammer tools whereas razors might work better.
But managing an undertaking like changing the electrical generating and distribution industry is more like fighting a war than running a business. Nobody should really expect it to be done in an efficient and business like way. Wars are not efficient and business like.
Subsidies in the case of wind and solar power have apparently been successful sledgehammer tools that have enabled these industries to grow to the point that economies of scale are allowing them to survive nowadays smaller and smaller subsidies – and in a lot of cases no subsidies at all.
If any body really knows why Aussie electricity is so expensive at the retail level for consumers, given that it is generated from some of the cheapest coal in the world, please fill the rest of us in. Where is the money going?
I can see the high price out in the boonies , given that there are very few customers per kilometer of transmission line but otherwise?
A can of coke costs 4 dollars in Australia.
Minimum wage is ~20 dollars an hour ( that is a 40k a year job – minimum).
A chicken pot pie costs 10 dollars.
A 2 bedroom townhouse in Sydney is 700k dollars.
Taxes are 45% on wage earners over 180k.
You can get drunk for a living in Australia and have a 40k income, free medical care, free child support, free schooling, etc.
Of course there is no such thing as a free lunch!
They have to import everything but coal, natural gas, uranium, mining and farming. And it is a long way to the land of OZ..
That is where the money is going.
Thanks,
With a minimum wage almost three times ours here in the states, the Aussies shouldn’t have much trouble paying electricity prices about three times ours here.
With pv prices what they are, and electricity prices what they are, and the solar resource being so good, it is likely pv installations will continue even if the subsidy is eliminated altogether.
Aussie electricity prices are apt to keep right on going up, given the nature of inflation and fiat money. A doubling of the nominal per kilowatt hour price within fifteen or twenty years is a safe bet.
I don’t like the idea of militarizing anything. Let me ask you a question, have you read in depth the information about transient climate respinse and equilibrium climate sensitivity?
While I am a pedal to the metal guy when it comes to building out renewables I also believe in the utter and absolute necessity of maintaining business as usual. Long term survival depends on living thru the short term. No bau, no transition to sustainability. We can’t go cold turkey on fossil fuels, that would kill us.
Now the nimby nitwits and well intentioned but ill informed greens have done all they could to keep Canadian oil and gas from being used, shipped and processed thru this country – with the result being that we are missing out on the employment and investment associated with doing so.Beyond that if the shit does hit the fan one day in terms of a hot war, we would be far better off with the oil and gas pipelines being routed thru this country.
I have long argued that the Canadians WOULD get their oil and gas to market one way or another, mountains swamps Arctic winters native people and all be damned or in the case of the local folks, bought off. The old folks may not be for sale but the younger ones are. Does anybody else remember the famous line about American kids coming back from the war? How you going to keep them on the farm now that they have seen gay Paree? The kids have seen the cars and truck and snowmobiles and wide screen tv sets and washing machines etc etc. They are already sold.
I just picked this clip up from the hot air blog.
”TransCanada Corp said on Friday it expects to start construction this year on natural gas pipeline to British Columbia’s Pacific Coast worth at least C$5 billion ($4.1 billion) following a conditional go-ahead by a Petronas-led consortium for what could be Canada’s first LNG export terminal.
The Prince Rupert Gas Transmission line will connect the prolific Montney gas field near Fort St. John in northeastern British Columbia to the Pacific NorthWest LNG terminal, which is planned for Lelu Island on the North Pacific Coast near the port of Prince Rupert.
The conditional go-ahead for the liquefied natural gas terminal is a rare win for TransCanada, which has struggled in recent years to rally support for its crude oil pipeline projects, including the long-delayed Keystone XL line to move oil from Alberta to the U.S. Gulf Coast.
The Calgary-based pipeline company has bet big on Canada’s nascent LNG industry, with deals to build more than C$13 billion in natural gas pipelines to serve proposed export projects on the country’s West Coast.”
Nothing succeeds like success. Once the people along the way start collecting their goodies more pipelines and rail roads are SURE to follow.
US industrial production, particularly final products, is historically at “stall speed”, if not recessionary.
Employment data are overstated since Aug-Nov 2014.
JPS selects US company to supply LNG for Bogue power plant
The JPS said it is in the process of finalising an agreement with Fortress for the supply of natural gas to facilitate the conversion of its 120-megawattt power plant in Bogue, Montego Bay, St. James.
According to the light and power company, the agreement is expected to be finalised by the end of the month.
Commenting on the deal, JPS President & CEO, Kelly Tomblin, said this is a major step for Jamaica and a game-changer for the energy sector, adding that JPS is proud to be able to finally bring natural gas to Jamaica.
Tomblin further said the move will provide fuel diversity as well as play a large role in optimising the renewables on the national grid.
Any body here ever heard of this outfit, New Fortress Energy, part of the Fortress Investment Group?
Go to page three
http://energy.gov/sites/prod/files/2015/02/f19/15_19_lng_nussdorf_0.pdf
They applied for a 20 year export permit to ship LNG from the USA gulf coast. Remember your comment about the pricing mechanism? Why don’t you request the contract signed by the Jamaican company, to see if this is a spot price linked contract or if they have a boutique price escalator? My guess is the price would be say $7 per mmbtu, but whether the Jamaicans were smart enough to negotiate a quality escalator is a big unknown.
The Global Apollo Programme: a summary
The challenge
To avoid irreparable damage, governments of the world have agreed to limit the world’s rise in temperature to 2 ̊C. This means an absolute limit on the total accumulated CO2 that can be produced. On present trends that limit will be breached by 2035.
So we must urgently reduce our annual output of CO2.
The method
Carbon-free energy must rapidly become less costly to produce than energy based on coal, gas and oil.
This requires a major scientific and technological programme of research, using the best minds in the world and the best science.
The objective of the Programme
Within 10 years, baseload wind and/or solar power will become less costly in every country than power based on coal.
The scale of the Programme
Countries joining the Programme will devote at least 0.02% of GDP to public expenditure on the Programme over a 10-year period.
The organisation of the Programme
The Programme will be modelled on the International Technology Roadmap for Semiconductors which has reduced semiconductor prices year on year for thirty years.
There will be a Commission of countries which decide to join. This will appoint a Roadmap Committee which identifies the bottlenecks to cost reduction year on year and co-ordinates international research to unblock the bottlenecks. Areas to be tackled include electricity storage and transmission, and the generation of wind and solar power.
It is hoped that the management of the Programme will be co-located with the International Energy Agency in Paris but the Programme will include many countries that are not members of the IEA.
http://globalapolloprogramme.org/
http://cep.lse.ac.uk/pubs/download/special/Global_Apollo_Programme_Report.pdf
Tee hee hee. Another ITER?
come on Fernando, the ITER was only mentioned as a R&D program that is focused and well funded.
Ezry. I assume you don’t know ITER is a fiasco?
not the point.
so effin dismissive of things….
isn’t this what you have been saying?
“But a major problem with solar and wind energy is intermittency. The timing of
solar flux may be easier to forecast than of wind, but at night time there is no light.
Thus, if renewable energy were to supply base load electricity, it would have to be
stored and some of it would need to be stored for some months to meet the peak
demand in winter. This would add to the cost. So there is an urgent need to develop
better ways to store electricity.”
These guys are trying to organize a system to address this and it evokes virtual giggling.
As my daughter says, whatever.
Why does everyone think that what has happened with semiconductor pricing can happen in other industries? If that were even remotely possible, we would now be building 50,000 square foot mansions at a cost of less than a 400 square foot log cabin 200 years ago.
I’m trying to research that subject. My preliminary conclusion: it’s caused by “conga line syndrome”. The same problem which led crusaders to embark on boats to later end up dead or in slavery.
What?
They are trying to follow a success
“3. Roadmap Committee. The Programme will generate year by year a clear
roadmap of the scientific breakthroughs required at each stage to maintain the
pace of cost reduction, along the lines of Moore’s Law. Such an arrangement has
worked extremely well in the semi-conductor field, where since the 1990s the
International Technology Roadmap for Semiconductors (ITRS) has identified
the scientific bottlenecks to further cost reduction and has spelt out the
advances needed at the pre-competitive stages of RD&D. That Roadmap has
been constructed through a consortium of major players in the industry in many
countries, guided by a committee of 2-4 representatives of each main region. The
RD&D needed has then been financed by governments and the private sector.
The cost and performance of renewable technologies have followed a trajectory that, makes it somewhat predictable. The pace is not the same as Moore’s Law but, in the case of solar PV, Swanson’s Law seems to describe the trajectory fairly well so far. I have outlined some cost enhancements for PV that, are in the pipeline, in other posts in previous threads a while back.
In other words, something somewhat similar to “what has happened with semiconductor pricing” has been happening in other industries, making it reasonable to assume that the trajectory will be followed for a while longer.
good article in Reuters on shale companies’ reserve estimates
Guesswork, inconsistency nag U.S. shale oil accounting
Jun 15, 2015
http://www.reuters.com/article/2015/06/15/us-oil-reserves-accounting-analysis-idUSKBN0OV0WX20150615
Steep downward revisions to oil and gas reserves at the end of this year are likely to increase scrutiny of how energy companies tally future barrels – a process that has become more opaque with the rise of shale drilling.
The revisions due in December will reflect a deep plunge in crude prices and should not come as a surprise for investors who have been pouring billions of dollars into U.S. oil companies betting that crude prices will recover.
But investors may not fully appreciate other risks stemming from the wide variety of methods companies use to estimate and vet their reserves, or economically-recoverable oil and gas.
… there is plenty of uncertainty in the industry as measuring unconventional resources such as shale oil is a young science and there is no uniform process for reserve reporting, geologists, investors and lawyers say.
In contrast to financial reporting, the U.S. Securities Exchange Commision does not require outside auditing for reserves. That leaves the process “a little opaque” according to Stewart Glickman, director of energy research at S&P Capital IQ in New York.
Of the 41 exploration and production companies in the Dow Jones Oil and Gas Producers Index, 15 companies had independent petroleum engineers generate their reserves estimates for them.
Another 18 companies came up with the estimates themselves and had an independent engineering firm audit those results, Securities and Exchange Commission filings show.
Four of the firms generated their own results and had consultants review the procedures and methods used to prepare the estimate, but not review the underlying data.
Meanwhile, four other companies had no outside reviews. Exxon Mobil Corp, Chevron Corp, Murphy Oil Corp and Newfield Exploration Co prepared the reserve estimates entirely on their own.
Chevron and Exxon both said they take a rigorous approach to booking reserves and comply with all relevant standards.
Newfield said it has always reported its own reserves.
“Our founder often stated that ‘no one knows the reserves like our own engineers,'” spokesman Steve Campbell said.
John Lee, a reserves expert at the University of Houston, said the SEC debated whether to require an outside reserve auditor when modernizing rules in 2009, but ultimately decided a company’s own engineers knew acreage better than third parties.
He also said there likely would not be enough auditors available to do the work if an independent evaluation were required.
Another source of concern is a provision introduced in 2009 when the SEC modernized reserve rules that allows companies to add reserves by letting companies report reserves from undrilled locations provided they plan to develop the property within five years.
Since then, the SEC has sent letters to dozens of companies to inquire about their “proved undeveloped reserves” and at times demanded some be removed, according to public filings and lawyers. In May, well-known short-seller David Einhorn took aim at shale oil companies, saying most of their undeveloped reserves cannot be profitably produced.
Samantha Holroyd, who is responsible for valuing and managing oil and gas properties for private equity firm Denham Capital in Houston, offered a cautionary tale.
She had about $50 million to invest and was given a reserve report about a seller’s acreage that had been reviewed by a third-party consultancy. She later discovered the firm had not done any extra work and just regurgitated the client’s numbers.
The lack of clarity around reserves reporting adds to a longstanding criticism of the shale industry’s capital intensive business model, in which new wells must be constantly drilled to replace output from existing ones that rapidly decline.
Calculating how much oil and gas can be produced from conventional resources has always been an inexact science.
But wells drilled into shales and other rocks have made the process even tougher as such oil reserves vary a lot between wells.
“The problem is more difficult in shale,” said the University of Houston’s Lee. “We don’t have measurement techniques that are sufficiently accurate.”
AlexS. Great find!
I think a lot of blind money has been and continues to be thrown at these companies.
Unless price suddenly spikes in second half of year, reserve and PV10 will fall quite a bit. Would think this has to be priced in?
Indeed a very interesting article, that comes back to several of the recent talking points here, regarding reserves. When people are awarded for their own optimism (read: managers getting extra bonuses for growing reserves, of which the estimates are based on their own guesses), expect problems (incentive-caused bias).
Hi Enno,
I wonder if the banks will become skittish about further lending to companies that exaggerate their reserves. Eventually “paper reserves” will become exposed and the companies stock price will take a huge hit when that occurs. Many of the CEOs have a lot of their wealth tied up in stock options and it would seem there would be an incentive not to be caught skinny dipping as the tide recedes.
It will be interesting to see if there is a significant difference in the level of reserve writedowns in the 2016 10Ks in companies that have their reserves audited vs those that do not.
Thank you, Alex. Nothing in this article is new news, not to me anyway. We have been thru all of this within the past decade with the shale gas industry, who grossly over inflated its reserve estimates and exaggerated its profitability. We can thank Berman for blowing that whistle. It should be of no surprise to anyone that the shale oil industry would try to get away with the same stuff.
What is astounding is that it has. Venture capitalists with short term memory loss have foot the bill for all this LTO development, to the tune of over 300 billion dollars. And counting. It is remarkable.
Quickly, I mentioned last week in a different life that often big banks would jokingly tell me to leave the “proven” undeveloped acreage and PUD hubbub off my reserve reports, that all they wanted to know is if I got run over by a truck was there enough proven reserves from existing wells to get paid back with a big margin of error. I recall asking a big bank once if my reserve report needed to be audited before submitting and the guy said, without cracking a smile, it depended on whether I wanted him to use PV10 or PV60.
Things have changed. How this is all going to shake out 10 years down the road is going to be…fascinating.
Mike
If you were a bank and knew you could not go bankrupt, what would you do?
Dennis , Mike, Fernand, Shallowsand, any other guys who crunch numbers –
What are your opinions as to the price that would make American tight oil a reasonably safe and profitable industry with rational lending standards ?
It appears that none of you think tight oil is profitable under normal circumstances -meaning the bankers charge the industry meaningful interest rates etc – at a price less than a hundred bucks. So I suppose my question is how much higher than a hundred?
Mac, I would be happy to invest at $110 per barrel WTI. But I wouldn’t put all of my portfolio into that type of field, it also requires a better approach to manage CAPEX. I’m thinking of using multiwell pads, carefully sequenced wells, and cheaper transport. That would keep me out of North Dakota to focus in Texas.
I wouldn’t invest in Vaca Muerta, because the government is corrupt, and they have lots of labor problems. But I would nibble in Western Siberia with Rosneft if I had something of value the Russians wanted elsewhere. I think 110 per barrel sure seems like a pretty safe price in 10 years.
OFM. Tough question to answer. However, without a stable high oil price, most of this production is tough to invest in. It seems to me price stability may be gone for awhile, given OPEC is not going to support the price in the near term.
I think WTI at Fernando’s price, $110, stable over several years (meaning $95-125 range) plus gas at $4+ would keep get the better companies out of trouble. Some are past saving.
CNBC has an article out today indicating many shale are going to be cut off at the knees by the banks in September when credit lines will not be extended further.
Also, I am reading that the terms of the most recent round of bond issuance is pretty tough compared to that issued in prior years. That could also cause some BK or distressed sales.
I agree with the assessment of Fernando and and Shallow Sands for the most part. I would say above WTI $90/b (2015$) is needed and price stability would be beneficial($90-120/b). Basically the AEO 2015 high oil price case would work well for the LTO industry. Chart of EIA’s AEO 2015 high oil price case for WTI oil below.
Alternative high price case with oil at $75/b in 2015, rising by 25% for one year and then 4.2% per year from 2016 to 2040 with AEO high price case included for reference.
The EIA is planning to improve its weekly oil estimates, now for exports and consumptions and later, probably, for onshore production
EIA to sharpen U.S. weekly oil numbers with real-time export data
Jun 12, 2015
http://www.reuters.com/article/2015/06/12/eia-exports-data-idUSL1N0YX16620150612
The U.S. Energy Information Administration has been granted access to real-time oil export information for the first time, allowing it to improve weekly estimates of fuel demand at a time of intensifying scrutiny of energy data.
Currently, the agency uses a model that incorporates the most recent 60 months of export data to estimate current weekly export levels, an inexact process that often causes a lag in trends. The most recent monthly data, pulled from the U.S. Census Bureau, is roughly two months old.
In the upcoming weeks – there’s no specific deadline – the EIA will incorporate real-time trade data provided from the Department of Homeland Security’s Customs and Border Protection, according to Robert Merriam, manager of EIA’s highly-watched weekly status report.
The new trade data will address one of the biggest uncertainties in its weekly fuel demand data.
The EIA’s reports are designed to estimate U.S. consumption of petroleum fuels by calculating a “product supplied” figure based on refinery output, inventories and estimated trade flows. To do this, the EIA must distinguish domestic demand from non-U.S. demand, Merriam noted.
While the EIA has long had access to near real-time import data, it has lacked such data on exports, leaving its demand figures subject to substantial revisions.
It is the latest effort by the EIA to address gaps in its data collection system at a time of enormous change in the U.S. energy system. Earlier this year it began publishing monthly data on crude oil transported by rail, and hopes to begin gathering more timely data for onshore oil production soon.
I have noticed in the ND Bakken there are a lot of very small non operated working interests. Many are now popping up on auctions.
How did those come about?
In my opinion these are mostly mineral owners who refused to be pooled in a unit and opted to assume a WI in the unit instead. There are some funky laws in ND about non participating mineral interest backing in after payout of a well occurs. Now all those “smart” wannabe oil folks have WI and the expenses exceed the income, tee hee.
I think [but, do not know for sure] that almost any WI holder in most states can elect to not participate in drilling a well and then back in after a payout penalty of some sort.
Yes, that can be correct. My explanation to Shallow’s question pertained to non-participating, unleased mineral ownership in a pooled unit in North Dakota, however. If an operator has made a good faith effort at leasing the minerals and can’t, or the owner won’t, those minerals can be converted to WI ownership, after penalties are recovered from drilling and completion costs. Something like 50%, I believe. Lots of mineral owners later in the Bakken play thought they could “out smart” operators by refusing to lease, believing they would make more money becoming a working interest owner. Which might have worked at 100 dollar oil but does not at 30 dollar oil and plugging and decommissioning costs staring them in the face. Now there are many 0.035 WI parcels with 0.00262 NRI, with negative cash flow, for sale. Until that interest is sold, the mineral owner is on the hook for costs, as it should be.
Mike
Mike. Clueless. Thanks for the information. I should have thought of that, but around here we have not had people want to own WI instead of RI.
I bet the decline in these wells combined with the oil price collapse has caused some uneasy feelings. A real, “welcome to the oil business feeling.”.
This also got me to thinking. I bet given the size needed for a shale unit with a 10,000 ft lateral, and that these shake areas have been know to have oil for many years, title on these must be a bear.
Given how rushed everything has been, I wonder how many title screw ups there have been in these shale areas, with the severed minerals, etc. Lots of work for landmen and attorneys.
Which leads me back to question about undeveloped acreage. What is happening with it? Companies have combined millions of acres expiring. Any idea what the trends are there? Hope there are not a lot of reserves booked on those.
So many moving parts.
The title can be very complicated on a thousand acre pooled unit; 339 separate mineral interests in one that I am familiar with. Curative work is done, title cleared and division orders prepared almost before any shale well is drilled, however. There are mistakes made, sure; not that many, IMO.
The first four years of the EF resource play was a mad rush to acquire as much acreage as possible in the belief it was all productive. Good trades were made early (for companies) and later the trading favored Lessors. A lot of later (2011) leasing was on 3 year terms with two year extension options. As the sweet spots were delineated a lot of options on scenery were not exercised. I think the stuff that will make money at 55 dollars is long leased, and long HBP, the rest will terminate and those costs expensed, immediately. The leasing boom is over.
If there were make-believe reserves “booked” on undeveloped acreage then the money folks who bought into that garbage deserve to eat the big enchilada, as far as I am concerned.
Mike
Mike. So when I see a company has 500,000 acres HBP and 1,000,000 undeveloped, likely most of the undeveloped will expire at this point?
Do not know the how the accounting works, but I assume any expenses not already taken on that stuff will be charged the year the lease expires? Another hit to earnings?
Read a blurb on leasing in ND. Said the first leases (2008 and prior) 12.5 to 15% royalty was common. When time got close to running out, many were renegotiated for 20-25% in exchange for extension. That could be a way around problem without throwing out more $$ but can really hurt economics if ever develop.
Every 10K I have looked at for shale oil companies show more undeveloped net acres than developed.
Yes, of course that acreage will expire and likely very soon. For it to be classified as proven undeveloped some of that would be HBP, you’d think, but then again I have no idea how those shale fellers get away with half the smelly stuff they do. One thing for sure, they have retreated to their core areas and they are NOT wandering around drilling wells on the periphery of known sweet spots and geological proven areas of interest anymore. They’ll let lots of acreage go. I read mineral forums occasionally, Lessors are already in a panic.
Acreage acquisition and associated costs (land and legal) is depreciated. If they were to release that, or not drill it, it can expensed in the same year it is released or expires. That might not make their 10K’s look good, then again without IDC they can still probably use anything they can get to offset income.
One rule of thumb I have worked by all these years, in tough times don’t give up NRI, no matter what. I think they’ll be able to lease all that scenery again someday for much less bonus and much better NRI in the absence of a feeding frenzy like they one they were on 5 years ago.
On a separate, unrelated matter I see the 30 month WTI strip out has a narrowing contango, down to 6% of current WTI. The impetus for holding drilled wells to frac later is losing it’s luster and I would not be surprised to see frac’ing pick back up again. I see that already in S. Texas; I do not believe that frac back log bunk.
Mike
Hi Mike,
Can you define some of the three letter acronyms? The only one I know is WTI(West Texas Intermediate), I imagine only a few here can follow your comment without knowing what HBP, IDC and NRI mean.
Note it was Shallow sands that introduced HBP, not Mike, I am sure Shallow Sand and other oil guys know all the abbreviations, but the rest of us would like to learn.
Ok I know WI is working interest, RI is royalty interest and NRI is (probably) non-royalty interest (which I can’t really understand what that is, the same as WI?).
HBP–Held by production
IDC–Intangible drilling costs*
NRI–Net revenue interest
*Expensed in the year incurred, instead of being capitalized
Jeff is on it. Working interest must be reduced by RI and ORRI (overriding royalty) burdens; in other words 100% WI might have a net revenue interest of 0.7500, meaning the WI pays all the bills for 75% of the revenue.
The Texas Supreme Court just ruled on the definition of “free and clear of all costs” for RI and ORRI in Hyder v. Chesapeake, of great interest to those of us in the business and to CHK who has been chingling folks for years and now must pay lots of folks lots of money back.
Intangible drilling deductions apply to certain aspects of the drilling process and play a big role in reducing the taxable income of an oil company. IDC’s are incentive to keep drilling wells, particularly, stinking shale wells, IMO.
Keep up the good work, America:
http://fuelfix.com/blog/2015/06/17/gas-guzzling-u-s-drivers-shock-even-analysts-as-refiners-profit/
Mike
Thanks Jeffrey and Mike.
It seems quite clear that as long as we have existing energy availability and the global economy continues to muddle along there will be plenty of “renewable energy” projects happening.
What also seems clear is that both the existing energy system and the global economy are on the verge of collapse and when that happens “renewable energy” projects will cease.
Hi Jef,
It is far from clear that the global economy is on the verge of collapse, unless you define verge as within 15 to 20 years.
Peak Oil: Myth Or Coming Reality?
If oil prices followed the conventional law of demand, then low oil prices would result in a higher consumption rate. However, 2014 saw something remarkable happen. BP notes in its 2015 Statistical Review that energy consumption grew at just 0.9 percent in 2014, the slowest rate in almost twenty years. That came even as prices declined.
The 2014 Oil Price Shock did not improve the consumption rates in North America, Europe and Eurasia
Image Source: FT.com
What if demand growth keeps slowing? Does this trend indicate that global demand for crude oil will eventually hit a ceiling? “Global oil demand will peak within the next two decades”, said energy expert Amy Mayers Jaffe in a recent article for The Wall Street Journal.
The old Peak Demand story again.
I agree the whole peak oil is only about supply story is silly. How much oil is produced is a function of both supply and demand so peak oil is a function of both supply and demand as anyone who has a freshman college understanding of economics would know.
It is the old economics adage about determining whether supply or demand is more important is like deciding which blade of a pair of scissors is responsible for cutting a piece of paper, both blades are needed for an effective pair of scissors.
WSJ: Europe Asks if Greece Could Default Without Exiting Euro
http://www.wsj.com/articles/europe-asks-if-greece-could-default-without-exiting-euro-1434397500
“Proponents say it could spare Europe the embarrassment of one of its members crashing out of the eurozone, damp some of the market panic that would likely follow a default, and avoid setting a precedent that would undermine confidence in those still inside.”
So let’s analyze this above sentence about objectives:
1) Don’t allow embarrassment.
2) Don’t allow market panic.
3) Don’t undermine confidence.
To me this looks very similar to creditor’s objectives for shale oil producers 🙂
Clarifying.
There is no such thing as sovereign default. Unless the lending entities forgive/expunge the debt, it remains.
Forever. Compounding.
If Greece doesn’t pay, there can be swap consequences but in the context of rampant intervention and zero existence of free markets since 2009 one must presume that all relevant swap contracts have been isolated and addressed by now to defuse them.
Now from that perspective there is a thought shale relevant. If you want a bailout (or your debt expunged), you have to raise the ante to the stratosphere. Greece SHOULD have been creating zillions of off the books swaps and flooding various places with them, broadening and deepening the magnitude of catastrophe that would loom. THAT is how you get bailed out. No pansy 300 Billion stuff. Leverage that up to trillions. What have you got to lose?
The shale folks should be similarly configured. Fire people wholesale, shut down all oil flow, MAGNIFY THE EVENT, make it 10,000X worse than anyone expected.
Then wait for the Fed to write checks.
you know maybe Greece was creating these swaps and could blow the whole financial system Alamo style but on the end it does not matter for average Greek. They have to figure out how to survive on 500$-600 pension with biblical inflated cost of living.
As for shale industry it is same thing, they can pretend and extend for a while but I just heard that Gap is closing 175 stores so for the average Gap worker that would mean how to survive with very little. I have that weird feeling that economy is already hitting the pavement worldwide.
Greece needs either to exit, or else the Euro needs to be completely restructured to a united states of europe. Governments borrowing in a foreign currency, as the Euro effectively amounts to, is a recipe for disaster.
Hi Sam,
I agree 100%. The Euro was never a good idea, the horse is supposed to pull the cart, pushing does not work well.
Dennis,
Sooner it happens the better, in my eyes. The Greek people have suffered more than enough.
If they introduce capital controls soon then that will have the same effect as starting a new currency (‘Greek Euro’) without anyone realising that’s what has been done. Then they can begin to devalue and sort the mess out.
Hi Sam,
I did not realize that capital controls were part of the plan.
Interesting take. We could have a “Greek” Euro, a “French” Euro, a “German” Euro, etc, that way the European economists that thought the “Euro” was such a smart idea might save face.
Most Europeans still think the Euro is a good idea, but think a “United States of Europe” type of Federation is a bad idea.
The political union needs to come first(horse) followed by a monetary union (cart). The Europeans seem to have a different horse-cart arrangement.
Sometimes there is a good discussion of an article at Resilience , sometimes not.
Resilience picked up a Kurt Cobb piece titled ”Delayed Gratification for OPEC….” in which he argues that the basic reason the Saudis have not cut production is to destroy the American tight oil industry.
I posted the following comment which has not had a single reply pro or con.
”
xxxx
I don’t buy the argument at all that the intent is to destroy the American tight oil industry.Whatever effect the current low price has on American tight oil is merely icing on the cake for the Saudis and the rest of the Opec exporters – and exporters in general.
The tight oil industry can NOT be destroyed by low oil prices. It can only be beaten down to its knees the way you can beat down weeds and crabgrass with a lawnmower. As soon as you park the lawnmower the weeds and crabgrass shoot right back up again.
The tight oil industry is now established. The land is leased, the regulatory apparatus is in place , the roads are in place, a lot of pipeline and rail capacity has already been built, etc etc etc. The drill rigs exist, the frack rigs exist.
The only way the Saudis or anybody else can keep American tight oil down long term is to keep the price down long term.
Anybody willing to think this sort of issue thru must come to the conclusion that within a few months of oil prices rising the American tight oil industry will rise again. What pray tell is to stop the industry from taking off again? The fear that the Saudis will deliberately flood the market with oil ? That is NOT a viable long term strategy.
Beyond that the Saudis have been pumping millions of barrels day after day for a very long time now and their own consumption is rising fast. Rust and depletion never sleep , courtesy of Matt Simmons.
I do not believe they can AFFORD to flood the market very long or very often.
I do not even believe they have the CAPACITY to do so except at a time the world economy is anemic , as it is and has been recently.
The really important reasons for the Saudis not cutting their production are easily figured out. They are anxious to put a hurting on their local enemies and the Russians – who they also perceive as enemies- via keeping the price of oil as low as possible.Their enemies are dependent on selling oil to maintain their economies and their war machines.
The Saudis have megabucks in the bank. The others don’t.
Beyond this consideration the USA and other western importers are anxious to put a hurting on the Russians due to the Ukraine mess.
The Saudis and Yankees are in bed together.
Uncle Sam cares a thousand times more about the positive effect of low oil prices on the economy than he does about the troubles of the American oil industry.
Furthermore when the Saudis HAVE cut back in times past some other members of the cartel continued to pump and cheat at the expense of the Saudis.
THIS time by not going it alone the Saudis are serving notice that they WILL NOT again bear the cost of cutting THEIR OWN sales unilaterally unless the rest of the cartel plays honestly and cuts as well.
xxxx
I have never claimed any expertise in oil, or to be better informed about oil than any other layman who pays close attention to the energy industry and follows a couple of oil blogs such as this one.
But I do rightly (or not ! ) claim some expertise again at the well informed layman’s level when it comes to international politics. My opinion ( right or wrong again as the case may be!) is that a person who follows politics may have a better understanding of the oil industry than a person who does not. This is a forest versus the trees sort of thing.
So – here is a question for the hands on guys.We all know the tight oil industry is on its knees right now with rigs stacked by the hundreds and men laid off by the thousands.
Do you believe the industry will come back quickly if the price of oil goes back to around a hundred bucks or more ? I don’t see why it will not so long as the banks keep loaning the operators money at that price or a higher price.
The men working in the industry are there because of the high wages more than any other reason imo. They aren’t going to find other employment that pays nearly as well, and if their old employers call them back most of them will return imo. I have worked out of a suitcase and a camper myself. Trades people don’t generally expect to work for the same company forever. They follow the money and the big jobs.
It certainly makes no sense whatsoever to me at least to think the Saudis are willing to keep the price of oil down around sixty bucks long term. They don’t have THAT much money in the bank or THAT much oil to sell at less than they can get for it later.
OFM. Hopefully, if the oil price creeps back up, the US Shale industry will at least be a little more cautious and hopefully those lending them money will likewise be a little more cautious.
1,609 rigs mostly drilling $7-11 million dollar wells was not cautious, nor is 643 drilling mostly $6-9 million dollar wells now, given almost all are doomed to not payout and given almost all are being drilled with at least 75% borrowed funds.
If you went through a bad farming year, but things then turned around some, I’d think you would not immediately go out and buy a brand new tractor. LOL.
But who knows if that is what will happen. The shale guys will probably try to buy a new tractor if the banks will let them.
Well, I think the lending is beginning to be reeled in. I have no evidence of this, but the way the stocks of these companies are trading tells me something is afoot. Companies like CHK are hitting new lows on no news. I think the bankruptcies in the sector will scare the bejeezus out of the banks. The recoveries on the various pieces of debt will be tiny. I don’t know how the BK judges will react. Will they let the companies keep spending and drilling? Or will they say stop drilling new wells and just collect the incoming cash to pay creditors? In which case what’s left is land, much of which is undrilled and probably worthless. The prospective acreage isn’t worth much. Smart guys like David Einhorn are exposing the Ponzi Scheme. Private equity that bought into shale early will have experienced it firsthand.
Hi Glen,
I agree with you that the LTO business will improve when oil gets back to $90/b or more. One problem is that some of the older guys throw in the towel and retire and this knowledge and experience is hard to replace. I am not saying it can’t be done, but it slows the recovery.
Mike has lived through several of these cycles and would have much better insight as to how this goes in the real world oil industry.
I share shallow sands hope that there will be more caution during the recovery, slow and steady may win the race.
From this thread; “For the record, Nick G misses the point about deindustrialization…“:
With EV’s in light of civilizational (decline/collapse) history, many seem to be focusing on the wrong end of ‘Maslow’s Hierarchy of Needs’ or, in other words perhaps, on priorities. EV’s are a vehicle (literally/figuratively) that contribute to removing/detaching people from planet in a myriad of ways. Ditto with the overcomplexities/diminishing returns/peculiar niches for corruptions inherent in large-scale centralized government.
Want to increase the possibility of saving the climate/planet and at the same time having a better life/lifestyle? Re-attach to the planet and go permaculture! (Which is practically, ‘green anarchy‘.)
IOW, get off the runaway train/Matrix that is BAU/large-scale centralized crony-capitalist plutarchy and plant a lot of trees and food forests, etcetera, and nurture community and such ethical values as care of earth and care of people. It’s not that hard! You can do it! ^u^
”“I also believe in the utter and absolute necessity of maintaining business as usual.”
I will not willingly allow my words to be cherry picked and taken out of context in such a way as to twist their meaning into the exact opposite of my often expressed beliefs.
The continuation of business as usual is NECESSARY to the building out of a renewable and sustainable society.
If bau crashes short term or medium term there is little to no hope that we can scale up the renewables industries sufficiently to shoulder the load currently carried by fossil fuels.
There will be little or no further research into methods of recycling scarce resources, and little or no capital available to institute expensive recycling programs. The sky daddy given gift of falling birth rates resulting from increasing levels of prosperity and education will come to an end and would probably be reversed.
Research in nearly all scientific fields will grind to a halt or near halt.
Caelan preaches about violence without having any real understanding of the subject. If he e really does want a world on fire , the best possible way of achieving it is probably to work to bring about the short term or medium term crash of BUSINESS AS USUAL.
There is substantial hope that the world will remain MOSTLY peaceable so long as we can avoid hot resource wars. The end of business as usual is more apt than not to usher in the beginning of a new possibly global round of hot war as various desperate countries lead by various desperate men conclude that their best hope is to go to war to seize the remaining resources of their neighbors.
Everything I have ever posted here or elsewhere indicates that I believe ” Old Man Business As Usual” is a dead man walking. LONG TERM we will either perish or revert to a preindustrial economy ( meaning any survivors will revert ) or a new generation ” business as usual” will come to pass.
For what it is worth I expect most of humanity to die off within the next century due to overshoot. Some lucky societies MIGHT manage the transition to a new generation ” business as usual”.
Nobody can reason with Cealan, he is like a blinking sign or a fundamentalist priest.
I will ignore his idiotic comments unless he mentions me .
“Pinker’s ‘Long Peace’ and ‘New Peace’ and their alleged declines of violence not only coincide with the numerous and ongoing attacks by the giants on the midgets, the huge expansion in arms, and the new ‘burgeoning’ of torture, but runs parallel with the increasing structural violence of a global class war that has resulted in growing inequality within and between countries, systematic dispossession of vast numbers, a widespread seizure of the commons, major migrations, growing cities of slums, increased ethnic tensions and anti-Islamic fervor, deliberately stoked in a troubled, receptive environment, mass incarceration of minority populations, and more vocal oppositional forces both here and abroad. These do not constitute ‘violence’ in Pinker’s accounting system…” ~ Reality Denial : Steven Pinker’s Apologetics for Western-Imperial Violence, by Edward S. Herman and David Peterson
Hell no. Why should they? Come come. This is Pinker’s Truman Show we are talking about after all!
But, let’s just ignore those itty-bitty problems, (along with unreasonable/fundamentalist priest/blinking sign Caelan and all those of his quotes of course) while we look to such a system (before it crashes) to forge a renewable and sustainable society under an increasingly-cozy planetary blanket.
Unlike old farmer mac and Pinker. ‘u^
Here, I don’t see any electrical grid wires, solar panels or windmills. What a strange way to live. So peaceful and serene…
Bah! We’ll have none of that!
I suppose the small concrete foundation takes some foreign energy/materials import, (if not the quantities needed to support highway infrastructure for EV’s or McMansions), even though the concrete could probably be replaced with some judicious stones and mortar, clamps, timber, and/or screws/dowels/woodworked joints.
Wow! What a perfect place to raise a family. Probably 4 billion rocks just like that waiting for you and your ilk to settle on. Are you insane, or just trying your very best to appear insane?
“Wow! What a perfect place to raise a family.” ~ clueless
Glad you agree! That’s just the cottage, though (but who knows) and maybe the below is the house! ^u^
Equally seriously, the small cabin perched on the rock in a river is apparently in Eastern Europe and has been there for 45 years, and has survived flooding, etc..
There are innumerable very cool homes all around the world that blow McMansions, rabbit-hutch condos, and assorted developer-tract cookie-cutter shlock out of the water.
Oh, and of course, these things take way less materials to build and maintain, and less energy to heat and cool! Is that just insane or what?! Insane I guess if the corporations/governpimps want to sell/tax us more!
Robert Rapier is a guy who generally gets it right. But in this piece he misses a key part of the explanation when it comes to tight oil production since the price crash.
He actually seems to endorse the ( apparently ) badly mistaken idea that drillers are improving their efficiency fast enough that the drop off in rig count hardly matters. Not a single word does he have to say about the huge backlog of drilled wells that are still being brought online many months later after the drillers started stacking their rigs.
At least he gets it right that tight oil production is probably going to start declining very soon – or is declining already.
http://theenergycollective.com/robertrapier/2238671/opec-crashed-us-rig-count?ref=popular_posts
This link has nothing to do directly with peak oil but some of the regulars here may enjoy reading it.
It is a history of the battle between the church and free minds, written over a century ago.
https://www.gutenberg.org/files/49212/49212-h/49212-h.htm
Go-o-o-od morning, slaves,
And welcome to another sedition of
It’s The End of The World As We Know It And I Feel Fine
The show that cuts pollution down to zero.
https://en.wikipedia.org/wiki/Steven_Pinker
Read where due to Canadian dollar weakness relative to US dollar, WTI at $60 here is equal to $75 in Canada.
I was never good at understanding currency matters.
Does a weak ruble relative to the US dollar mean that Russia is not being hurt much by low oil prices, because to them they are not low?
Is the currency situation really the story regarding oil, and is that what is really doing US producers in?
I hear the right wing talk constantly about the need for a strong US dollar (Kudlow). Doesn’t that actually hurt a lot of US business.
Sorry if I seem dense on this topic. It is because I am.
A peak at oil prices in Russia:
prices are off 41% in the USA, vs. 15% in Russia.
Hi Shallow Sands,
Let’s say a Canadian wants to buy a car produced in the US that costs $20,000 US dollars. She would prefer a strong Canadian dollar of say $1 CA= $1US, so that she would only need to take $20,000 CA$ out of her bank account to buy the car (assuming no exchange rate fees). If the Canadian dollar was weak and it cost $2 CA to buy a US $, the car would be twice as expensive. From this perspective a strong currency is good.
The other side of the coin is that if this Canadian citizen worked in the snowmobile(or jetski) industry at a Skidoo (or Seadoo) factory the strong Canadian dollar would make the CA$10,000 snowmobile cost US$10,000 at a 1:1 exchange ratio, a weak Canadian dollar would reduce the US price of the snowmobile to US$5000, boosting sales and ensuring continued employment.
In very simple terms a strong currency makes imports cheaper and exports more expensive and will tend to reduce employment, a weak currency has the reverse effect.
The problem is that majority of exports are resources: oil, gas, potash, grain so with prices way down on most of them and currency not much down you don’t make money. Selling seadoos and skidoos help very little. The other major economic activity like selling houses to each other is wash-zero sum game since there is no added value there.
Hi Ves,
You are mixing two different problems. The low resource prices are simply a function of supply and demand in World markets (if there is free trade) and have very little to do with exchange rates. Given a World oil price of $100 US$/b and a strong Canadian dollar(1 CA$=1 US$), the Canadian oil exporter gets $100 CA for a barrel of oil, if the Canadian dollar is weak (2 CA$=1 US$) the Canadian oil company gets $200/b in Canadian dollars. It is a like 2 for one deal. A weak Canadian dollar would tend to increase demand for Canadian oil (if they marked their prices down to below the World oil price).
Hi Dennis,
If economy is heavily oriented on living of resources than that reflects on exchange rates.
There is no 2:1 deal here. If price of X goes down 50% and unit of price that you produce that same X goes down only 15% then you are short for that difference.
As Rune Likvern wrote in his recent excellent post, EOG seems to be (at least one of the) best and most rational producers in the Bakken. I found it interesting to note that it is the only top 5 producer in ND that brought on less wells on average per month this year, than last year. All the others in the top 5 (Whiting, Hess, Continental, and XTO) increased the number of new wells brought online this year so far, on average per month, vs last year.
The effect it had on the production (gross production of all EOGs operated wells in ND) can be seen below. It’s a pretty steep drop from 96 kbopd in September last year, to 68 kbopd in April this year.
Enno. Good point re EOG. I wonder if what they want to hold onto acreage wise is HBP in the Bakken, so they can afford to sit on it?
However, in looking at their 10K, they had 2.4 million undeveloped acres in US, but not broken down by region. Clearly say though they have acreage they will let expire, that language may just be boilerplate.
What does the decline curve look like for EOG? Seems like maybe after 5 years, even the 600K oil wells drop to under 50 per day? Seems like I counted wells in their best field and almost 1/4 were under 1000 oil per month?
Hey Shallow, big changes in productivity over the last years, but see for yourselves below.
Enno,
Interesting trend. IP rates for the Bakken in general were rising in 2014, but for EOG, viewed as the most efficient shale producer, IP rates were lower than in 2013.
Alex,
Yes, and although we don’t have much data for 2015 yet, it looks as 2015 wells are producing below the 2014 profile. The reason of course could be that they are being held back in this price environment.
The bigger you are, the harder you fall:
http://www.washingtonpost.com/national/rich-californians-youll-have-to-pry-the-hoses-from-our-cold-dead-hands/2015/06/13/fac6f998-0e39-11e5-9726-49d6fa26a8c6_story.html?tid=pm_pop_b
Limits to Growth are here…now.
People will be woken up to the fact that they are citizens, not just individuals.
Flow restriction devices at each tap off the mains….or on the Main serving the whole community.
Best hopes for more rain and especially more logic, reason, sacrifices for the greater good.
Yes, to paraphrase George Orwell, there are those that believe all water customers are equal, but some are more equal than others.
Even small water utilities in CA now are installing battery-powered electronic “smart” meters that can electronically measure and store both instantaneous and cumulative water usage. They then wirelessly-transmit the data to the utility. Last year, my utility sent me a notice that I apparently had a leak, as they detected a small consistent flow 24 hrs a day. I checked and they were right…
The same utilities could use the same features to find out, in real time, who is exceeding their “quota” and send them a warning notice. If things don’t change in a few days, they could just come out and close and lock off their service (most utility meters have a lockable shutoff valve at the meter.) That might get the customer’s attention that conservation is not an “option”.
Statoil to Lose 2,000 More Jobs After Collapse in Crude
Statoil plans to lose about 1,100 to 1,500 permanent employees and 525 consultants by the end of 2016, the Stavanger-based company said. More organizational changes will be announced by the end of the month, it said in a statement.
Oil prospect off Newfoundland faces ‘harsh realities:’ Statoil official
The parcel in the Flemish Pass about 500 kilometres east of St. John’s lies in 1,100 metres of water. It was billed as the largest global find in 2013 with an estimated 600 million barrels of recoverable light crude.
600 million barrels of recoverable light crude.
The biggest find in the world and only big enough to last about a month.
Last who about a month? It would last the world less than 8 days.
Us Yankees of course.
Everybody knows that nobody else matters. 😉
California surges ahead in solar PV capacity; Cracks 10 GW mark
“California has become the first state in the US to top 10,000 megawatts (MW) of installed solar photovoltaic (PV) capacity, according to the latest U.S. Solar Market Insight Report, which was just released by GTM Research and the Solar Energy Industries Association (SEIA).
Today, California has more solar assets than most nations, including the United Kingdom, France, Spain, Australia and Belgium, SEIA emphasizes.
California made history in the first quarter of 2015 year by installing 718 MW of solar energy, raising the state’s total capacity to 10,649 MW – enough to power nearly 2.6 million homes.
The report went on to point out that California had big increases in Q1 across all solar sectors. Of the new capacity added, 231 MW were residential, 88 MW were commercial and 399 MW were utility scale. Together, these installations represented a USD 1.7 billion investment across the state in the first quarter alone. “
So if $1.7 billion buys you 718 MW, $300 billion should buy you 126.705 GW of the gift that keeps on giving, solar PV. If all this PV were located in areas that averaged out at 4.5 sun hours per day (a solar resource equivalent to 4.5 hours of mid day sun) it would generate 20,811 TWh per year or roughly 5% of the electricty generated in the US in 2014. With apologies to Mike and all the other good guys who make a living extracting oil, I’m doing this to put the billions being pissed away on shale oil in perspective.
On another note. According to the EIA “in California, only about 5 out of every 1,000 registered vehicles are PEVs. “. The city of San Francisco has a significant amount of electrically powered mass transit and I remember seeing some electric light rail in Sacramento last year. How much oil use is being offset by renewable energy and electrically powered transportation in California?
islandboy, give it up, mon!
Solar is intermittent, there is no battery technology that works, and it can’t maintain BAU! Furthermore it is too expensive without government subsidies.
Oil and other fossil fuels are the answer… until they aren’t!
Now that sounds a bit peevish Fred, not like you at all.
He was being ironic – the problem is, irony doesn’t work well on blogs.
“He was being ironic.” I think I knew that.
Ah, so I missed you being ironic?
Yeah, subtle humor is hard to do online…
California is future land. Barring a major earthquake they seem to be responsive to problems, not just patching them up and ignoring them later like many areas.
In case anyone was wandering why there has been no new posts since Friday, well I am waiting on the Texas RRC data. I had hoped it would be out yesterday. But now I am in hopes it will be out today. If so there will be a post later today.
EIA report out.
http://www.marketwatch.com/story/oil-gains-on-bets-for-7th-straight-weekly-fall-in-crude-supplies-2015-06-17?link=MW_home_latest_news
Cushing increased, total decreased? Also gasoline inventory increased? Can you guys make sense of this data? WTI dropped to 59.50 range.
boom to bust?
“But the bust is leaving towns like Williston, North Dakota stretched extremely thin as it tries to deal with the aftermath. Williston is coping with $300 million in debt after having leveraged itself to buildup infrastructure to deal with the swelling of people and equipment heading for the oil patch. Roads, schools, housing, water-treatment plants and more all cost the city a lot of money, expected to be paid off with revenues from oil production that are suddenly not flowing into local and state coffers the way they once were.”
http://oilprice.com/Energy/Oil-Prices/The-Dark-Side-Of-The-Shale-Bust.html
Those are exactly the problems Colorado should avoid.
there has been a bit of “back and forth” wrt anarchism.
I am not speaking for Caelan and trying to avoid to reactions that certain works invoke. Also, there are many things that people are trying and that seem to be working outside of large capitalistic and/or statist models.
Think in terms like smaller, direct democratic institutions, local, community based, co-ops, farm to table, farmer’s markets, etc.
Anyhow, Gal Alperovitz has many interesting things….
http://www.garalperovitz.com/
http://democracycollaborative.org/
I don’t think posting a bunch of historic quotes about anarchism in this forum is particularly effective.
Telling people why they should do it is not the same as telling people how to do it.
It would be far more useful for people with personal experience with sustainable communities to share their knowledge in a place devoted to that subject.
I’m interested in the subject and do follow along with discussions in websites devoted to sharable projects, sustainability, peer-to-peer networks, no-growth economics, and so on. That’s not why I come here, though. I’m interested in the economics of oil and fossil fuels.
Also, my concern is that if someone picks fights with people in this forum, that’s not a good example of building consensus. If you go out of your way to antagonize the folks here, why should we assume you’ll be an effective member of an anarchist community?
We could use more democracy in action in the Peak Oil Barrel forum, right?
BoomerII, I’m not trying to pick any fights.
The whole anarchism kerfuffle is a side show to me. I don’t belong to an anarchist community.
The solutions to peak oil, peak resources, pear civilization, etc. apart from brutish and horrible systemic collapse appear to me to be in the various movements that emphasize no to low growth, local control, cooperative management, reduction in consumption, etc. Lots of that stuff appears in some of the stuff I hear/read about anarchism.
That being said, I am not trying to promote anything including anarchism. Just putting some info out there.
Perhaps you are right, this blog is not the place for it.
I was inspired to post this because of a recent conversation I was involved in on the topic of electrical utility co-ops.
http://www.delaware.coop/about
BoomerII, I’m not trying to pick any fights.
ezrydermike, I wasn’t referring to you. I could have been more specific but didn’t want to be.
Also, I am interested in various co-ops, too.
Here’s another website that looks interesting.
Institute for Local Self-Reliance | Building Community, Strengthening Economies
Defending Agrarian Anarchy
That quoth, while I can understand the concerns and issues of actually ‘making anarchy work’, such as in context with something that clearly does not, it does not change the fact that the current State-based system is fundamentally unethical(/structurally violent/coercive, unvoluntary). IOW, just because ‘we’ have not yet found current ways to behave ethically is not an excuse to continue to behave unethically.
“Corporations Are Not Going to Save Us From Climate Disruption” ~ Rachel Smolker
‘No Horizon‘, by Kemopetrol
good piece of the Navajo Generating Station and water usage in the Southwest US
https://projects.propublica.org/killing-the-colorado/story/navajo-generating-station-colorado-river-drought
In the meantime that we wait for the latest Texas RRC oil and gas data, I want to share this information that I just received from RRC itself about my request for past RRC vintage data:
“Dr. Fantazzini:
We will not be able to fulfill your request. According to our IT Section, this data cannot be extracted. The Production Data Query is so large that it is overwritten each month and previous versions of data are not available after the files are replaced.
Sincerely,…”
Anyway, I want to thank publicly the Texas RRC (after having done it privately by email) for the great patience and attention they devoted to me in the last month with my requests. Thanks.
Best regards, Dean F.
BP has released their 2015 Statistical Review (with annual production and consumption data through 2014):
http://www.bp.com/en/global/corporate/about-bp/energy-economics/statistical-review-of-world-energy.html
Production is for total petroleum liquids; consumption is total liquids consumption.
They showed Saudi consumption increasing from 3.0 MMBPD in 2013 to 3.2 MMBPD in 2014. Using BP consumption numbers and EIA production numbers (EIA consumption data not yet available for 2014), Saudi net exports fell from 9.5 MMBPD in 2005 to 8.4 MMBPD in 2014.
The EIA data are for total petroleum liquids + other liquids (generally biofuels), but for Saudi Arabia, and most other major net exporters, I assume that the “Other liquids” number is negligible. The EIA is showing Saudi production in 2014 (11.6) as basically flat with 2005 (11.5), well within the margin of error, especially given the recent large upward revision in 2005 Saudi production (up by 0.4 MMBPD, or 3.6%).
At the 2005 to 2014 rate of decline in the Saudi ECI Ratio (ratio of production to consumption), they would approach zero net exports some time around the year 2033, 18 years hence.
Incidentally, note that BP downwardly revised their production number for Saudi Arabia for 2005 (down from 11.1 to 10.9) while the EIA upwardly revised their number (up from 11.1 to 11.5). So, the EIA’s number for 2005 is 5.5% higher than BP’s number. Of course, there is that “Other liquids” category included in the EIA data, but I can’t imagine that makes any real difference. In both cases, I think that it’s total petroleum liquids.
China. 11.056 million bpd burned. Bingo.
They aren’t slowing down.
BP shows that Chindia’s combined net imports (CNI) increased from 9.3 MMBPD in 2013 to 9.8 MMBPD in 2014.
Available Net Exports (ANE, or GNE* less CNI, EIA data) fell from 41 MMBPD in 2005 to 34 MMBPD in 2013. It seems likely that the ANE decline continued in 2014.
*Combined net exports from (2005) Top 33 net exporters
The export land model OUGHT to scare the pants off of any body capable of understanding it-and it is not all that complicated.
One thing JJB does not do , to my knowledge, is speculate very much about the likely political decisions that will be made in major exporting countries later on as they start running short of exportable oil.
I am wondering what a countries such as the major OPEC exporters will do as their exportable reserves start coming up short.
A country desperate for cash income will probably keep right on selling. Mexico and Brazil probably fall into this category.
But any country with a substantial national savings account might just decide to severely restrict exports.
Personally I believe that unless the Saudis will substantially cut the export of raw crude before 2025 or so in favor of building ever more refinery and chemical plants that use oil as input.They might quit exporting crude in the altogether well before the ELM model projected date.
Iran or Iraq are wild cards. Even if they have substantial reserves it is questionable whether future governments will want to accommodate foreign countries by exporting freely.
A country such as the Kuwait will probably have sufficient national savings to curb exports if the leaders choose to do so.
If I ever buy a new car – which is unlikely but not out of the question- it will be a plug in hybrid or pure electric. Old farmers tend to keep things until they are worn out.I am convinced that a well maintained car will outlast affordable oil.
When the next big oil surprise hits , it will probably be a severe short supply shock. Anybody who owns a well maintained pure electric or plug in hybrid may well be able to sell it for substantially more than he paid – even after driving it three or four years.
The auto industry is apt to be caught short of production capacity and the relatively few plug in cars on dealer lots will bring sell for substantially more than an ” honest” price. The dealers will find ways to mark them up to whatever the market will bear.
Senior moment , I meant to say Mexico and Venezuela will probably keep exporting as long as they possibly can.
So far, the pattern has been that net oil exporting countries that subsidize petroleum consumption, e.g., Indonesia, continued to subsidize consumption, even as they become net importers, and the countries that heavily tax petroleum consumption, e.g., the UK, continued to tax consumption, even as they became net importers.
The Net Export Math fact of life is that given an ongoing decline in production in a net oil exporting country, unless they cut their consumption at the same rate as, or at a faster rate than, the rate of decline in production, the resulting net export decline rate will exceed the production decline rate, and the net export decline rate will accelerate with time.
This also applies to Chindia’s consumption of GNE (defined above). Given an ongoing decline in GNE, unless the Chindia region cuts their net imports at the same rate as, or at a faster rate than, the rate of decline in GNE, the resulting rate of decline in ANE will exceed the rate of decline in GNE, and the ANE decline rate will accelerate with time.
Saudi Arabia oil production and consumption from various sources (mb/d)
Yes, KSA is headed for a problem as their use and exports intersect. The switch to gas fired electricity has not been enough to compensate for growing internal demand (which is growing steeply). They will have to implement further energy changes quickly to stop the internal demand growth. although, they seem to have plans to slowly shift to other revenue makers with time.
Saudi’s may be trying to prolong the age of oil:
http://www.bloomberg.com/news/articles/2015-04-12/saudi-arabia-s-plan-to-extend-the-age-of-oil
Interesting article on Oil company bankruptcies, and royalty holders.
http://fuelfix.com/blog/2015/05/21/shale-ionaires-suffering-from-wave-of-bankrupt-oil-drillers/#30727101=0
‘Shale-ionaires’ suffering from wave of bankrupt oil drillers
At the height of the U.S. energy boom, Texas landowner John Baen received about $100,000 a month in royalty payments from companies producing oil and natural gas on his property.
Now the checks are much smaller, and when he opens his mailbox each day, he’s afraid he’ll find yet another bankruptcy notice. So far, four of the producers sending him checks have caved in to rising debts as oil prices slumped, seeking court protection from their creditors.
I realize there will not be too much sympathy for someone who was earning over a million per year, for sitting on his front porch, but it is an indication of what is happening on the ground, in the oilfield.
In the worst cases, landowners can be left with no one to take responsibility for abandoned waste, spills and other hazards, say industry experts who have past experience with oil busts.
This is why states like Colorado need to go slow when it comes to fracking. Why bend over backward to accommodate companies which may be disruptive to agriculture, housing developments, and communities and then go bankrupt, leaving a mess behind.
Boomer,
I understand your concern, but there is suppose to be an industry fund to cover the cost of orphan wells. The problem there is, how long will it last if a heap of companies, especially large ones, start to fall over.
The best case is for some of the financially secure companies start to pick up the pieces.
Time will tell.
On the subject of economics, reviewed some hard data from the SCOOP in OK which is really being hyped. Too late to post now, will probably wait till next one of Ron’s posts.
Looking forward to see what you’ve found. I posted the EOG chart above.
Enno. Thanks for the EOG post. Rune has a new post on Fractional Flow with some interesting info. Includes EOG.
Oklahoma has a fund. Takes care of any problem left behind. Funded by the oil companies. Have not seen a complaint in the paper for over 15 years. If you find anything, even 100 year old, they come in and clean it up.
Some interesting information:
NEWFOUNDLAND ‘SOMEWHAT ISOLATED’ FROM PLUNGE IN OIL RIG DEMAND
https://ca.finance.yahoo.com/news/newfoundland-somewhat-isolated-plunge-oil-093235412.html
Watcher:
Analysis required.
WEAPONIZATION OF FINANCE: RUSSIA IS TURNING TO THE CHINESE YUAN
https://ca.finance.yahoo.com/news/weaponization-finance-russias-turning-chinese-122622481.html
Not so much an offensive as defensive weapon.
The primary impediment to Iran selling oil is the transaction can’t clear through banks controlled/regulated by US friendly countries. Trade with India and hmm forgot who else was done via barter to avoid this. Oil for iron ore or something.
So Russia moving to this configuration immunizes them from banks refusing to transact their trade should sanctions become more and more severe.
There are other aspects of the Petrodollar and advantages it is alleged to provide to the US, but this Russian move isn’t pointed at those. Iran and others might sign onto whatever arrangement Russia and China create and perform their transactions that way.
It disarms Washington’s sanction weapon.
CO2 emissions stall thanks to China's passion for renewables – environment – 17 June 2015 – New Scientist
Wow.
I’m amazed that no one has posted any articles on this: http://www.cbc.ca/news/technology/1-3-of-world-s-major-aquifers-are-being-sucked-dry-nasa-data-shows-1.3117609
http://www.huffingtonpost.com/2015/06/17/groundwater-depletion-nasa-study_n_7603292.html
http://patch.com/california/lagunabeach/depletion-world-aquifers-worse-feared-uci-scientists-find
Granted, it’s not a peak oil topic, but as an attribute of overshoot, the environment and water needed for fracking, well, these are things that we do discuss fairly regularly around here.
This is a fairly big deal (a huge deal?) of a story and deserves at least some attention in my view.
But then, the torrent of stories of such a nature is fairly vast, but still, some things are more important than others. This depleting aquifer story is nearer to the top in terms of importance in my view than the bottom. It’s also one of those long term problems. It isn’t urgent today, but when some of these big aquifers that help feed hundreds of millions go dry and there’s a drought (which will happen sooner or later the way things are going), it will be a catastrophe, a catastrophe of possibly biblical proportions. At the very least, millions, (tens of millions?) will be on the move looking for food and water.
Anyways, whatevs. The world continues to turn as usual and life goes on as it does.
It’s certainly an appropriate topic for, drum roll, The Wet One. Seriously, it is a REALLY big deal.
Yeah, tell me about it! I’m heading to Sao Paulo next month for a 5 month stay, reservoirs that supply that city of 18 million plus are very low. I think a lot of things are happening in the world today that will make the next decade or so rather interesting to say the least. Interesting in a Chinese curse sort of way…
Hey one thing about PV, once you have the panels, they no longer require the input of either fossil fuels or water for good quarter of a century or so, they just sit there producing electricity without any inputs or maintenance… just sayin!
Fred, have a great summer/winter in Sao Paulo.
When you sing the easy praises of 25 year solar panels with implied zero maintenance expenses, I see dust, pollen, and bird poop to clean off regularly. And having just rebuilt my sturdy shed roof for the third time in twenty years because of wind blown tree parts, I’m still having a hard time believing in zero maintenance with no fossil fuel inputs.
And that ignores hurricanes. Our Florida weather includes a lot more than sunshine. That is what keeps me from going solar, and I would very much like to. I just don’t think the panels would last very long, and maintenance and repairs without FF is a delusion. My shed roof required FF to repair, and solar panels will, too. That does not deter me, but the near certainty of regular, costly repairs is tough to ignore, regardless of FF.
Jim
How far do those tree parts blow? Around here they just fall over and crush buildings and cars, don’t blow too far from the tree, pretty dense wood.
Jim,
And that ignores hurricanes. Our Florida weather includes a lot more than sunshine. That is what keeps me from going solar, and I would very much like to. I just don’t think the panels would last very long, and maintenance and repairs without FF is a delusion.
I live in South Florida about 2 miles from the beach and I worked with civil engineers on permitting of rooftop solar arrays in numerous Florida counties and municipalities. There are numerous wind zones in Florida depending on your distance from the sea shore. In the zone closest to the coast the specs require that panels withstand sustained 150 mph winds. As for all the other stuff you mentioned I have never heard of anyone having to clean dust or bird poop off their panels in South Florida.
I think continuing to rely on fossil fuels and the continuation of BAU are even more of a delusion… YMMV!
Cheers!
well for better or worse, here is Pope Francis’s…
ENCYCLICAL LETTER
LAUDATO SI’
OF THE HOLY FATHER
FRANCIS
ON CARE FOR OUR COMMON HOME
I don’t know what if any difference this will make. As expect, population / reproduction issues seem to be left out.
Chapters 2 and 6 are a bit to “religious” for me, but he does cover quite a bit of ground in Chapter’s 1,3,4 & 5.
Let the gnashing of the teeth begin.
http://w2.vatican.va/content/francesco/en/encyclicals/documents/papa-francesco_20150524_enciclica-laudato-si.html
No, he specifically addresses population control, though given that a large part of his encyclical is about ecological devastation due to over consumption, he does come across in this paragraph as somewhat cognitively dissonant.
50. Instead of resolving the problems of the poor and thinking of how the world can be different, some can only propose a reduction in the birth rate. At times, developing countries face forms of international pressure which make economic assistance contingent on certain policies of “reproductive health”. Yet “while it is true that an unequal distribution of the population and of available resources creates obstacles to development and a sustainable use of the environment, it must nonetheless be recognized that demographic growth is fully compatible with an integral and shared development”.[28] To blame population growth instead of extreme and selective consumerism on the part of some, is one way of refusing to face the issues. It is an attempt to legitimize the present model of distribution, where a minority believes that it has the right to consume in a way which can never be universalized, since the planet could not even contain the waste products of such consumption.
Though given the fact that he is the Pope, and the overall tone of warning about ecological issues throughout most of this encyclical, I’m almost willing to cut him a bit of slack… I think he is fully aware that we have a population problem but there is no way in hell, no pun intended, that he can put it in those exact terms.!
We shall see how the faithful interpret this and let us also keep in mind, that the Pope, even today, is a powerful political leader on the global stage and he has pretty much said that BAU can’t continue.
We have a saying down in Brazil…
“para o bom entendedor, meia palavra basta”
Portuguese
Etymology
para (“for”) + o (“the”) bom (“good”) + entendedor (“understander”) + meia (“half”) + palavra (“word”) + basta (“suffices”).
Literally, “For a good understander, a half word is enough.”
Proverb
para o bom entendedor, meia palavra basta
It is not always necessary to elaborate a context excessively to understand it.</I
My two cents for what it is worth, the Pope gets that we have a population problem!
good catch. Looks like he is trying to say it without saying it.
Thanks Fred.
Fred is dead on. The Pope is not free to do as he pleases. The best he can hope for is to move the Church in the direction he wants to go by influencing the thinking of the younger people in it and trying to get them appointed to higher positions if they are on board with his ideas.
Politics matters as much in church as it does in congress.Progress on such issues as birth control has to wait to some substantial extent for older hard core toe the line guys in high positions to die off or at least move to the assisted living facility.
Morally speaking the Pope is right imo. We shouldn’t expect people to give up such a fundamental right as the right to procreate just because it is in our interest to do so … Mother Nature is incapable of giving a damn about human overshoot. Overshoot is a daily fact of life in the biological world, with lots of species in overshoot at any given moment. They die back. The population recovers. Nothing new here except we are at the head of the line in terms of the size and distribution of our population.
Over shoot is by it’s very definition a temporary state of affairs.
The Catholic Church is slower to adapt than most but it has proven to be a very durable organization. The priests who run it are not stupid. Otherwise it would not be very old, very big, and very very rich.
My guess is that birth control will be rendered acceptable and compatible with church doctrine within the next ten to twenty years. It will be interesting to see how this is accomplished. Lots of past doctrine and dogma is going to have to be twisted into pretzels to pull it off.
Mac,
The fight is over. Catholics use birth control as much as anyone else. Italy has a fertility rate of about 1.3, two thirds of replacement.
The countries who still have fertility problems are mostly Islamic.
While that may be true, it is still a loooong stretch to expect the Pope to come out openly in favor of family planning and birth control, other than the old rhythm method, that is >;-)
For sure.
In fact, given that the fight is over, why should he fight it?
Really, why should anyone focus on it? The only reason some women are having too many children is that they’re oppressed. We should relieve them of that oppression in any case – it will have many benefits besides population reduction.
Population growth will end, and then go into reverse, but the effects will be very slow. It makes far more sense to focus on per capita resource destruction/pollution. That’s where we can achieve fast, large change.
Pennsylvania (unconventional) naturalgas data out:
Jan15 12.58 bcf/d
Feb15 12.66
Mar15 12.75 (rev up +0.23),
Apr15 12.51
#Marcellus #Utica
EIA data on oil industry cost reduction, based on Bureau of Labor Statistics producer price indexes
http://www.eia.gov/todayinenergy/detail.cfm?id=21712
From June 2014 to May 2015, when the oil and gas prices as measured by the PPI fell by 49%, the PPI by industry classification showed the following changes:
• Rates for drilling activities, which primarily represent service fees for contractors to drill oil and gas wells, declined by 19.6%.
• Rates for support activities, which include the surveying, cementing, casing, and otherwise treating wells, declined by 1.4%.
• The price of sands primarily used for hydraulic fracturing declined 12.5%.
For the first quarter of 2015, ending March 31, a group of 14 drilling companies represented in the OSX index (an index of oil and gas service companies) experienced a first-quarter year-over-year decline of 91% in net income, decreasing from an aggregate net income of $4.0 billion to $352 million. In the same period, a larger group of 57 North American independent oil and gas producers experienced a collective year-over-year decline in net income from $2.9 billion in net income to a loss of $13.9 billion.
Source: U.S. Energy Information Administration, based on company income statements, extracted from Evaluate Energy and Bloomberg
Note: The sample of North American independents excluded major integrated oil and gas companies with multiple business segments (e.g., refining) and companies with worldwide operations.
http://www.eia.gov/todayinenergy/detail.cfm?id=21712
paradox of the life. either oil producers make money or the economy. can’t both. 🙂
The oil still flows again today, and as we all know, the roads are packed with cars. It’d be Father’s Day weekend, so there is no stopping the cars from going to and fro at 85 mph. Gotta have those 80 million barrels gone by tomorrow and filler’ up again.
The nut with the wolverine hair wants to be preznit. That’s about the best news I’ve heard come forth in the political world since Richard Nixon began his failure to lead and to his resignation.
Eight billion dollars in the bank and Mr. Trump is going to straighten the world from its crookedness when he becomes the leader of the free world, he’ll rock like Neil Young when Neil was with Buffalo Springfield.
On and on The Donald sang his praises of what kind of job he will do, given the chance to have the job, the very worst job on the planet awarded to one naive giant ego and he’ll do one of the worst jobs possible.
If he is elected, I’m sure he’ll don a military uniform, land Air Force One in Syria, and bring the entire matter to a close with a peaceful ending.
The Triumph of Trump will the be victory call.
Just a bunch of bullshit, nothing else, hubris and all that jolly horseshit.
He talks a good game, but I doubt he can walk the walk.
I don’t think he would give a beggar in Mumbai a dime.
Those rock-ribbed, dyed-in-the-wool stupid Republicans can eat crow, the dumbasses.
Can’t trust the Democrats either. They’re even dumber.
The two most clueless groups of humans ever to exist on the good earth, it is a cryin’ shame.
Sorry for the digression, back to peak oil and more observations.
Beer time!
Would he be better for entertainment value than Sarah P? 🙂 Was that 1 prez cycle or 2 cycles ago? Who did they have last prez cycle? Ahh that pizza delivery guy with 999 plan 🙂 He had couple of good lines 🙂
60 Minutes in 1992: Hillary – I am not some little Tammy Wynette stand by your man woman!
6 year later: Bill – I did not have sexual relations with that woman!
Shortly thereafter: – Hillary – It is a vast right wing conspiracy.
Right. No shortage of dumbass democrats.
PS: Do not start laughing yet. George Wallace won a number of primaries, including a majority of the Michigan Union vote. Donald is George with money.
The only thing that scares me worse than the thought of Hillary in the White House is the thought of the whichever republican idiot who wins being there if she gets the nomination and loses the election.
But given that I vote the environment these days I suppose I will hold my nose and vote for her if she wins the nomination. I have no doubt she would be better on environmental issues than any of the likely repugnant front runners.
My hope is that enough democrats are just flat out tired of Clintons that somebody else will get the nomination. It has always been my opinion that Obumbler is prez not because the country wanted him but rather because LOTS of democrats wanted anybody BUT Hillary.
Most of my democratic acquaintances do not really like her – but being democrats they have to say they do and act as if they do in public. Romney had the same problem which imo was more than enough to cost him the election. Repugnicans were compelled to say they liked him but nobody I knew ever really looked at him as anything other than a compromise candidate who inspired no enthusiasm or personal loyalty. NO CHARISMA.
Bill had it in spades. Reagan had it. Ike had it and Kennedy had it.
If the repugnicans nominate somebody with charisma and run a decent campaign Hillary imo has almost no chance at all of winning. Charismatic she AIN’T.
Taken all the way around , considering the state of the country and the world when he took office, the Obumbler has done considerably better than I expected – he has had a ” tough row to hoe” as my old folks used to express such things so I did not expect much regardless of who won.
Things are not going downhill nearly as fast as I used to think they would.
Still no Texas data today. I will have a new post tomorrow, Texas data or no Texas data.
I’m going to go ahead and post some SCOOP (Woodford) information.
Continental Resources drilled a horizontal Woodford well, Whaley #1-20H, to TD of 18,675′ and it was completed in December, 2012. It appears the lateral is about 2,500′, the top of the Woodford in the drilling unit is just below 16,000′.
Whaley #1-20H IP 161 barrels of 60 gravity oil and 6,673 mcf of gas. Most recent month’s average daily production was 6.1 bopd and 534 mcfpd. Cumulative through 2/15 is 26,965 barrels of oil, 1,964,181 gas.
Total cost to drill and complete Whaley #1-20H appears to be $13,891,695.
Continental then proceeded to drill and complete 10 more wells in a density drilling program in the same Section as Whaley #1-20H. Laterals on these wells range from 4,552′ to 10,110′ with TD ranging from just shy of 20,000′ to maximum of 25,941 feet.
These ten wells were completed in early 2015 with oil IP ranging from 244-390.8 bopd and gas IP ranging from 11,047-15,309 mcfpd. The wells are new, no production histories reported. Oil gravity in 60 degree range.
Total cost to drill and complete these 10 wells appears to be $125,025,255.
5 of the 10 wells in the density program are reported to be among the top 12 IP BOE wells in the SCOOP per Hart’s Energy, 6/3/15.
Further reading indicates this is in the deeper part of the Woodford, which is more gassy, and that in areas where the Woodford is 10,000′ range, oil makes up close to half of BOE, but IP BOE is not as high.
I guess at 60 gravity, and more gas than oil, I question how much oil impact SCOOP will have. Also, appears wells have very high decline and are very expensive.
I would characterize it as a condensate rich gas reservoir.
Jeffrey. That is correct. Found a Wood Mac article which states only 22% of production in SCOOP is crude AND condensate.
They estimate SCOOP production will hit 1 million BOE by 2020, with C+C percentage increasing to 26%. So not the next Bakken or EFS with regard to C+C.
Funny how Wood Mac also uses BOE to characterize SCOOP.
Shallow, thanks for your good work. I must have missed something, however, as I did not know that the Woodford shale had a potential “impact” on anything or anybody other than mineral owners in Oklahoma. Correct me if I am wrong, please, but CLR has pretty much proven themselves a bunch of lying sumbitches about the Bakken; why not SCOOP, or whatever code name they call it also? Did something happen where CLR all of a sudden come by some kind of credibility? Don’t tell me they paid all their debt off while I have been out in the field the past few days, OMG!!
Mike
LOL, Mike! I had just read all this stuff about how they were moving away from the Bakken to the SCOOP due to better economics. I’m not seeing it. I guess they can say about anything, and its not fact checked by any business media. They also report all their SCOOP IP in BOE terms, which is odd considering these are clearly gas wells.
Again, they plan on spending $2.7 billion in CAPEX this year on stuff like this in 2015, during weak oil and gas prices. This amount, of course, being 35% of the amount of the budget for the State of OK in 2015.
Kind of funny. This info is on an auction. Your comment about small interest owners, etc., applies here.
Company selling leased an undivided interest in a 40 acre tract from the mineral owner in 2012. That 40 is a part of Continental’s two section unit. 3/16 RI, don’t know what they paid up front. Have .00750000 WI in two wells, .00487500 WI in the other 9. Not sure how that happened.
Anyway, they must have consented, billed almost $800K for those very small WI by CLR. Scanned all the documents, didn’t see anything to the contrary.
I would say $12-13 million per well is probably about right, given TD is an extra 5,000+ feet compared to Bakken.
As usual, if I’m missing something here, call me out on it. I just do not see how creditors would be happy about $138 million gross being spent in one 2 section drilling unit at present oil and gas prices.
To be fair, they get a decent price for gas, and it looks like the last month I reported was a partial month, well shut in as other ten were completed.
Looks like were averaging about 12 bopd 60 gravity and 1600 mcfd gas. So if can realize $3.50-$4.00 for gas would need to produce about 5 million mcf to break even. That doesn’t include interest on debt though. If borrowed 75% of funds for his development, $5 million of interest expense per year, approximately, if we don’t plan on paying principal till 2020.
Shallow, you are not missing a thing. You’ve made a good case for how poor the economics are in the Woodford, goodonya. 5 BCF wells are hard to come by, anywhere, but in this shale?
Nah.
May I ask your opinion, please: how do you run any business, be it LTO extraction, pizza making or porta potty pooper scooping, by paying millions of dollars in interest every day on your loans just to kick the principle can down the road as long as you can? Do the 10K’s indicate a big savings account somewhere to deal with the day of reckoning? What kind of miracle is going to happen in 2018 or 2020 that will allow these guys to pay all that money back? 200 dollar oil?
Nah.
http://finance.yahoo.com/news/small-u-frackers-face-extinction-amid-drilling-drought-050703684.html
The small- and medium-sized firms that make up at least half of the nearly $100 billion a year U.S. oil services industry that provides fracking sand and specialized chemicals for fracking have been hit far harder than their large, cash-rich rivals by the downturn, experts say.
While giants like Halliburton , Baker Hughes and Schlumberger are weathering the slump by cutting tens of thousands of jobs, firms like GoFrac are going under or heading that way, starved of cash and unable to raise emergency investment.
The Shale Industry Could Be Swallowed By Its Own Debt
http://www.bloomberg.com/news/articles/2015-06-18/next-threat-to-u-s-shale-rising-interest-payments
The debt that fueled the U.S. shale boom now threatens to be its undoing.
Drillers are devoting more revenue than ever to interest payments. In one example, Continental Resources Inc., the company credited with making North Dakota’s Bakken Shale one of the biggest oil-producing regions in the world, spent almost as much as Exxon Mobil Corp., a company 20 times its size.
Interest payments are eating up more than 10 percent of revenue for 27 of the 62 drillers in the Bloomberg Intelligence North America Independent Exploration and Production Index, up from a dozen a year ago. Drillers’ debt ballooned to $235 billion at the end of the first quarter, a 16 percent increase in the past year, even as revenue shrank.
“The question is, how long do they have that they can get away with this,” said Thomas Watters, an oil and gas credit analyst at Standard & Poor’s in New York. The companies with the lowest credit ratings “are in survival mode,” he said.
The problem for shale drillers is that they’ve consistently spent money faster than they’ve made it, even when oil was $100 a barrel. The companies in the Bloomberg index spent $4.15 for every dollar earned selling oil and gas in the first quarter, up from $2.25 a year earlier, while pushing U.S. oil production to the highest in more than 30 years.
“There’s a liquidity issue, and you start looking at the cash burn,” Watters said.
S&P assigns speculative, or junk, ratings to 45 out of the 62 companies in the Bloomberg index.
Almost $20 billion in bonds issued by the 62 companies are trading at distressed levels, with yields more than 10 percentage points above U.S. Treasuries, as investors demand much higher rates to compensate for the risk that obligations won’t be repaid, data compiled by Bloomberg show.
“Credit markets have played a big role in keeping the entire sector alive,” said Amrita Sen, chief oil analyst at Energy Aspects Ltd., a consulting firm in London.
So far this year, S&P lowered the outlook or downgraded the credit of almost half of the 105 U.S. exploration and production companies that it rates, according to a May report.
Companies have reduced spending to cope with lower prices, but those cuts will eventually lead to production declines, further shrinking revenue, Watters said.
U.S. oil production will begin to fall this month and will continue to slide until early 2016 as shale drillers reduce spending, the Energy Information Administration said in a June 9 report.
Interest expense can drain a company’s finances. At this time last year, Quicksilver Resources Inc. was spending more than 20 percent of its revenue on interest. The company missed a debt payment in February and has since filed for bankruptcy. Sabine Oil & Gas LLC missed an interest payment in April and another this month.
Oil and gas companies accounted for one-third of the 36 corporate-debt defaults worldwide this year, and missed interest payments are the leading cause of default, according to a May 14 S&P report. Companies including SandRidge Energy Inc., Breitburn Energy Partners LP and Halcon Resources Corp. have raised cash by taking on new debt or issuing new shares.
The new debt issued by Halcon and SandRidge is secured by oil and gas assets, making it less likely that unsecured bondholders will get repaid in a default. Both companies’ older, unsecured bonds are trading at distressed levels. Halcon’s are going for 72 cents on the dollar or less and SandRidge’s for 62 cents or less, according to data compiled by Bloomberg.
The new borrowing can be expensive. Oklahoma City-based SandRidge issued $1.25 billion of second-lien debt this month at 8.75 percent interest, more than all but one of their existing bonds, records show. The company paid $24 million in fees and will add $109 million a year to interest payments, which are already eating up 29 percent of its revenue.
“It provides us with liquidity we otherwise wouldn’t have had,” said Justin Lewellen, a SandRidge spokesman. “It bought us some significant time.”
The Texas data is finally out. I will have a new post in a few hours.