The EIA came out with its final update of Annual Energy Outlook 2015. It seems that the EIA is extremely optimistic concerning future US crude oil production.
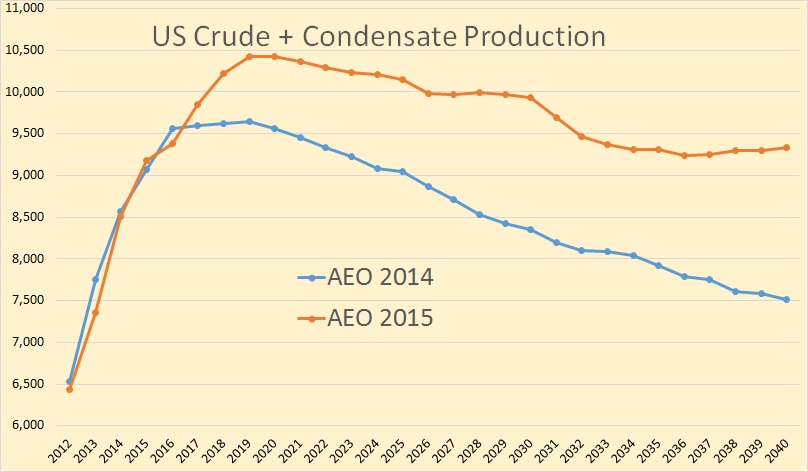
Here is a comparison with AEO 2014. The EIA still expects US crude production to peak in 2019 but at 10,472,000 bpd or 824,000 barrels per day higher than the expected last year. But the biggest difference is in the EIA’s change in decline expectations. They now expect the US to be producing 9,329,000 bpd in 2040 or 1,812 higher than they had 2040 production last year. This is the EIA’s reference, or most likely case.
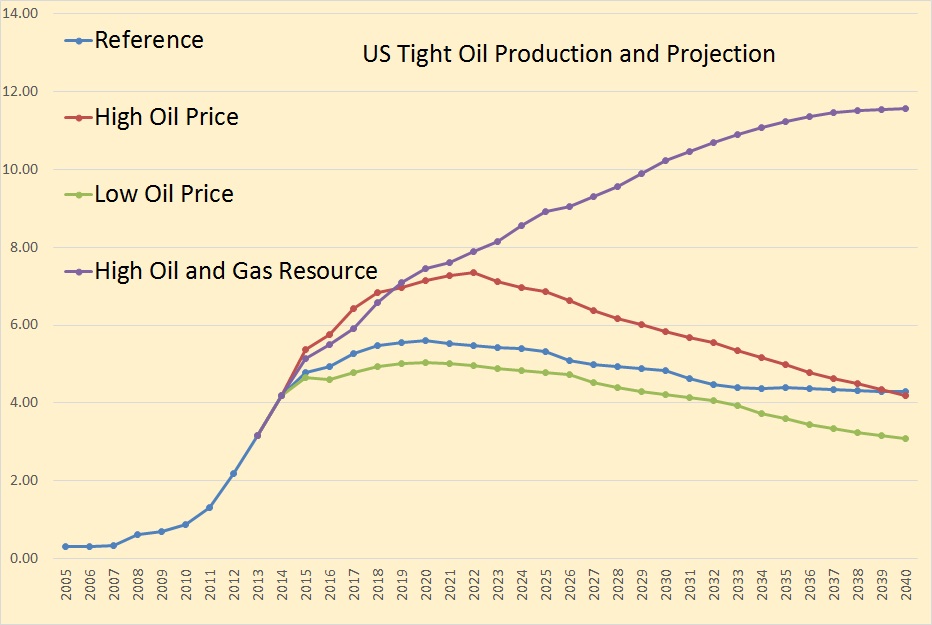
Production from tight formations leads the growth in U.S. crude oil production across all AEO2015 cases. The path of projected crude oil production varies significantly across the cases, with total U.S. crude oil production reaching high points of 10.6 million barrels per day (bbl/d) in the Reference case (in 2020), 13.0 million bbl/d in the High Oil Price case (in 2026), 16.6 million bbl/d in the High Oil and Gas Resource case (in 2039), and 10.0 million bbl/d in the Low Oil Price case (in 2020).
What the EIA is saying in the above paragraph is that price and tight oil production is everything when it comes to US future oil production. On that point I would agree except that even if the price returns to $100 and higher, it will not produce tight oil production to anywhere near the EIA’s high price projections.
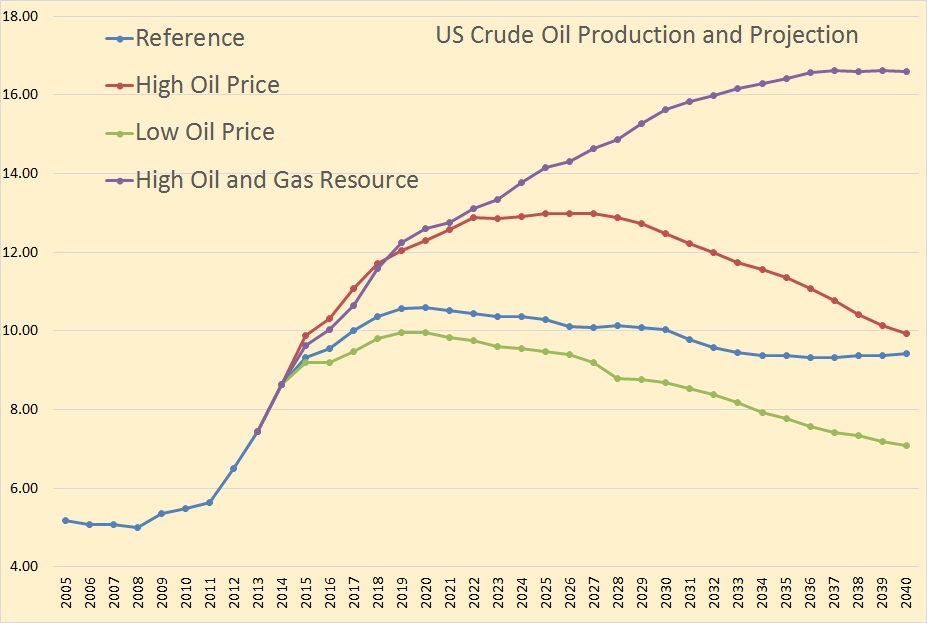
In both the High Oil and Gas Resource and High Oil Price cases, total U.S. crude oil production is higher than in the Reference case mainly as a result of growth in tight oil production, which rises at a substantially faster rate in the near term in both cases than in the Reference case. In the High Oil and Gas Resource case, tight oil production grows in response to assumed higher estimated ultimate recovery (EUR) and technology improvements, closer well spacing, and development of new tight oil formations or additional layers within known tight oil formations. Total crude oil production reaches 16.6 million bbl/d in 2037 in the High Oil and Gas Resource case. In the High Oil Price case, higher oil prices improve the economics of production from new wells in tight formations as well as from other domestic production sources, leading to a more rapid increase in production volumes than in the Reference case. Tight oil production increases through 2022, when it totals 7.4 million bbl/d. After 2022, tight oil production declines, as drilling moves into less productive areas. Total U.S. crude oil production reaches 13.0 million bbl/d by 2025 in the High Oil Price case before declining to 9.9 million bbl/d in 2040.
To such optimistic projections I have nothing to add.
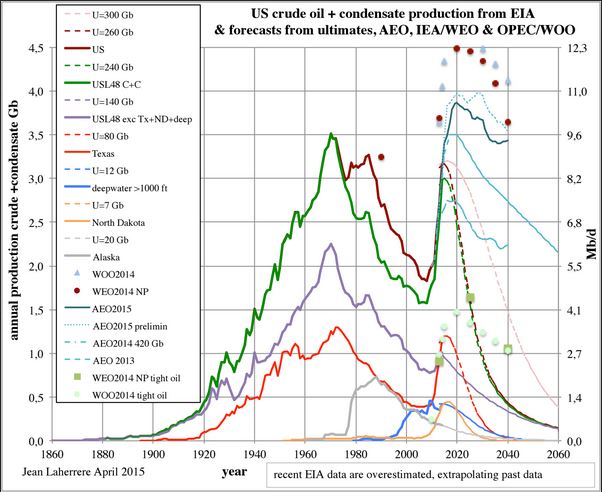
Jean Laherrere posted me the above chart a couple of days ago of US production history and future production forecast from various sources.
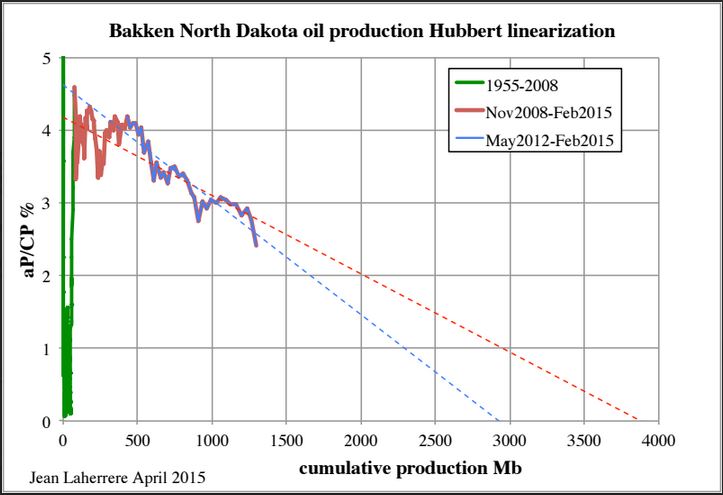
LTO reserves estimate by USGS based on geological oil in place and recovery factor is not reliable. I am a geologist. I rely only on the production and its growth linearization
it is bad but better than anything else for the moment. ND Bakken LTO production growth linearization leads towards 4 or 3 Gb depending the period up to February 2015.

But other modeling can be done depending the feeling about the 1000 wells waiting to be fracked. My guess is the these two models give a good range of the future Bakken production. But as an explorer I am used to be wrong.

Production in the Bakken’s most productive county, McKenzie, has fallen 45,784 bpd since December and is currently about 1,000 bpd below September production level.
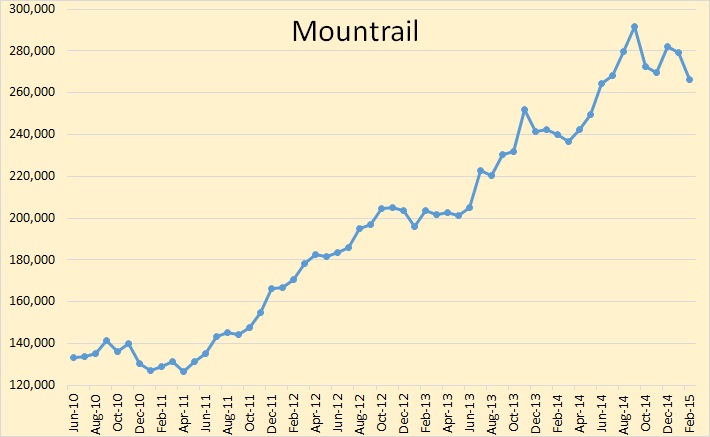
Mountrail peaked in September and has since dropped over 25,000 bpd from that peak and is currently almost 2,000 bpd below its July production level. It appears that Mountrail had reached its peak, or nearly so, before the price collapse began. WTI prices averaged $93.21 in September and $84.40 in October when Mountrail had its biggest hit in production.

I find it interesting that the recent decline in North Dakota production has been confined to the two counties that contain all the sweet spots. Since peaking in December North Dakota production has been down 50,435 barrels per day. But the combined McKenzie and Mountrail production is down 61,655 bpd while the rest of North Dakota was up 11,220 pbd over that period. Since September 2014, total North Dakota production is down 9,261 bpd. Over that same period McKenzie and Mountrail is down 26,084 bpd while the rest of North Dakota is up 16,823 bpd.
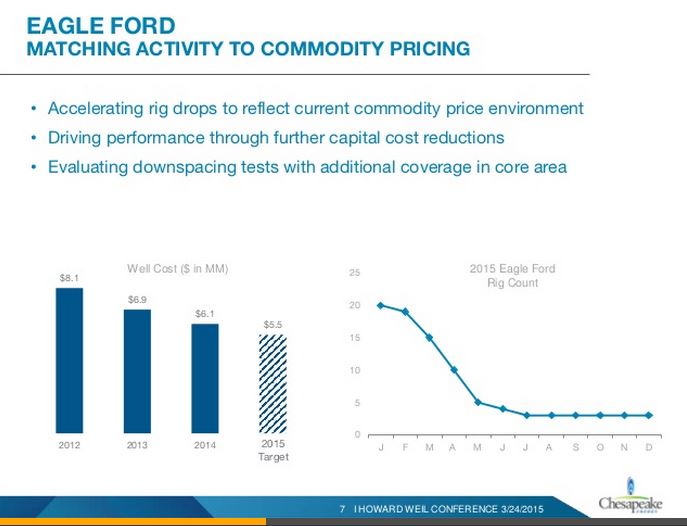
Chesapeake’s rather interesting business plan will reduce Eagle Ford rigs from 20 in January to 3 in July then hold that level the rest of the year. The above chart and a lot of other Chesapeake stuff can be found at Chesapeake’s Howard Weil Conference Presentation
Request: People, please stop posting about non energy related subjects. It is not the purpose of this blog to post trivia about your favorite band, poem, or whatever. This stuff just becomes unnecessary rhetoric and trivia that people have to wade through to get to the real peak oil and other energy related stuff that people visit this site to find.
_______________________________________________________
Note: If you would like to receive an email notice when I publish a new post, then email me at DarwinianOne@gmail.com
I’ve been reading back through some old EIA reports over the last few days, and one of the things I notice about their predictions is just how strongly the last 4 or 5 years of performance seem to influence where their predictions go. They were over optimistic early in the 2000s seemed to get more pessimistic in the mid-late 2000s, and have been vastly more optimistic in the last couple of years as US growth has taken off again. So basically this seems to cause them to miss most of the turning points, which are the most important events.
In support of your point:
At the 2009 to 2012 (three year) rate of increase in Louisiana’s shale gas production (0.4 TCF/year to 2.1 TCF/year, EIA), by the year 2020, Louisiana’s shale gas production would have been up to about 170 TCF per year.
Current global dry natural gas consumption is probably on the order of about 120 TCF/year, so at the 2009 to 2012 rate of increase in Louisiana’s shale gas production, by the year 2020 Louisiana’s shale gas production would have met total global gas demand, plus about 50 TCF/year. Of course, the purpose of this exercise is to point out the problem with extrapolating short term rapid increases in US crude + condensate (mostly condensate) production.
The primary contributor to the observed (20%/year) decline* in Louisiana’s total marketed gas production from 2012 to 2014 was the decline in drilling in the Haynesville Shale Gas Play, but in any case, it’s when, not if, that the contributions from new wells can no longer offset the declines from existing wells. In other words, Peaks Happen.
*This was the net decline rate. The gross decline rate from existing wells from 2012 to 2013 and from 2013 to 2014 (excluding contributions from new wells) would be even higher than 20%/year.
Louisiana gas data:
http://www.eia.gov/dnav/ng/ng_prod_sum_dcu_sla_a.htm
Jeff,
Have you looked at the Barnett shale lately? I remember both you and Rockman, watching it closely when it was first coming on line, and indicated that you would closely watch it as to where the production profiles lead and how long the “30 year” wells would last for.
So are the wells holding up? And what percentage are still producing after 7 or 8 years?
I have not done any recent detailed work, but here is what the Texas RRC currently shows for Barnett Shale gas production (million cubic feet per day). Based on current data, the 2012 to 2014 net decline rate was 8%/year (the net decline rate was after contributions from new wells).
At the 2004 to 2012 rate of increase in production (21%/year), the play would have been up to 8.7 BCF/day in 2014, versus the current reported production rate of 4.9 BCF/day for 2014 (and versus the peak of 5.7 BCF/day in 2012).
At the 2004 to 2012 rate of increase, they would have up to 31 BCF/day in the year 2020.
Link to full size image:
http://www.rrc.state.tx.us/media/22204/barnettshale_totalnaturalgas_day.pdf
Thanks Jeff,
As Barnett is the oldest and mature shale region, I thought it maybe a good lead indicator as to how individual wells hold up. I believe it was Chesapeake that was the main force in the area, and made many famous quotes, especially about the wells around the airport.
It appears by the Chesapeake presentation mentioned in the lead, that Chesapeake has moved out of the Barnett area. So things must have not worked out too good for them.
The rig count for gas has dropped to 3 recently. So any decline rate should be very visible.
A copy of one of my previous comments, Re: AEO 2015:
*Again, the stipulation here is a “Steady state” production scenario at a high production level, which is more or less what the EIA is projecting, so we are always declining from a high production level, on a year to year basis, at whatever production decline rate one uses. At what I think is a reasonable estimate for the decline rate from existing production year to year (20%/year), in round numbers over the next 25 years we would need to put on line the productive equivalent of Saudi Arabia’s current production–times five–in order to maintain about 10 mbpd for 25 years.
I project that existing Bakken wells will produce another 1.5-2GB over their life times, so Jean Laherrere’s projection of U=3 to 4 is likely quite on the low side. I am open for a bet that U>=5 GB.
Hi Enno,
I would take your side of that bet, but I imagine there are many who would take the other side. It will be quite a while before we get to 5 Gb of output from the Bakken/Three Forks, probably 2023 at the earliest.
David Hughes’ “realistic” estimate for the Bakken is 6.8 Gb in Drilling Deeper.
As much as I hate to agree with the projected declines in production for Mountrail County, I am afraid it is happening sooner and faster than I thought possible. There are more wells and the production is not increasing. Must be something that can’t be stopped. Maybe it will change in the future, but it looks like production declines will be the norm. A short term plateau, then a steady decline, but not too steep, maybe. That’s it.
OK, I’ll stay with the topic, but the cornbread recipe is a great find. No more videos.
Edit:
https://www.dmr.nd.gov/oilgas/stats/Mountrail.pdf
In other news, the OPEC monthly report is out, and OPEC production is apprently up 800,000 bpd in March. They’re really gunning for it.
I am trying to come up with an explanation for production to be off in the sweet spot counties and yet still holding up in the rest of ND.
Not a clue but then I only know what I read here and in the news and a couple of other blogs.
??????
It won’t be the end of civilization in this country over the next couple of decades if we get half or two thirds of the production the AEO predicts but it sure as hell will mean extremely tough times considering imported oil is going to be extremely scarce and prohibitively expensive.
But there are ways to get by on a national basis.
I could list a couple of dozen easily.
Even in times of war countries manage to get together large amounts of capital to tackle critical jobs -ESPECIALLY in times of war I should say.
When the oil shit hits the fan there are a WHOLE lot of things that WILL get done to allow us to use whatever amounts of oil we have more efficiently.
There will be boom times for energy efficiency related businesses while just about everybody in new home and office and shopping center etc type construction is on food stamps.
Take note , any young guys hanging out here.
OFM,
One explanation could be the companies in the sweet spots may have the money to delay completions. The companies out of the sweet spot, may have no choice?
Hi Mac,
The explanation is that most of the wells have been drilled in Mountrail and McKenzie counties and the decline rate of the wells is very fast so a lot of wells have to be drilled and completed to offset the legacy decline. To make matters worse, the average well productivity in these counties may be declining as the sweet spots run out of room for more wells or as wells become too closely spaced.
The other counties may not have reached this saturation point yet so although the have the first “Red Queen” problem (as described so well by Rune Likvern in the past), the second problem of decreasing new well estimated ultimate recovery(EUR) may be less pronounced.
I will see if I can show this using Enno Peter’s data set.
Makes sense to me. In other words, they may have increased the drilling density to the point where they are seeing well interference, and the per well performance is dropping off.
They weren’t that dense yet.
I’ll offer up older wells outside sweet. The older they are, the slower their decline.
Watcher,
I for one am eagerly awaiting for you to post your documentation here on POB.
McKenzie 3 month cumul. w/ polynomial trend line
mountrail.
Both charts possible due to Enno Peters great work. Thank you Enno!
A chart with all McKenzie and Mountrail wells. 3 month cumulative output with polynomial (6th degree) trendline from Jan 2008 to Dec 2014. Output has flattened for two counties combined, but has not decreased.
Bottom line, through Dec 2014 there was little evidence of a decrease in new well EUR in overall Mountrail and McKenzie data, but Mountrail looks like it may be close to (or maybe past ) running out of room in the sweet spots. The decrease in output in Jan and Feb may be due to fewer wells being drilled or an artifact of the way county data is tabulated (they may leave out confidential wells in the county data).
The biggest hurdle, Mac, will be a politician actually admitting to decline. ‘Exceptionalism’, and ‘Saudi America’ has been preached about so often to say otherwise will be 180 deg turn. What’re thay going say, “we lied”, or “we made a mistake”?
I suppose they could blame it on the oil companies and media?
regards
They’ll blame it on Obama.
http://www.zerohedge.com/news/2015-04-16/conspiracy-theorists-bloggers-compared-isis-during-congressional-hearing
“As linguist Noam Chomsky said, “The idea that there should be a network reaching people, which does not repeat the US propaganda system, is intolerable” to the US establishment.”
Those looks when I mention ” you likely have just 3 years to drive Normally ” to the person that just spent 18 months of salery on a new ride.
“We have a supply of natural gas that can last America nearly 100 years,” declared President Barack Obama in his State of the Union speech last month. ”
http://reason.com/archives/2012/02/14/100-years-of-natural-gas
OK. YOU GOT IT . Sehr Gut
Chomsky
https://www.youtube.com/watch?v=A6Jbnq5V_1s
I can remember back when I thought Chomsky was an idiot and then after that , a clown.
At some point I gradually changed my mind and now I think of him as a genius although I still do not agree with him on some major points.
He tells us that we elected Reagan on morning in America and Obama on hope and change and that Obama’s staff made sure we didn’t ever find out what he actually stands or stood for until after the election.
If the democrats don’t come up with an upstart candidate who can win the nomination ….. Well, we are all VERY well acquainted with the front runner.
I will not go so far as to say she scares me as badly as some of the front running repuglithans but …………
Hi Ron,
Great Post. A fundamental problem with Hubbert Linearization is that the data before the peak often does not give reliable results and will tend to point to a URR much lower than the eventual URR. To illustrate this point I have taken a relatively conservative scenario based on the USGS mean estimate for Bakken TRR and an average well profile based on NDIC data provided by Enno Peters. This is not original thinking on my part, it was initially used by Rune Likvern in his Red Queen series at the Oil Drum and Fractional Flow (Mr. Likvern’s blog).
I added the idea that the average well profile will eventually decrease as the sweet spots run out. I cannot predict precisely when this will occur, I just guess. I also do not know how fast the estimated ultimate recovery (EUR) of the average well will decrease, this rate also must be guessed at and I use the USGS TRR estimate as a guide. In the model below I assume the average new well EUR will start to decrease in June 2016 and that the maximum rate of decrease is 6% reached 12 months later with a gradual increase in the rate of decrease over that 12 months.
The scenario assumes the number of new wells added each month decreases to 100 new wells per month and remains at this level until Oct 2031 (about 30,000 total wells), ERR is about 8.9 Gb by Dec 2039, peak output is Dec 2015, but output remains on a plateau of about 1100 kb/d until 2021.
If we do a Hubbert Linearization using annual output data (Jean Laherrere uses monthly output data in his chart from April 2015) and use the model from the scenario described above for 2015 to 2029 we find that a hyperbolic type of functional form results for the data plus model from 2012 to 2029.
The problem with the Hubbert Linearization(HL) method is that we try to fit a line to a curve, if we do this too early the URR points to a value much too low. For 2012 to 2020 we see a URR of 4.5Gb, but for 2021 to 2029 the HL points to about 9 Gb.
The scenario I have devised may well be incorrect, the point is that the HL Plot is likely to have this curved shape and HL gives us very unreliable information at this point. The USGS methodology might be unreliable, but the question one might ask is whether it is more unreliable than the HL method.
The EIA reports that proved reserves in North Dakota have increased by about 5 Gb from 2007 to 2013 and I would guess that 99% of these reserves are from the Bakken/Three Forks. There was also about 0.9 Gb of cumulative C+C output from The Bakken/Three Forks by Dec 2013, for a total of proved reserves plus output of 5.9 Gb.
Euan Mearns has used a rough estimate in the past of about 25% higher 2P reserves than 1P reserves (1Gb of 1P reserves would suggest 1.25 Gb of 2P reserves). Using this method would suggest 5 Gb of proved reserves might mean that 2P reserves were about 6.25 Gb. Adding cumulative output we get over 7 Gb of 2P reserves plus cumulative output, reserve growth over the next 15 years would be likely to get us to 9 Gb, if there was no reserve growth then we would still expect at least 7 Gb of eventual output.
The AEO in 2014 estimated about 45 Gb from 1953 to 2040), my estimate is about 27 Gb at most, so I am in agreement with Ron that the new EIA forecasts (which are much higher than 2014) are optimistic in the extreme.
For the Hubbert Linearization Chart the vertical axis is % annual output of C+C/cumulative output of C+C and the horizontal axis is cumulative output of C+C in millions of barrels. The URR is where the trend line crosses the horizontal axis. (4500 Mb or 9000 Mb)
Dennis, I am a little shocked that you would use the USGS reserves estimate for anything. Surely you would have figured out by now that they are about as reliable as the Farmers’s Almanac is for predicting the weather.
That being said I think you are overestimating Bakken reserves. If the price crash had not happened I believe the Bakken would have peaked late 2015 or early 2016. But now I think they likely peaked in December 2014. The decline curve will now be drug out a bit longer but I see about 3.5 Gb as ultimate production. Of course that is based on the expectation that WTI will eventually rise to $80 or $90 a barrel. But if the price stays low then ultimate production will likely stay somewhere below 2.5 Gb. Just how far below that point I will not speculate at the moment.
By USGS reckoning, only 50% of the world’s oil has been discovered, with about 25% yet to come from so-called reserve growth and new discovery. But, the USGS is completely out of touch with most experts and industry insiders. To give one example, Dr Salameh of the World Bank insists that roughly 90% of the world’s conventional oil has been found (Dr Salameh is a consultant on Oil and Energy Affairs for the World Bank).
Hi Doug,
Do you believe that generally proved reserves in the United States are overstated?
There was about 900 Mb of cumulative Bakken/Three Forks production at the end of 2013. The EIA reports about 4800 Mb of Bakken proved reserves at the end of 2013, so this gives us 5700 Mb of proved reserves plus cumulative output.
For reference, 1600 Mb of reserves were added in 2013. Does it seem like such a stretch to imagine another 1100 Mb of reserves being added over the next 10 to 20 years?
If we set aside extra heavy oil from Canadian and Venezuelan oil sands, the USGS expects about 1150 Gb of reserve growth plus new discovery, over the next 30 years or so.
Jean Laherrere has estimated about 850 Gb of 2P reserves for the World in 2010. To get an idea of possible reserve growth we can look at the US from 1985 to 2010.
In 1985 US proved reserves were 28.4 Gb, we will estimate 2P reserves at 25% higher or 35.5 Gb. Proved reserves in 2010 were 23.3 Gb and 2P reserves we will estimate at 29.1 Gb. If we assume there were no discoveries (I don’t have that data and that is unlikely to be correct) and no reserve growth (also unlikely) then cumulative production from 1986 to 2010 would have been about 6.4 Gb if the 2P estimates are correct.
Actual US C+C cumulative production was 58 Gb from 1986 to 2010, so there were 51.6 Gb of discoveries plus reserve growth in that 25 year period or a 145% increase in reserves (51.6/35.5) through reserve growth and discoveries. The USGS assumes there will be about 135% reserve growth plus discovery over the 2010 to 2040 period, which is 850*1.35=1150 Gb.
I believe the USGS estimate is too high and that a Hubbert linearization estimate (which at 2500 Gb, implies 550 Gb of reserve growth plus discovery) is too low. My estimate of discoveries plus reserve growth is 850 Gb from 2010 to 2100, URR for C+C less extra heavy is 2800 Gb.
On the “conventional” oil we have to be careful with definitions, many authors define conventional oil very narrowly. If we exclude deepwater oil, polar oil, lto, and extra heavy oil, and maybe even heavy oil, then it is possible that 90% of oil has been discovered, so there may be very few new finds. Does he also claim there will be no reserve growth, if so does that sound plausible?
“Do you believe that generally proved reserves in the United States are overstated?” I only believe reserve numbers when they are provided as a function of price. “On the “conventional” oil we have to be careful with definitions, many authors define conventional oil very narrowly.” I am well aware of reserve definitions (all Russian, Chinese and Western variations thereof) having participated in numerous calculations for both internal uses and to satisfy different regulatory authorities. It’s true that we in the West have inherited a rather strange (archaic?) system that requires continually moving probable to proven, etc. but that’s another matter. However, it’s very rare indeed that an author has license to invent (define) his own classification system.
Will the reserves estimate fall with price? Or is it only one way.
Of course it falls with price. Reserve = recoverable under existing economic and political conditions, with existing technology. Dennis always seems to confuse reserve with “oil in place”.
Hi Doug,
See the following for where I get proved reserves.
http://www.eia.gov/dnav/pet/pet_crd_pres_dcu_SND_a.htm
At link below proved reserves are defined, this is my understanding of proved reserves.
http://www.eia.gov/dnav/pet/TblDefs/pet_crd_pres_tbldef2.asp
Also there is the following see table 2:
http://www.eia.gov/naturalgas/crudeoilreserves/
So I ask again, do you think that the estimates of proved reserves by the EIA are incorrect? These are based on price, it is essentially a summary of reported proved reserves from the 10k reports of companies that produce oil in the US.
There are many different definitions of “conventional” oil by Colin Campbell and others, I am unfamiliar with the work of the professor you cited, if you think that everyone uses this term in the same way, you may be incorrect.
I am not talking about the definition of proved (1P), proved plus probable(2P) reserves, those are fairly standard since the end of the Soviet Union.
What do you consider the distinction to be between conventional and non-conventional oil? Jean Laherrere uses one definition, Colin Campbell uses another, and there may be others, but the term conventional is not standardized in the same way that proved reserves have a standard definition.
Hi Doug,
On confusing reserves with oil in place, that is far from the mark. I use technically recoverable resources and then estimate what will be economically recoverable based on a price scenario. Did you notice the oil prices on my chart? Perhaps you missed that. If real oil prices are above the prices shown on the chart and the average well profile changes in the way that I have assumed (where EUR starts to decrease in June 2016 and the annual rate of decrease increases by 0.5% per month for 12 months and stabilizes at 6%) the ERR will be about 9 Gb.
Of course then you will say nobody can predict future oil prices and I would agree.
The scenario is a what if exercise, the oil prices in the scenario are quite conservative, only a doomer or cornucopian would think they would be lower.
Not ignoring you Dennis, we’re on our way to Cargèse (Corsica) to attend a High Energy Physics conference and my wife always hogs our only i-Pad. The gall? Apparently we have a new rule: Window seat = sorry, no i.Pad.
Ciao Doug Leighton ,
Sei proprio un ingannatore. E sembrerebbe che si è in esso ancora una volta.
Perché ha mentito di andare a una conferenza di fisica delle alte energie a La Thuile? Non hai ingannare nessuno. Ho letto tutto sul vostro piccolo inganno viaggio nel blog di colui che non deve essere nominato. Hai mentito per evitare di commentare sul modello Etp . Hai rotto la promessa solenne. Tu sei not un uomo di parola. Penso che tutto il sito peakoilbarrel è una truffa.
Ottieni il tuo proprio I- pad per il bene di christ!
—Tu Siete Ovvio
As a courtesy to the other Bloggers, perhaps it would be better to write your comments in English. Besides, my Italian is sub-minimal, at best, thought the gist of your remarks was certainly obvious (to me anyway).
Sorry, Doug, my English no so good. Thank you. I try.
So, what do you think of the Etp model?
“Do you believe that generally proved reserves in the United States are overstated?”
Dennis, it doesn’t matter. For most of the remaining oil in place, like LTO, to extract in the fight against decline rates, you need sustained high oilprices which is a problem for the world economy and the financial system. So, while big names like Laherrere, Campbell, Simmons and Aleklett seem to be on the pessimistic side on theoretical URR, what counts is the URR in connection to oilprices that the world can live with. Probably we will see a few more cycles with low and high oilprices, but depletion goes on, and low oilprices mask the urgency that is needed to transition away from oil.
Hi Han,
I agree that higher oil prices will be needed and that oil will deplete. A Hubbert linearization for World C+C less extra heavy oil suggests 2500 Gb for the URR, this method tends to underestimate eventual URR because we fit a line to a hyperbolic functional form. The USGS estimates 3100 Gb for World C+C less extra heavy, my estimate is simply the average of these two, 2800 Gb, it will likely be somewhere between 2650 Gb and 2950 Gb, it will depend on how the world economy reacts to higher oil prices when decline becomes noticeable in 2020, and how quickly a transition to other forms of energy occurs.
I don’t know how this will go, I tend to think it will be towards the low end of this range, but have consistently tended to underestimate potential oil output in the past, whether eventual C+C less extra heavy URR is 2650Gb or 2950 Gb (or between these) will have little effect, 2800 Gb is close enough.
Extra heavy oil URR will be 500 Gb to 700 Gb, I use 600 Gb. The extra heavy oil does not help very much as it takes a long time to develop the resource.
Dennis – a lot of the yet to be found oil seems likely to be Arctic or deep water, or in areas currently under development moratoria. Might the development cycles for these be slower than conventional oil and maybe closer to heavy oil – so skewing the curve towards a thicker tail and faster early decline?
AY
Hi ay,
Much of the future reserves may come from reserve growth. How quickly polar and deep water discoveries are developed will depend on prices and technology.
Your basic point may be correct, there are others who would know better than me.
Past estimates of reserves may have been too low and if so may be corrected in the future but reserves do not grow.
I just saw an article this morning about the Texas Railroad Commission, they have absolutely nothing to do with railroads. It was called the most misnamed commie in existence. Ditto for the term “reserve growth”. It has nothing to do with reserve growth because reserves do not grow.
Hi Ron
the change in estimates of reserves is usually called reserve growth.
you are absolutely correct that the amount of actual reserves is not changed.
We can call it whatever you like. The estimated amount of reserves increases over time, that is a simple fact.
The estimated amount of reserves increases over time, that is a simple fact.
Are you joking? That is not a fact at all. Reserve growth is largely an outgrowth of SEC regulations:
RESERVE GROWTH FOR DUMMIES
The US SEC (Securities and Exchange Commission) insist on using P10, and the oil companies prefer to use the lower estimates since it means that they can always report increasing reserves to their shareholders. The result is that we get a false impression of how much oil there is in the world and how bleak the future actually looks.
Reserve growth is largely an American phenomenon or a phenomenon of oil companies traded on the New York Stock Exchange. Also virtually all of the old giant fields have already undergone all the reserve growth they will ever see.
Damn Dennis, I thought you already knew all this shit.
.
Hi Ron,
Euan Mearns has suggested p10 reserves will be smaller than p50 reserves by about 80%. If that estimate is correct we simply divide p10 reserves by .8 to estimate p50 reserves. If you think that’s too low we could use .5, it doesn’t matter there will still be reserve growth.
To argue there is no reserve growth or increases in estimates of reserves is pretty far fetched.
Dennis, again P10 and P50 are something that SEC regulated companies use.
Also, reserve growth is largely something that has already happened.. It is not something that is forever in the future. Do you really think they will just keep growing and growing and growing and….?
.
Hi ron,
No I don’t think increases in estimated 2P reserves (aka reserve growth) will continue forever. I expect about 500 to 600 gb of reserve growth for world c+c.
I assume you don’t think reserve growth has stopped, that would be a hard position to argue. A lot of reserve growth has already occurred, on that we agree. My expectation is that reserve growth will gradually decrease over time, I can’t imagine that it has stopped altogether, I imagine you wouldn’t think so either. Probably you believe they will be much less than I think. If C+C less extra heavy URR is 2500 Gb and discoveries are about 250 Gb as Jean Laherrere estimates (after 2010), then reserve growth would be about 300 Gb. I believe that Jean Laherrere expects no reserve growth, but if one adjusts US proved reserves to estimate 2P reserves and looks at increases in 2P reserves plus cumulative production, this is clearly not the case.
One could also look at UK and Norwegian reserves, but I have not done that.
Dennis, Jean Laherrere simply understands that most so-called reserve growth was figured into reserves estimates many years ago. I think his estimates are very accurate, far better than those of people who don’t realize that simple fact.
And of course, national oil companies have no reason to give conservative estimates of reserves. In fact most of them way overestimate their reserves. It’s a national pride thing.
The overestimation of reserves from national oil companies will way more than offset the underestimation of publically traded companies.
What you should be concerned with Dennis, is reserve shrinkage.
Hi ron,
I use Jean laherrere’s estimate for world 2P reserves in 2010. He accounts for reserve inflation by NOCs. Time will answer these questions.
Do you think Jean Laherrere’s 850 Gb estimate for world C+C 2P reserves at the end of 2010 is too high?
Hi Ron,
For the US there were only 6 Gb of new field discoveries and 57.5 Gb of reserve growth from 1981 to 2010 if we estimate 2P reserves by multiplying 1P reserves by 1.25.
If as you believe, all future reserve growth is accounted for in 2P estimates, then reserve growth would be zero.
In the case of the US we would need to multiply 1P reserves by 5.6 for reserve growth to be zero from 1981 to 2010.
This seems pretty implausible, but if true, US 2P reserves in 2010 would be 130 Gb.
In order to explain away reserve growth you need to make pretty fantastic assumptions. The more sensible position is that as oil companies get better data, 2P estimates tend to rise as more knowledge is gained and as technology improves.
“…, it will depend on how the world economy reacts to higher oil prices when decline becomes noticeable in 2020, …”
Dennis, I think (much) higher oilprices could be seen next year already, because a lot of new projects (in development) are cancelled or postponed now. Capex is down much.
…, and how quickly a transition to other forms of energy occurs. ”
With low oilprices like we have now, transition is very slow. With high oilprices and the world economy in recession or worse, transition is difficult and probably also slow.
IIRC, the transition from horse to tractor was accelerated by the Great Depression, not slowed down. Investment increased.
Bad times increase the pressure to invest in order to reduce costs.
And this case is similar: EVs and hybrids are cheaper to own and operate, so hard times would accelerate the transition.
I personally don’t think the Depression had anything substantial to do with the transition away from horses to tractors.
This transition imo occurred because the cost advantages were so substantial that once it was well underway a farmer HAD to make the transition to survive economically.
The folks who simply couldn’t get the money together to buy tractors mostly either went out of business or found other ways to make ends meet such as by working off the farm, selling timber that would otherwise have been left on the stump, lowering their living standard , etc.
It takes substantially less time to learn to operate and maintain a tractor than it does to learn to manage and care for horses, and the labor productivity even with thirties vintage tractors was probably five or ten to one.
Beyond that you only feed tractors on days you use them. This is an advantage so overwhelming it makes me just about have a laughing fit when I visit sustainability sites and read about the advantages of horse farming.
And beyond that – when you do need either the horse or the tractor -the tractor can go as many hours, as many days in a row, as the operator. Driving a tractor is a piece of cake physically compared to working a horse when plowing or cultivating.
Horses cannot be worked long and hard more than two days in a row. After that you have to back off substantially no matter how late you are getting your plowing and planting done, or hauling in your crops.
Sometimes a new technology simply OVERWHELMS what it replaces.
We will never go back to horses so long as industrial civilization lasts. Biodiesel or ethanol sufficient unto the needs of farmers can be produced using less land and labor by a mile than needed to farm with horses.
This is not to say that some societies might not decide to subsidize farming based on the use of draft animals. It can work but food would be substantially more expensive.
I am not disputing Nick’s argument so much as simply saying the transition would have occurred just about as fast or faster had times been better. Credit to buy tractors would have been more readily available.
People today have a way of romanticizing preindustrial farming , seeming to envision it as a fun thing, hard maybe , like hiking a mountain trail, but ENJOYABLE.
Anybody who has ever stared at a mules ass for more than a day or two knows the fun wears out after about the first two hours. PERMANENTLY.Been there and done that.
GARDENING can be fun if you don’t HAVE to do it and you spend your days in a chair in an office. It is no fun whatsoever if you MUST do it.
Life in MIDDLE EARTH is a beautiful dream. I would go there in a flash but not expecting it to be easy.
Hi Han
You assume oil prices will be too low or too high, that is possible, but not a given.
I agree with Mac that given the world economy we live in today, and peoples expectations for a certain life style and standard of living farming with horses or mules is uneconomical. A tractor will always be faster. (cut to tv commercial, bigger is better, faster is always better, etc). I feel this says more about the world economy and how we choose to live in it than it does about horses or mules or their ability to contribute to a more sustainable farm.
if you would like information about drilling oil wells this is a great site as there are folks here “drilling oil wells”. To get good information about farming with draft animals talk with folks living in communities where it is practiced and accepted.
Hi Ron,
The USGS estimate may be too high. I think David Hughes analysis is excellent, he forecasts 6.8 Gb from the Bakken, your estimate will be far from the mark.
If no more new wells are added to the Bakken, total output will be about 3.5 Gb.
If 100 new wells per month are added until 2024 (19,000 total wells) and average new well EUR starts to decrease in June 2015 and reaches a 10% rate of decrease by June 2016, output will be 6.5 Gb. That scenario is quite consistent with David Hughes estimate.
Could you explain the basis of your estimate and why you think David Hughes may be too optimistic?
Thanks Mr. Laherrere. It feels good to be in good company. 🙂
@Dennis: like said above: it’s a matter of price. 100 wells per month for the next 15 years represents an aweful lot of money. And it turns out to be a money losing business even at higher prices.
Hi Verwimp,
Your model does look very similar to a Hubbert model with seasonal variation, generally the Hubbert models estimate too low a URR especially when annual output divided by cumulative output is more than 0.1. As you have said before time will tell. I agree that oil price will make a difference, if it stays at $50/b long term, perhaps your model and that of Jean Laherrere will be correct.
As Enno pointed out, the wells that have already been drilled will produce 3.7 Gb, and they can do that at $50/b. If the oil price falls to $10/b (2015$) and remains at that level long term, then maybe we would see a URR of 2.5 Gb from the Bakken/Three Forks of North Dakota. I think such a scenario is highly unlikely.
Hi,
In my opinion, the only reason why there is unconventional oil production is because oil is valued much higher than other energy sources. A good convential oil well can recover tens of millions barrels of oil. A shale oil well can recover hundreds of thousands barrels of oil. That gives an EROEI of 1:1 if the convential oil has an EROEI of 100:1 if everything else is equal. Of course everything else is not equal, but it gives us an idea of the EROEI. I would say that most of the unconventional oil production probably has an EROEI of bellow one. That could be a reason why GDP growth is slowing down. Unconventional oil production is feeding on the energy that should have been used for GDP growth. If all energy would have had equal value, then most of the current unconventional oil production would not have been economical. An increase in price would have increased revenues, but costs would have increased equally much. In such scenario I think oil would have peaked back in 2005.
So I believe that what happens to oil production depends a lot on how much production from other energy sources can increase to support an increase in unconventional oil production. It depends especially on gas and coal production. If energy output from those energy sources start to decline, then there will be no support for expensive oil. Oil prices will probably not be much higher than they are now and most of the unconventional oil will stay in the ground.
I should add that conventional oil production of course also contribute with energy to society. So if that starts to fall then there will also be less energy left for unconventional oil production. It will manifest itself as economic depressions with lower demand for oil.
I’m not aware of many oil wells recovering tens of millions of barrels of oil. In my career I worked in one field with one well which recovered 50+ million, and that well was really exceptional. I only saw a few wells in the Western Hemisphere push over 10 million barrels. And I think most engineers never see a single well recover over 10 million barrels.
On the other hand I worked in plenty of fields where 1 mmbo was considered pretty good. And one where the average was 200,000 BO and we made a ton of money working that acreage.
The key is always cost versus reserves + prices and the curve shape. I think most of these tight zone wells can squeak by but the industry will have to get smarter. I think they got a bit to learn.
Ok but those fields probably had an EROEI much lower than 100:1. I looked at some giant and super gigant fields. The thing is, if a project can not make a profit even when the oil price is much higher than other energy sources, then EROEI is probably bellow one.
Freddy,
Do you have any links to a balance sheet where some one has done the EROEI on a shale well? I have done a few searches, but didn’t find anything. Direct diesel usage for 20-30 days drilling, a few days of 12 x 3512 cats working on the fraccing. Truck movements at 6mpg but most trips are relatively short. Rail haulage/pipeline, steel content etc.
These Bakken shale oil wells wells have a URR of 200-700,000 bbls of oil. When you say unconventional oil has a EROEI of less than one, are you saying it takes 200-700,000 bbls to drill and produce oil from each well in the Bakken?
Toolpush,
I have looked around on the web and found figures like 5:1 for shale oil and 3:1 for tar sands. However I have not seen any actual calculations. If you find any, please share them. I would love to see them. The thing is that it is extremely difficult, if not impossible, to do a completely accurate calculation. There is so much you need to include and consider. You can easily miss out on something. For the figures above I think it´s well head energy. In that case an engines efficiency using the oil is probably not included. It´s about 1/3 so there goes 2/3 of the energy already there. Also for example I think it was Chris Martenson who mentioned that the tax revenues does not cover the damage to roads the big trucks cause. The energy for fixing that is probably not included. What about the energy needed for creating the tools that creates the tools that creates the rigs? But that energy is not only used for the rigs but other things too. So it´s almost impossible to calculate.
I don´t say that you need to recover a certain amount of oil. It depends on the costs. As Fernando told us, 200.000 barrels can be economical. The only thing I did was to observe that they have difficulties making a profit even if the output energy is priced higher than the input energy (which is not only from oil). I saw figures that only about 20-25% of the revenues goes to wages in oil companies and if they don´t make money then taxes are low too. So much of the costs are essential and does not go to unnecessary things. If EROEI is above one and all energy is priced equal (input and output), then you will make a profit if the price is high enough (unnecessary spending reduced to a minimum). If it´s bellow one then you will never make a profit no matter what the price is. Costs will always be higher. So you can make your own assessment on this.
Thanks Fredy,
It seems funny how so many people keep quoting EROEI, yet the the justification for the numbers seem rather hard to come by. I will continue to look as well to find any justification for the quot numbers.
As for the energy that goes into building the rig, it must be remembered that each rig will drill possibly more than 150 wells in its life, and with shale wells having a much higher success rate than conventional well, the energy inputs of the rig need to be spread across all these wells.
My early years in the oilfield were mainly spent in exploration. Many times I thought to myself, we burnt more fuel than we found. Then we drilled the discovery wells for Exxon in Angola and found several billion barrels of oil in one go.
Due to the low exploration risk, and relatively small capex of the shale wells, it is hard to imagine each well consuming 20% of the URR of these shale wells?
In direct usage, drilling, fraccing and transport, I can see maybe 10.000 barrels. That leaves one hell of a lot of energy used in steel for the multi use capitol equipment involved?
I will continue to look for any justification for the quoted EROEI. I would appreciate if anybody had any links or information to let me know.
Freddy,
http://www.westernresourceadvocates.org/land/pdf/oseroireport.pdf
Here is a link and maybe, where you may have got your EROEI = 1 for shale oil. But unfortunately it is for Oil Shale aka kerogen ?
Warning-
Grade school level comment for newbies; hopefully there are some lurking in this forum.
So long as the prices of coal and gas are low or very low compared to the prices of oil or ethanol on the BASIS of the ENERGY content, the EROEI (energy returned on energy invested ) simply doesn’t matter to a BUSINESSMAN in the oil or ethanol businesses.
If an operator can make MONEY he could care less about the net gain or loss of energy involved.
Allow me to make a simple example.
If I had an ethanol burning tractor -I don’t- then I would be perfectly willing to burn wood gathered on the place to make ethanol if I couldn’t buy tractor fuel.
I don’t know enough about the efficiency of simple stills to calculate the EROEI but my guess is that the wood I would burn to manufacture fifty gallons of hundred and ninety proof would contain at least ten to twenty five times as much energy of combustion as the fifty gallon drum of moonshine.
So the wood could be used ten to twenty five times as efficiently as the moonshine to heat my house by simply burning it directly- rather than burning the moonshine in a stove or furnace.
But a cord of wood that is otherwise almost worthless ( to me at least, given that I have oodles of unsalable wood) will suffice to distill at least five gallons of very high proof ethanol and probably twenty gallons of hundred proof easily.
I can sell ONE gallon of artisanal brandy for more than a cord of firewood. The EREOI is irrelevant to the business case.
And that drum of one ninety would run a forty horsepower tractor for a good while – a couple of days at least. If no other liquid fuel were available I would gladly pay twenty bucks a gallon for one ninety and convert a tractor to run on it. EROEI be damned. The drum of moonshine fuel would be many times as valuable as the wood used in distilling it.
This example ignores labor of course but so long as the end product is VALUABLE ENOUGH paying for labor is not a problem. It also ignores the corn or whatever is fermented to be distilled. If the inputs are cheap enough the business is viable.
EROEI starts to matter when the money costs of energy used as inputs starts approaching the money sales price of energy being produced as the output.
This is probably going to be a big problem in the future but for the time being it does not matter much if at all in some industries.
Thank you toolpush. No I meant shale oil. I don´t know who came up with the idea to name two different things with the same words but in different order. My EROEI comes from my observations described above and also a bit from the 5:1 and 3:1 numbers knowing that they may not tell the whole truth.
I will have a look at your link. Maybe there is some interesting information about non oil shale EROEI also.
But oil prices aren’t higher than those of other energy sources, with the exception of gas, coal, and marginal shares taken up by biofuels and possibly electricity.
I meant mainly coal and gas. I have not really checked any others. Oil, gas and coal takes up something like 85% of the energy we use. So those are the most important ones. Electricity comes from coal and gas as well as other sources.
I have been thinking and I think I was wrong about the “Unconventional oil production is feeding on the energy that should have been used for GDP growth.” part. If you for example decide that we should stop making movies and spend the energy to extract oil with EROEI bellow one instead, GDP should actually increase. Making movies does not generate energy output, but oil extraction does. That extra energy can be used to make movies, but fewer movies than before. So people will feel poorer because they have fewer movies to watch, but GDP will actually increase. If GDP growth is slowing down it must be because total energy output growth is slowing down for some reason.
From Ron’s article: “I find it interesting that the recent decline in North Dakota production has been confined to the two counties that contain all the sweet spots. Since peaking in December North Dakota production has been down 50,435 barrels per day. But the combined McKenzie and Mountrail production is down 61,655 bpd while the rest of North Dakota was up 11,220 pbd over that period.”
As an accountant, this is exactly what I expected. So much production (and therefore, revenue) is front-end loaded in these shale plays, why would anyone be in a hurry to produce from the sweetest spots with the price at or near a bottom?
When I look at individual well cumulative production on the ND website, it appears that EOG wells in Parshall field have much higher cumulative production than almost all other Bakken and Three Forks wells. Many have produced over 600,000 barrels of oil. In the director’s cut video, Lynn Helms stated that EOG is drilling wells but not completing them in the Parshall field, apparently waiting on increasing prices. Could this be a partial explanation? I wonder what the production profile looks like for Bakken/Three Forks if Parshall field wells are removed. I will bet it makes a noticeable difference. It has been my opinion after scanning the cumulative information that certain fields, like Parshall, Sanish and a few others, were the only truly profitable Bakken/Three Forks areas during 2010-2014.
Dennis: What happens to EUR if EOG Parshall field wells are removed? How much difference is there between EUR with EOG Parshall and without it?
This smells like guys wanting to fire fewer guys so assigning a bit of drilling work. The proppant guys are out of sight, out of mind. Nowhere near. Don’t care if they are fired, and the pump guys are from big companies and maybe get carried.
If we get another leg of dollar strength to take price down $10, that will start to break hope and we’ll see some more action.
Hi Shallow sands,
I removed all Parshall Field wells (the majority about 75% are owned by EOG) and show 2008 to 2015 (Feb) average well, average well excluding parshall field, and the average parshall well.
Only about 400 of 9000 wells are in the Parshall pool
Thanks Dennis! So overall not a big difference.
Clueless,
I am no accountant, but to answer your question,
why would anyone be in a hurry to produce from the sweetest spots with the price at or near a bottom?
Because these are the only spots they can afford to drill and gain any cash flow?
I’m no accountant either or oil expert but it’s seems to me that the sweetest spots are probably the most heavily drilled spots there for they have the most total wells. Legacy decline rate might explain it. Especially if rig counts and well completions are falling in those areas.
Cash flow starts with cash out and then cash in. They drill a $9.5 million well at a reduced cost of $7.5 million due to service companies price cuts. So, they are negative $7.5 million. Production starts the payback process. I think that we agree that with WTI in the $40’s they are lucky to get a net of $25/bbl in the Bakken. First year production of 180,000 (500/day) equals $4.5 million. Second year production of 110,000 equals $2.8 million. Total cash flow is still negative even without any interest expense. You can do a NPV calculation of a $4 million frac job at $25 cash flow ($45 WTI) and compare it to one that waits a year WITH AN ASSUMPTION that WTI will be $60 at that point. Huge difference in rate of return.
And, I do not think that drilling will recover anywhere near as fast as the price increases. That is because I think [just my guess, opinion, whatever] that with all of the weaker companies, the banks will want them to sell forward [hedge] the production before they put more money in for a frac job or a new well. And, as Ron knows, that is easier said than done because of margin calls. Say that they sell the oil forward at $70/bbl before the well is started. And at the time when it is completed, the price of oil has spiked to $100. They have a margin call of $30/bbl until they can deliver production against their short. Well, they will not have that cash, and the bank will not want to commit either. Why?? What if something goes wrong with the well and the production is not there? Nothing in life/business is easy. There is no free lunch – i.e., easy way out of a problem. Chesapeake was a big hedger, but they had to have liens on virtually all of their properties to cover the liability of margin calls [which the lien holders would put up]. I believe that most of the weaker drillers in the Bakken are already all liened up.
Clueless. Don’t forget to include OPEX, which runs from $6-12 per barrel in shale plays, or G & A, which seems to be higher the smaller the company.
Also, keep in mind the OPEX per barrel will increase substantially company wide as less wells are completed. Per barrel LOE is much less on a new flowing well than a 2+ year old well on artificial lift making less than 100 bbl of oil per day.
Whether the extraction tax in ND, as pointed out by Brian Rose, goes away, will also be a big deal.
It’s only $4/barrel. 6% of $55.
Too much tax hype.
To me, everyone seems too optimistic on future output. Barring some technical achievement which hasn’t been developed yet, we will have a long period before we can get back to close to what it was last year. As most of your readers know, the EIA has been over stating Texas output to the tune of over 400k barrels a day since December. Texas production has been relatively flat most of the year. EIA has been going up in their projections, never adjusting to actual. Texas production has been seriously declining since January. Perusing the completions for the Eagle Ford in Gonzales and Karnes counties, there is not much there, and what is there is mainly very low IP rates for the area. They are just now starting to report completions on permits since January. The permits in the Eagle Ford have been halved since the first of the year. There is a large number of completions with the designation for that lease being #1. In other words, they are trying to hold leases. I am not a very good macroeconomic person, I tend to look at areas and wells individually to get a good idea of the whole. Texas has good enough data online to get to where you need to be for an estimate.
Using the rig count per Baker Hughes, there were a lot of rigs, but in the shale play it appeared to be a little over a 1000 at the high point. Most have lost all that they are going to lose, except the Permian. We will see how close that guess is to todays report. The permits are down to about a half since January. What is happening in the Eagle Ford is also happening in the Permian and the Bakken. They are connected players operating in all. We know that all of these permits will not be completed. How far below one-half are we know? Less macroeconomic are the royalty owners. On the 10,000 acre area I am on, a lease which would have expired has been given new life by the landowners, who don’t want to drill yet. Where else is that happening? How do you factor in stuff like that in mathematical projections? Actually, you don’t have to be a mathematical genius to determine that all drop in production estimates are under stated. Some of the drop is absolute and can be done with spreadsheets using ranges of drops. One half of the wells will not be completed. In most shale plays, most of the first years production is accomplished in the first six months. Don’t use the sweet spot production curves, because wells are not being completed in those areas while the price is low. April completions are way down, and by May they will be at the point where they are only completing what they permitted since the first of the year.
Anyone who is seriously considering anything that the EIA has to say, needs to get a life and do their own research. Nothing matches reality. As that is the majority source for most of the press, you can put them in the same boat. It doesn’t have any oars, nor would anyone be able to use them if it did have oars.
On the 10,000 acre area I am on, a lease which would have expired has been given new life by the landowners, who don’t want to drill yet. Where else is that happening? How do you factor in stuff like that in mathematical projections?
Nice call. The imperative to drill on an expiring lease isn’t there if the mineral rights owner can be pitched the delay theory.
Besides which, the mineral owner now knows the oil is there. Why shouldn’t he let the lease expire and just charge a higher price to someone else who wants that lease when or if prices recover. What’s his advantage letting that company off the hook?
Easy answer. He wants someone to drill. That is, he started counting his chickens before the eggs had hatched. Mentally spent the money. So, it is easier working with the current mineral rights holder.
I can sign onto mental momentum, but the mineral rights owner almost certainly attends little mtgs of other owners locally and maybe hits owner websites/blogs, which do exist.
I think my point is there is no loyalty. Period. The owner may listen to other owners and refuse to delay lease termination because he knows he’ll get just as good a commitment from someone else, and no one is going to frack without price rise regardless. I remain confident financing is more of an impediment to fracking at these prices than company choice.
So overall there should be zero reason to delay termination if there’s no oil flowing. It costs the guy nothing but convenience of a new negotiation — and hell, he’s going to have a delay document put in front of him anyway to stress over. Might as well just wait for another offer.
Most companies will spend their time trying to keep the leases they have, not trying to poach other leases. Its kind of like marriage. Your free to leave any day and try for a better offer. Most do not.
The lease agreement was signed in a high price environment, and if the owners go back to the starting line they will have to deal with the Grizzlies who survived the carnage who won’t have mullets willing to finance anything? Some landowners got really nice royalty cuts they won’t get in the next few years, I guess.
The oil producers want to sell their oil. They’re going to drill for it, pump it out of the ground and have a supply that’s for sale. That’s how they make their money. If there is no demand, the supply is worthless. No bidness, give up, go home, find something new to do.
Demand is there, somebody wants the oil. I’ll bet a round of beers that farmers are using diesel at this very moment. They gotta get that stuff done, you know. Right now, it’s jet fuel and diesel that are selling like hotcakes at 5 am at the truck stop.
Week 14 BNSF carload report has petroleum at 10,753 cars. The carloads wax and wane, however, there is no precipitous drop in volume.
Week 14
So, in January of 2009, nobody wanted to buy your house. So that made it “worthless.” Sorry!
There is a huge “what if” right now in North Dakota regarding the triggering of a huge tax break on June 1, 2015.
If the WTI monthly average stays below $55.09 for every month for 5 consecutive months the oil extraction tax will go from 6.5% to 0%. This is even more mouth watering than it seems – a well completed on May 31st will never benefit from this tax, and a well completed on June 1st will receive this tax break for 60 months regardless of future prices. Either you get the break for the effective life of the well, or you don’t get it at all.
Since prices are currently hovering right at this price point I need to point out one very important detail on how North Dakota tax policy decides the monthly average price for WTI.
This is copy/pasted directly from the North Dakota Oil Extraction Tax Code:
“Average price” of a barrel of crude oil means the monthly average of the daily closing
price for a barrel of west Texas intermediate cushing crude oil, as those prices appear
in the Wall Street Journal, midwest edition, minus two dollars and fifty cents. When
computing the monthly average price, the most recent previous daily closing price
must be considered the daily closing price for the days on which the market is closed.”
Link for those who want to see the full tax code: http://www.legis.nd.gov/cencode/t57c51-1.pdf?20150115095452
Very interesting that the “monthly average WTI price” is actually the price minus $2.50, so if WTI averaged $57.58 in May, then the tax break would trigger!
May will be a VERY interesting month if prices stay in their current range for WTI.
6% of $55 is just $4 of oil price.
To have a June explosion of well completions requires persuading lenders that they should fund all that proppant because of $4 of price fluctuation potential.
I don’t see why that’s all that compelling.
The ND oil tax law must have been written by a rig cookie. I have seen really weird and counterproductive taxes in my life, including one invented by chavista geniuses in Venezuela which taxed over 100 % of the gross. But I never expected to see that in the USA in the 21st century.
Taken from ND DMR page 8 Jan with a current update
County………………BPD …….. % production… #Rigs…% rigs 17 Apr diff %diff
Dunn……………….182988…….16…………………. 27……..16………12……….-15…….-55%
McKenzie ……… 378584…….34………………….60 ……..36……..44……..-16……..-27%
Mountrail………..258350……23…………………30………18……….16……..-14………-47%
Williams………..160808……..14………………..37……….22………..16……..-21……..-57%
Divide…………… 41163……….4…………………. 5………….3…………4……..-1……….-20%
So discarding Divide as it is too small to make a difference, Dunn and Williams are down a total of 36 rig, while MTL and MCK are down 30 rigs. Not a massive difference but enough to maintain MTL and MCK as the premium counties in the Bakken. Whether these wells are completed, is another matter?
MCK seems a standout with only a 27% drop in drilling rigs. It would be surprising if MCK production continues to drop faster than other counties? If it does, there is another story going on?
The Baker Hughes Rig Count is out. Oil rigs down 26 to 734, gas rigs down 8 to 217. Oil rigs are at 48.6 percent of one year ago and at 45.6 percent of their high of 1609 in October.
Does Cana Woodford include SCOOP and STACK? Notice it is almost double the rigs of one year ago, contrary to every other location.
I think so. And CLR (Headquarters in OKC) shifted a lot from ND to OK.
My apologies if this has been answered before but does anyone know why the Baker Hughes ND count is 83 whereas the ND DMR active well count is 93 (with 2 stacking). Does the BH number not include everything (e.g. water or disposal wells, or wells serviced through other suppliers) or does the ND data lag in some way? Is there likely to be similar discrepancies with other state regulatory bodies (in particular Texas)?
Not my personal opinion, but here is what Marin Katusa is saying over at Casey Research: I do notice he doesn’t include any numbers in his research comment. Perhaps he is just voicing his “in-know-the-answer” conclusion.
Texas and North Dakota produce more oil than any other state. So with oil prices in the toilet, their governments are using tax breaks to encourage oil and gas companies to continue producing. Chief Energy Strategist Marin Katusa warns that this will only exacerbate the underlying problem of too much oil.
For now, many producers are leaving wells uncompleted. That way they can store the oil in the ground and hope that prices recover. But here’s the catch: much of this “fracklog” could be forced into production later this year. Under abandonment laws, any well that’s inactive for more than a year must be plugged—and in North Dakota, it must be reclaimed.
These abandoned wells can be put into production in a matter of days, and the most effective tax incentives kick in if oil stays below $55.09/bbl for five consecutive months… which could happen as soon as May.
Bet on a short-term oil rebound at your own peril.
If truck damage to roads can’t be repair funded because of no tax revenue, change the law to a lower price.
If the ND legislature is in session this year, changes can be made.
Yeah. They have a Dem senator so they aren’t a tax raise is unthinkable place. But there may also be thinking re employment and personal income taxes. The old supply side stuff of keeping the companies going so they employ people to pay taxes theory, which could very well have merit.
Gearing up to the increased productivity in 2012 2013, there was a six month backlog of frac completions. There is no way the support companies are going to be able to gear back up quickly, after letting go a lot of their staff. I think that is the reason that EOG put a two year cost on the non-completion approach in their investor presentations. The idea that you can turn the “spigot” on as soon as the price of oil goes up, leaves a lot of reality out of the logic. We have, by now, crossed the Rubicon. The drop, and I am guessing over 1,000,000 barrels a day, will happen no matter what the price of oil will be this year.
FWIIW
FreddyW IMO in the previous post posted an interesting chart showing production developments for a few wells that are set close (downspaced) in Parshall.
Using Enno’s data and looking at the developments in average LTO totals for EOG’s wells in Parshall (MTL) and as per Feb 15 produced the results as shown in the chart below.
2008 and 2009 was good. 2013 so far best, 2014 has so far performed around average (these are very good wells!)
Note also 2012 that started good, and then fell behind.
Big picture. These are the best wells. Looks like maybe they’ll get 350K barrels ultimately each, given 2014 has regressed to the average.
At $100 that’s 35 million. 3.5:1 profit over $10 million well cost. At $50 it’s 1.7:1, for the very best wells in the whole field. That’s $50 rec’d. It takes WTI 90 minus 15 for NoDak price of say $75 or so. Royalties and taxes knock off 25% to get $56. Opex $6.
You gotta have $90 WTI to get that 70% profit on well cost and you get most of it in 3 years on the very best wells in the whole field. The rest of the wells. . . my God.
WTI is $35 below 90.
What a joke.
Watcher,
What makes you conclude that the average ultimate may be 350 kb?
The chart shows that as of now the average may reach around 350 kb after 60 months (5 years!).
Watcher, your estimate is hard to read and only as good as the assumptions you put into it!
Watcher, it is behavior like yours that make me seriously consider end sharing on POB!!!!!
There is a couple of minor bugs in the chart, like delete “12 MONTHS” in the heading and last data point (month 14 for 2014) Things like that happen when a template is imported and used in a hurry.
350 is where the avg case ended 5 yrs, and that line is flattening. Not gonna get much more, especially if it’s not worth sending water trucks to flush out salt from the low flow pipe.
Big picture was metaphorical, didn’t refer to the size of the chart. And what a joke referred to the economics, not the chart.
Watcher,
”350 is where the avg case ended 5 yrs, and that line is flattening.”
Can you back up your claim with documentation?
”And what a joke referred to the economics, not the chart.”
Watcher,….. The joke is your economics.
I’m surprised at your read on this. What did you think these wells are going to ultimately yield, particularly with the down turn in the 2014 wells at later months. They would already have a full year of decline in them and their decline rate thus more gradual, so there’s no case to be made for choking — because why choke a well that has already slowed down. Probably the late 2014 wells cause the little wiggle at the end because they don’t have 14 mos yet, but they are otherwise lined up on the average, as a whole.
As for flattening, the flow rate is slow after 5 yrs. Salt encrustation becomes an issue. Frequent trucks with fresh water req’d to flush the well and keep what little is flowing . . . flowing. Costs up, not much flowing, price down, the case for flattening is credible. You can’t see it historically because price hasn’t been $55 til now.
Watcher, I don’t think you should try the oil business, the way you grind numbers isn’t appropriate. You see, this is a pretty competitive business. And it really doesn’t make that much money. What happens is everybody focuses on the guy wearing the gator boots and driving the Cadillac, but those guys are offset by other guys wearing 10 year old boots and driving a pickup with a busted windshield and an expired inspection sticker. To make money one has to be really hard nosed. This means costs have to be cut, and wells have to yield more, and this means nursing them to make oil for far longer than 5 years.
Fernando. On the whole, do you have an opinion as to whether those that drill the wells or those who buy the established production fare better financially in the long run?
I am in the camp that the later do, but that has been our model so I am biased. Plus, we are in such a small niche that our experience may not be very accurate on the whole.
Always something I have thought about and would appreciate insight from the many with more knowledge and experience than I have.
Shallow, we can’t generalize. The outfits with smarter and harder working people tend to do better. I’ve been involved in purchases and sales, and I found that we didn’t focus enough in trying to set up a good evaluation team. This means you can do really well as a smaller competitor buying properties others don’t appreciate.
I like to give one example that’s really incredible: many years ago I was asked to approve a report recommending that a five well field be abandoned. But I thought the engineering was a bit goofy, so I put a hold on that abandonment, and sat on my own time to study the field geology, the wells, just about everything. In the end I responded the field wasn’t depleted, recommended they drill an additional well, and that sucker came in at 10 thousand BOPD. If that property had been abandoned I’m pretty sure a little company would have made a killing.
Repeating, the key is to get really good at it, keep your costs down, and seek places where you already have an insight or an advantage.
FOR ALL
This is a critique of Watcher’s estimate on shale oil economics.
Using data for the average of EOG’s Parshall wells, of which and so far the wells started in 2014 follows.
The well cost is set at $8M and all estimates are point forward, half cycle and WTI.
For what it is worth these average well “trends” towards a total of 510 kb and is cut off as flow comes at/below 10 bbl/d. This will not be known before after the fact.
Estimated undiscounted break even at $42-$43/Bbl (WTI)
Estimated discounted break even at 7% discount rate at around $51/Bbl (WTI)
Estimated discounted break even at 10% discount rate at around $54/Bbl (WTI)
Add normal error bars to the prices shown above.
Wells with actual data from NDIC show that after 60 months they flow above 70 bbl/d.
Watcher then goes on;
”What did you think these wells are going to ultimately yield, particularly with the down turn in the 2014 wells at later months.”
Watcher has repeatedly been requested to produce documentation and/or links that support his claims.
So far he has produced NOTHING! NADA! ZIP!
Anyone are free to speculate, question is what value is that of?
Watcher I will give it to you straight, since small hints do not do it;
You have willingly demonstrated that you know nothing about petroleum economics!!!
You only serve a series of claims and refuse upon request to produce documentation that supports independent verification of your claim.
In short Watcher, you are adding NOISE to hide the signal.
How can there be documentation on ultimate recovery from a Parshall 30 or more stage fracked well?
Oh, and
http://news.nationalgeographic.com/news/energy/2013/11/131111-north-dakota-wells-maintenance-water/
Elevates costs for slow flow older wells. Shut em down earlier, especially at low price. Reduces ultimate recovery.
Interesting link. Is there anyone who could give a run down on the use of maintenance water in the Williston Basin?
We use acid to clean out both injection wells and producers. However, average acid jobs on about 5% of wells each year.
This reads like something required on a regular basis on all wells. Given the 2 miles vertical plus the two miles lateral, I bet these maintenance water treatments are not cheap.
Wish there was information on OPEX per barrel for wells completed by year. I bet 2010 and earlier are high in Bakken.
OPEX per barrel is a number often ignored by many when discussing shale.
As I have pointed out in our real life experience, as bopd drops, OPEX per barrel naturally increases. Labor, utilities and down hole chemicals stay fixed, with increases for inflation.
If I have a Bakken well producing 122 per day gross, assume 80% net revenue interest. 97.6 barrels per day. So if OPEX is $10 per barrel, $976 per day to operate the well.
Say in four years, it now costs $1,050 per day to operate the well. Well rate is now 50 bopd gross, 40 net. OPEX is now $26.25 per barrel.
But if rate in four years is 30, 24 net, OPEX is $43.75 per barrel.
Just examples, numbers will vary all over the place. Would be interesting to see some Bakken lease operating statements.
Apparently comment editor not working, but thought I would point out that it should be expected OPEX per barrel will head up significantly as number of completions drops.
Use my example the other way. Say first year production is 150,000 barrels of oil. $976 x 365 = $356,240 / 120,000 = $2.97 per barrel. Could be less if well is flowing, OPEX is minimal.
Again, I really think a boat is being missed by no one focusing on what OPEX looks like for wells in EFS, Bakken, in years 6-30.
Most wells we operate range in age from 30 to 110 years old. We have been able to drive OPEX, plus maintenance CAPEX plus G & A below $40 per barrel during this down turn. Has not been fun, I will admit.
I doubt most of these shale oil wells will be in that economics ballpark in years 30-110.
For example, per 2014 SEC 10K, Oasis petroleum OPEX, plus marketing and transport expenses plus G & A is $17.47 per barrel. I think that is pretty darn high for a bunch of high decline wells, most of which are less than 5 years old. That’s on about 45,000 barrels per day net. In 2020, let’s say we are down to 15,000 barrels per day net and expenses increase 2% per year.
I come up with those same three components at $59.02 per barrel. And we don’t even know if they are throwing rod jobs, tubing jobs, maintenance water treatments, into CAPEX.
Shallow,
It seems a lot of the economics of the shale wells depend on the long 30 year tail. As Wathcher and yourself have pointed out, this long tail may be in doubt. The first of the Bakken wells are just coming up to their 5th birthday. It would be interesting to some detailed analysis on some of these older wells.
Maybe Coffee with his $50 investment, maybe able put up some details to tell the story.
Up thread, I was asking about Barnett shale. I know it is gas, but it is the oldest of the shale plays, and may also give us a look into the future and let us know what to expect from Bakken.
Toolpush wrote;
”It seems a lot of the economics of the shale wells depend on the long 30 year tail.”
LTO wells are front end loaded with regard to their profitability.
The tail has very little influence on LTO wells overall profitability.
The discount effects see to that.
Rune,
Thanks for the feed back. As you state the discount rate will mean the wels are front end loaded.
The shales players as well as commentators on here readily roll out URR numbers, that seem to take into account long tails. For want of a better word, what would,the Economic URR look like.
In other word taking the accumulative flow, discounted for NPV, if that is possible?
Toolpush,
And FWIIW.
Several years ago we discussed this thing (in different forum and different professionals), and this discount effect is key to understand shales with their steep decline rates.
Price is still the thing that makes it move.
Just to illustrate this, a pro forma shale well was found to earn 70-80% of its NPV after 7 years while it recovered “only” 50-60% of its expected total.
There is a business opportunity to get out of the shales after some years as this discount effect creates some “magic” barrels for the Seller.
It has to do with when in time your initial investment is made. Seller and Buyer has different reference points along the timeline.
Hi shallow sands
I don’t expect the average Bakken well will go beyond 25 years.
Shallow, I never did a water wash in a horizontal well, but we used to do it in the USA gulf coast (the salt domes turn formation water into fully saturated brines in some zones).
The typical wash amounted to the volume needed to wash the gravel pack and/or perforations, and this volume was simply bullheaded.
I assume a horizontal well requires a coil unit to displace water all the way to the toe. But that’s a 12 hour job.
Warning rambling comment,
Sometimes people from outside a given trade or industry know something the pros fail to take into account.
I was once upon a time working in a ” body shop”, a garage that specializes in repairing wrecked cars, and the thirty year pro- a first class craftsman- working in the next bay kept grinding away at a stubborn welded hinge until I couldn’t stand it any longer and went over and asked him why he was not using the proper grinder.
He had no idea what I was talking about so since I had one in my truck I brought it in and did the job for him in about five minutes. There were three other pros in the shop. You could have stuck a baseball in anyone of their mouths easily.
EVERY welder at that time had one of this type of grinder.
None of these guys had ever seen one – or even heard of them. I would simply have not believed this possible unless I witnessed it myself.
Now to jump to oil – the PRICE of oil in my humble opinion WILL go up rather sharply within the next few years . If the folks who own tight oil wells have locked in their financing the way out years portion of the long tail still won’t be worth much in terms of the net present value.
But some of the oil that comes out of these wells within the next four or five or ten years may sell for record prices.
Would the tight oil folks be making a decent profit?
Somebody with a spreadsheet already laid out could plug in this price and have an answer in a flash.It might be a poor answer if the lease operating expenses are underestimated of course.But the big money has already been spent.
The reason I bring this up is that nobody in this forum who is crunching numbers mentions price inflation very often. It seems to me that most of the costs of existing wells and wells that will be drilled within the next year or two are basically already locked in – assuming loans are long term fixed rate.
I know people who are renting houses bought with thirty year mortgages twenty five years ago that are getting rent four times the piti monthly payment. They could cash out at HALF the current prices for such houses and their books would still smell like roses for the entire period.
The same thing in my opinion applies to wind and solar farms. With payments basically locked in they may not generate much profit if the owners had to contract their sales at fixed prices ten or twenty years out.
But LOOK OUT once that contract expires if the price of coal and natural gas has skyrocketed!!! A wind or solar farm selling into such a market will generate BOODLES of cash.
Any company or individual able to build a wind or solar farm intending to use the generated energy rather than selling it may earn an enormous return on the investment given the AVOIDED costs of purchased electricity five or ten or twenty years down the road- if the wind or solar farm can be built with a fixed rate low interest loans .
So in the opinion of folks who should know -HOW HIGH would oil have to go- and stay- to make existing typical young new tight oil wells ” for sure” profitable?
I covered the water cut in a post some time ago
http://fractionalflow.com/2014/12/11/will-the-bakken-red-queen-outrun-growth-in-water-cut/
Rune, the article Watcher linked to refers not to produced water, but to fresh water that must be pumped down the producing wells from time to time to keep the wells from plugging up.
Depending how often this must be done, could add a lot to OPEX.
Toolpush. I would sure like to get my hands on some reserves reports and lease operating statements of Bakken and EFS wells.
As you likely know, the OPEX plugged in can sure skew PV calculations.
Shallow, I am aware the article was about fresh water use, but it did not have much useful material in it.
How often will wells have to be subject to said treatment?
What is the cost for said treatment?
What is the flow state? Flow rates and temperatures affects the rate of deposit build.
Etc.
For me, Watcher may as well have linked to Disneyworld.
It is the produced water that contains the minerals that may deposit and require the well to be cleaned.
The growth in water cut is possible to document from NDIC data.
Ok. Sorry about that. Rune, do you have any lease operating statements for Bakken wells? I am curious about things like cost to haul produced water, etc. I agree without hard data, hard to get a good handle on things.
Shallow,
No, I do not have any lease operating statements.
A while ago I did some back of the envelope estimates for costs from produced water and found it ranged from $0.50 -1.00/bbl (produced water). I have seen other more accurate estimates (do not have links) that puts it in the same range. These costs varies with mode of transport (pipeline, truck), distance to water disposal site etc.
In other words, if the water cut is 50% the costs for produced water $0.50 -1.00/bbl (LTO).
If the water cut is 67% the costs for produced water $1.00 -2.00/bbl (LTO).
If the water cut is 75% the costs for produced water $1.50 -3.00/bbl (LTO).
This is also why I found the water cut developments interesting as it makes it possible to make (good?) estimates on how this portion of the OPEX develops with time
Rune, I actually posted down hole that I believe sometimes produced water disposal is more like 4 dollars a barrel:
A typical tandem axel “vacuum’ truck used to haul water can carry 165-175 BW safely. Disposal fees in Texas are 50 cents a barrel, minimum. Say it takes one hour for the truck to leave the yard and get to location. The driver will fiddle fart around the best he can and take an hour to load. It will then take him an hour to drive to the disposal facility and offload; then another hour to drive back to the yard. That’s 4 hours at 125.00 dollars an hour plus the disposal fee. I have seen lines at disposal facilities where trucks have to wait to offload.
“In-house” produced water gathering, treatment and re-injection systems for bigger shale companies with very dense well inventory in tight areas (sweet spots) those disposal costs would, of course, be much less. Its hard to generalize produced water costs; it depends on a lot of things, as you have said.
Produced water is the curse of all oil production; if WOR increases in LTO production as depletion occurs, the corresponding costs will increase greatly. It is getting harder and harder to permit injection wells, fewer facilities are cramming more and more water, at higher injection pressures, back into the ground. And then there is this earthquake fear that makes it even more difficult to permit injection wells. Disposal costs will keep increasing, no doubt.
I know you know this, other’s won’t; there is always residual oil in water concentrations in produced water. Sometimes the amount of oil left in produced water is remarkable. I have a mate who has a big commercial disposal facility in S. Texas and he can handle, and does handled, up to 25,000 BWPD. He provides residence time for that water, and treats it, before it is injected downhole. In the process he skims 3,800 BOPM off the water that comes thru his facility and sells that oil on WTI postings. Gravy, he calls it.
Mike
Mike,
Thanks and you have hard data on costs for disposal of produced water.
Just to stay with your example, 4hrs@$125/hr totals $500. If that trucks hauls 170 bbls (about 27 tons) that amounts to $3/bbl just for the transport (truck) part, and no doubt that is considerable.
It would have been good to have more detailed data on this for Bakken as this is something to watch.
Total produced water disposable costs of $4-7 per produced bbl of LTO is something worth revising the economics from. But hard data to have cover from is needed.
Having a produced water gatherings system (pipelines) may fast become attractive if the volumes are there. Not sure what code requirements would be for such a gathering system.
Yes, and then there is the ownership to any oil separated at the disposal facilities.
I have not seen a chemical composition for the produced water, but understand they may contain minerals and metals that may be worth to take out.
Running a produced water disposal facility may be attractive.
The national geographic article is wrong. Halite deposits can be dissolved with brackish water. In other words, a pure fresh water isn’t needed. The use of brackish water requires a study to understand scaling tendencies. But as far as I can tell they could use water with 2 % salt concentration.
You really got to be careful with these general media articles. And as I stated before I think North Dakota needs to up their game to a higher level.
Watcher,
The point is we have to wait and see.
Rune
What is the spacing like on these wells? I think mason Inman has also looked at some very closely spaced wells over on his beaconreader page (the article was recently made free to view) and concluded that the results weren’t spectacular, but they didn’t look terrible either.
Sam,
As I mentioned in the previous post in a comment to the good work of FreddyW, is that I would like to have had the time to look more into detail of wells that are closely spaced (downspaced), so far I have not done any work of this.
I would have looked at production development for LTO, the GOR and water cut as this is what public data allows for.
If, in addition there were time series of down hole pressure readings, that would have been great, but of course required some time to do.
Mr. Taylor, the ND DMR site has a Gis map with all the wells depicted in accurate physical layout. The identifying permit numbers can be correlated to the actual well number/name (API or company), to match physical spacing with published production.
One aspect NOT gleaned from mere viewing of said map is which formation/bench is being targeted. The vertical spacing as well as the horizontal distance then comes into play.
Although the individual companies’ presentations can offer much color to this topic, EOG is notoriously closemouthed concerning their operations.
The accepted consensus is that EOG has delayed, for numerous reasons, full development of the Parshall. While this view runs counter to the ‘sweet spots drilled first’ meme, a quick glance to the left on the Gis map shows the prolific Sanish field … a harbinger of the future Parshall.
http://www.wsj.com/articles/low-prices-cool-boom-in-u-s-oil-production-1429235826
“The relentless increases in U.S. oil output appear to be coming to an end.”
“Crude production remains robust, but new data and forecasts, including one Thursday from the Organization of the Petroleum Exporting Countries, suggest the U.S. is at—or very close to—an oil-output peak. Starting in 2008, drillers raised U.S. oil production from five million barrels a day to 9.3 million barrels a day as of December. The U.S. surge accounted for nearly all the growth in crude output globally, and it contributed to the glut that sent oil prices tumbling 50% last year.”
Nasty Peak word again. Gab a bar of lye soap and forever rid their mouths of such filth.
Comments amusing read, but no API Reality discussion yet. WT?
Google “WSJ oil cool boom”
A brief history of investing.
Buy low, sell high.
When everyone is selling, I am buying.
The time to buy is when there is blood running in the streets.
Those and many more. I wonder why? Must have been a lot of stupid investors. Or, maybe they were smart, since they made enough money to be quoted. But, today is different. The widely predicted, [Sorry, the out of the blue] oil price collapse has caused many O&G companies stocks to fall to less than half of what they were in less than a year. Oh well, nothing of note here, just move on. Or, should one actually look at history and decide that this is a gift from God investment opportunity? No guts, no glory. Wait until it spikes up again and everyone is buying – then it will be “safe” to pile in.
Buy high, sell higher. No one ever went broke taking a profit. A sinking tide drops all boats. There has never been a better time to buy a house (errrr home is the lexicon).
It’s all crap. The Big Trade guys shorted the MBS that they knew contained worthless homeowners, errr, mortgages. Then they didn’t just sit back. That’s not proactive, just sitting back. No, they got Goldman to get those MBS into the hands of oblivious clients and then revealed the worthlessness of them. This makes them great predictors?
The BOJ buys STOCKS. They are a huge buyer of equity ETFs on the Nikkei. The Nikkei is rising. This makes BOJ great predictors?
Why believe the sayings of the past matter when the “market” of today is not the market of yesteryear?
One thing thats very predictable are central banks. Everything they do they do to protect the sovereign debt. Anything that threatens sovereign debt will be dealt with. There is a little over $100 trillion dollars in sovereign bonds that are the collateral used for about $700 trillion worth of trades.
The value of this collateral cannot be allowed to be devalued. Central banks will buy all sovereign debt at any price if it need be. Until their credibility becomes an issue. Whats monopoly money to them is very real money to everyone else. Their biggest problem is they see no limits. So how long will or can the BOJ remain creditable? I imagine it’s longer than we think but not forever. When fuel shortages arrive on that island things are going to get interesting.
Interest rate hikes are big no no’s as they devalue the collateral that underpins $700 trillion worth of trades. The Fed and the other CB’s are playing a game they ultimately can’t win. Bond prices must continue to go higher and yields lower or monetary system implodes. They lose credibility at some point it’s that simple. Unless 10year bonds at a eventual -5.0% yield is still creditable.
So take your pick. Implosion of public debt by loss of credibility or implosion in private debt by lack of fuel. Either way the ending is pretty much the same.
straight from the EIA website..
About EIA
The U.S. Energy Information Administration (EIA) collects, analyzes, and disseminates independent and impartial energy information to promote sound policymaking, efficient markets, and public understanding of energy and its interaction with the economy and the environment.
About EIA.gov
Our website, EIA.gov, is the primary communication channel for the U.S. Energy Information Administration (EIA) and serves as the agency’s world-wide energy information point of contact for:
•Federal, state, and local governments
•The academic and research communities
•Businesses and industry
•Foreign governments and international organizations
•The news media
•Financial institutions
•The general public
From January-December 2012, there were 22 million visitor sessions to the site, averaging 1.83 million visits per month. The site consists of approximately 500K files of all types that support our wide range of products, 41 email subscription lists, four Application Programming Interface (API) data sets, and 11 RSS feeds.
EIA has forged a tradition of excellence for its public website, thanks to a solid vision for a high-quality presence on the web and hard work throughout the agency. The EIA website has become the public face of the agency and its information, data, analysis, and services have informed policy and programmatic decisions at all levels in regards to energy and its interaction with the economy and the environment. Key indicators of the site’s success in serving our customers include: •451,491 total subscriptions to EIA email update lists in December 2012.
•Major search engines (like Google and Bing) refer to us an average of 530,000 visitors a month searching for energy topics.
•Search engine rankings of EIA on Google indicate very strong performance on relevant key topics.
•92% of our customers say they are satisfied or very satisfied with the quality of the information on our website.
•85% said they found what they were looking for on our site.
•68% of the first-time visitors said they were very likely or somewhat likely to return to our website.
•86% said the level of detail on the site was just right; 6% said the content was not detailed enough. Less than 1% said the content was too detailed.
•The top three words customers use to describe EIA are informative, expert, and objective.
So if EIA data / reports are inaccurate or biased, how will it be possible to even try to make any intelligent policy decisions? Not that we will even try, but….
I’m am not intending this as a rhetorical question.
For example, with the current price of oil on the global market, would it make sense from a national perspective to stop all high cost US production and import oil keeping US oil unproduced and “in the bank”?
So if EIA data / reports are inaccurate or biased, how will it be possible to even try to make any intelligent policy decisions?
Why is that important? That which is inevitable is inevitable. You can’t generate a policy that commands more oil to be in the ground. Well, you can command it. Geology doesn’t have to obey.
It’s annoying on a day to day basis to hear that the price is low so there must be infinite oil, but it doesn’t really matter. Geology doesn’t care what the price is. The pores are still as far apart as they ever were.
There is no technology advance below Star Trek transporter beams that will make any difference.
That which is inevitable is inevitable. Configure for victory, not global comfort.
I suspect the EIA has two sets of books. One is intended for public use, one is their secret book. Or maybe the government has a secret agency doing better work? Something like the Men in Black?
I know you think this is funny, but I’ve worked on deals which had triple layers. One was public, one was intended for spies to steal to throw the competition off, and the third was kept in a secret location. So if companies do it, I bet the USA government may have a super double secret energy outlook. And I bet that’s one reason why Obama looks scared all the time.
No, this is one I don’t think is funny and actually agree with you. I am sure our military and at least some of our “information” agencies, CIA perhaps?, have their own outlooks. Some of those aren’t that secret.
Heck remember the Hirsch report?
That being said, if there are significant actors “in the know” wouldn’t there at least be actions we could see that would indicate they are behaving as if they knew something was up? Besides looking scared? Can this be one of the reasons for our ridiculous foreign policy wrt ME?
and where are the whistleblowers? Has Obama put the fear into them?
So far as I know I was the first person to mention military think tank white papers known as JOE for joint operating environment on the old TOD site. I might be wrong about this of course.
But EZRMike is right in that the government is thorough in gathering information.
The point is that government seldom if ever makes ANY effort to publicize information that will harm bau in the short to mid term.
In military intelligence one of the very most basic rules is that you always keep in mind what the enemy might be ABLE to do rather than just what you think he MIGHT do.
For what it is worth the JOE papers were the tipping point resulting in at least three or four personal hard core bau conservative acquaintances accepting the reality of resource depletion and overshoot.
I particularly make a point of telling flag wavers about them.Lots of people put a lot of trust in the American military establishment. Some of them rate whatever comes out of it as holy writ.
The Limits of Growth become real to him when this sort of person reads JOE reports.
If I were still getting out and around I would make a point of running off copies and distributing them at all sorts of right wingish political and business gatherings.
And so far it goes pointing out such reports to liberals and leftish inclined folks does go a good way towards proving to them that ”military intelligence” isn’t an oxymoron.
You’re probably aware that some congressmen have tried to get in between the military and whatever green activities the military is promoting.
It’s kind of like state governments trying to censor any mention of climate change.
In order to understand bullshit and recognize it when you encounter it , you must be reasonably well informed in three basic respects.
You must understand the abc’s of the basic sciences.
You must be well informed in terms of public affairs in general.
You must understand the nature of Darwinian competition WITHIN our species. We no longer compete with natural enemies to any substantial extent , we compete with EACH OTHER.
And we compete with each other IN GROUPS that may or may not intersect and interlock in a gazillion different ways. Sometimes one group has only a little influence with another group – sometimes it totally dominates it to the extent the smaller group is functionally a wholly owned subsidiary. Sometimes a loose coalition of larger groups totally dominates a small one.
Groups recognize each other as allies or as enemies or as neutrals that can be safely ignored .
Some of the groups we compete with these days are a new potentially IMMORTAL artificial life form- possessed of astounding intelligence but no ethics or morals at all- invented by groups of humans in order to further group ends. We know these forms as corporations. Like an invasive biological species they have taken over most of the economic landscape and threaten to totally upset the economic apple cart.
The people who work in places such as the EIA come to understand QUICKLY indeed that you either generate the results desired by the folks upstairs or else you will find yourself looking for a new career.This rule applies right on up to the secretary of the department.
IT’s so simple it hurts, so simple it is hard to believe it isn’t more complicated. You are either part of the tribe and adhere to tribal norms and taboos or you are cast out. The energy department tribe depends for its existence on its interlocking alliances with lots of other tribes , most of them many times bigger and many times more powerful.
Some of the bigger more powerful tribes are the Republican and Democratic parties, the big banks, big industry of every sort etc etc. Taken together they totally dominate such a pipsqueak agency as the EIA.
Anybody who expects the EIA to do anything to seriously upset the heap big fellas – something such as predicting a major shortage of oil within the next few years for instance – is no more than a cretin when it comes to his understanding of our society. Gold in Sacks he a really big fella corporation , tall as a tree. Obama is a ten footer. Guv’mint Motors is six six and two eighty.
The people who work there are about as far out on a limb as they can safely go predicting a peak in oil production a few years down the road with a long plateau after that.
Fernando is right about the government and businesses keeping two or even multiple sets of ” books”.
Anybody with a working brain can rest assured that SOME congressmen etc are smart enough to have staffers who tell them what they THINK instead of what they want to hear.I expect Caelan was right – not about NICK but in the general case – when he remarked recently that the government has people reading blogs such as this one . Some of those people will be passing summaries of what they read here upstairs to a supervisor. Some small portion of it may eventually wind up quoted at a meeting of the NSA or Homeland Security hdq.
Some so called leaders are of course incapable of thinking and surround themselves with yes men. You don’t have to be able to think very well to get to the top in politics. You just have to be lucky and somewhat likable, plus you have to understand what to say , or not, and when.
If you own a share of a small business in trouble you try to keep your crew from worrying while you level to a far greater extent with your supervisors. You save the really tough or really good stuff to be discussed only with the other owners with perhaps some of the most trusted and discreet supervisors sitting in .
It works this way all the way up. Not exactly and not all the time of course. But mostly.
Just do a search at google. Something like ‘Old Farmer Mac, peakoilbarrel, comment’.
Here’s one place that records comments:
Old Farmer Mac
“Why is that important? That which is inevitable is inevitable.”
Then why present the information at all?
To collect paychecks.
Sometimes I would like to post a link to a you tube video related to the subject matter but it comes up as a video screen bandwidth hog on this site instead of just a link which uses very little bandwidth of course. .
Then when somebody else posts a you tube -sometimes relevant , sometimes not – and I try to bookmark it, then the actual bookmark created is to the current Peak Oil Barrel article. Then I have to sort thru all the comments to actually find the video.
If it matters I am using a Mac mini about five years old , updated to the last OS, and Safari.
By way of explanation for not figuring this out myself I managed to avoid computers until after my brain fossilized in case this is a preschool level problem.
I got an explanation on this some weeks ago. The embedded vids may or may not consume POB bandwidth and stress Ron’s bill from his host.
OTOH, posting a link and only a link won’t do that — for sure.
Just post links.
A deleted comment will mess up the order quite a bit.
gorillas and apes
the web address that you won’t see:
https://nationalzoo.si.edu/animals/primates/facts/
html links
Mac, post it with a space in the middle, we can figure it out, cut and paste it, delete the space, and stick it in the safari window, then connect via wifi to the gadget that puts videos on our wide screen tvs.
Here’s the video with the head of the EIA on the EO 2015
https://www.youtube.com/watch?v=Miuu6rEaNEg
Apologize for this test in case it doesn’t work. What I’m doing is using Google’s URL shortener on the Youtube URL to see if it is clickable with out embedding the actual video. It is the same video as above from the EIA.
http://goo.gl/omXyPO
I think it worked!
There is a lot of talk about why companies are not completing wells. Maybe the question should be why are the oil companies drilling wells?
Going by the Chesapeake presentation, that Ron references in the lead, it may be because they have no better financial choice.
http://www.slideshare.net/ChesapeakeEnergy/20150323-latest-irpresentation-46233021
Chesapeake, seem to be cutting capex in half again, after already having made significant cuts backs since last year. Even though we are nearly 6 months into this down turn, Chesapeake is going to choose to pay out long term drilling contracts. Of which to this point in time have been drilling wells, but most likely not completing them. This situation sounds like the frac crews were on much shorter or much more flexible contracts than the drill crews.
This may just be a Chesapeake problem, but more likely numerous other companies are in the same bind, time will tell. The interesting thing about this presentation is it may be a lead indicator that the other oil companies maybe in for another round of drilling cutbacks, whether they simple contract expiration or payment of cancellation fees. The lead up to the quarterlies should be interesting.
Push, the CEO from Schlumberger floated an intriguing proposition today at a presentation. He offered his company’s equipment, personnel and frac’ing expertise to receptive operators at little to no cost in return for a share in future revenues from the now- frac’d, producing well. He seemed particularly interested in targeting refracs as Schlumberger has introduced a line of tools/analysis/techniques they feel are especially productive. (‘diverting’ agents are proppants that temporarily plug fissures enabling new ones to be created, for example).
Seems like a lot of moving parts to his concept, many of them problematical. However, Schlumberger has a lot to gain if some type of collaboration occurs, and the operators can proceed with minimal additional financial outlay.
Interesting idea.
Coffee,
It sounds like the service companies want to become oil companies. Halliburton have been taking shares in oilfields since at least the turn of the century. When I was in Brasil, the operator was Petrobras, but Halliburton was a major share holder and were calling most of the big calls. Plus Halliburton took over the northern section Ghawar to play with their EOR technology.
Schumberger, will have plenty of cash, unemployed equipment, and a labour force begging to be kept employed. Schlumberger has nothing to loose and everything to gain. On the other hand the oil companies are fighting for their survival, and will most likely do anything so they have 50% of something when all of this is over, rather than 100% of nothing!
edit: Coffee, do you have a link?
Yup.
Mostly this is all numerical gobbledygook. If the dollar doesn’t decline and drive oil up, all these games being played are going to lose. I personally think one more leg down will cut the hope threads of most of them and there will be an avalanche.
Or a bailout. Equally probable.
Watcher,
Be on the look out for a Euro rebound. I know you don’t really believe in technicals but Euro is setting up for a rebound.
Remember how oil traded down seemingly everyday with the EUR/USD trading down. The correlation is by no means 100% but it’s pretty strong. We get a rebound in Euro it will be enough to support oil into the mid 60’s
Fundamentally a euro rebound will makes sense if Greece works it’s issues out. Technically the Euro is in the process of forming the foundation for a rebound against a few currency pairs. So the charts are reflecting what the expected outcome of Greece situation is which is no Greek exit. It’s not time to go long Euro’s just yet but market is turning.
If by chance we get a Greek exit. It might be dollar positive against the euro. But not dollar positive. It would insure no rate hikes for foreseeable future and the Fed would probably do QE 4 if Greek exit did occur. Which would totally change the outlook for oil.
Semi addressed later, and down at the bottom posting an item from yahoo that is the FIRST explicit MSM presentation of the Russian Turkey – Greece gas pipeline strategy.
The reporter didn’t understand its significance, but it did get laid out. Just not the impact of bankrupting Ukraine into submission.
“We get a rebound in Euro it will be enough to support oil into the mid 60’s”
SAWDUST,
Recently you wrote that if oil went over 55, it would go to 67. Based on technical chart reading. Not mentioning a connection to the Euro. Seems you change your vision on a daily or weekly basis.
“I Should add if we get a Greek exit here the EUR/USD will drop like a rock but oil will stay steady or even go up. Correlations breakdown under the right circumstances.”
Or even change it the same day.
” If by chance we get a Greek exit. It might be dollar positive against the euro.”
Might be dollar positive against the Euro, or EUR/USD will drop like a rock is quite a difference. You have to chose one of the two possibilities.
Might be dollar positive against the Euro. Meaning it’s going to be a Euro move not a USD move and USD strength is not the result your going to get. It’s just going to appear that way in EUR/USD. We get a Greek Exit. Then it’s a risk off situation. Bonds will be bid sending yields lower. Lower yield doesn’t help the dollar. Yen crosses will unwind taking equity markets with them. Which is very dollar bearish. Dollar is a risk on trade it’s only going up if everything is running smoothly and the economy is rebounding and everyone is behaving. Greek situation has been weighing on the Euro so if they work things out thats Euro positive against all it’s counterparts. It also should lend oil prices some support. Note Greek playing nice staying in the eruo doesn’t = dollar strength if it = euro strength. Currency markets are the most complicated to understand. Thats why good technical analysis works and trading the new does not.
Han Neumann,
I exited my short USD/CAD position as there is now room for a rebound attempt. I will resell it at higher levels. Good technical analysis equals 640 pip’s or points times $150 for each pip or point for me. No way in hell i could make that trade based on the news. Oil has a little room for a pullback now as well. Oil drives the CAD if i’d just listened to the news i’d never have made the trade.
I understand how particular scenarios will effect markets and i’ll talk about them from time to time. But i only trade technicals. Because it’s easier to make a mistake based on what you think might happen fundamentally and whats news driven. Trades based upon what you think might happen are often wrong and are basically speculation.
Coffee,
Not sure if this is the presentation you are talking about, but it does have some good lines, like this one.
http://www.slb.com/news/presentations/2015/2015_0323_pkibsgaard_howard_weil.aspx
In the short term, activity visibility still remains limited as many of our customers are making drastic and sometimes unpredictable cuts to protect margins and cash flow.
Reminds me of the quote, “Desperate men, do desperate things”
Edit, Another good bit of info, from the people that would know.
With a capex per barrel averaging over $40, the urgency of finding these solutions is highest for tight oil and deepwater fields, which today consume around 40% of the global liquids-related E&P capex, while only representing around 12% of global oil production.
Push, fulfix.com. posted today. lead story
”Plus Halliburton took over the northern section Ghawar to play with their EOR technology.”
Now somebody try to tell me that the CIA and the NSA and probably just about every major western country intelligence agency doesn’t know the score when it comes to what is happening in Saudi Arabian oil fields – or in ANY oil fields where western contracting companies are major hands on technical players.
It follows that congress critters on the right committees hear testimony behind closed doors (or one on one behind their office doors) from the spooks.
At least a few of those Halliburton guys are no doubt conservative patriotic types willing to bend the rules a bit or a lot for their countries- and at least a few more are no doubt willing to sell for money once retired.Plus there are other companies involved as well. This would be especially true in the case of laid off or fired employees holding grudges.
And at any rate , since we now know for sure about the extent of snooping thanks to Snowden, it seems perfectly safe to assume that copies of plenty of important internal communications in oil producing countries wind up in various spook headquarters about as fast as they do in the hands for which they were intended.
The Russians have supposedly reverted to using manual typewriters and couriers for their most sensitive communications.I accept this as true until I hear otherwise from some credible source.
How do you negotiate what share he gets when he is the only one that knows anything about his tech? You can’t possibly get a fair price. Walk away.
Watcher, Sure seems potentially fraught with many pitfalls. If an arrangement was made along the lines of continue what they have been doing – give or take – then simply not present the bill as due until the product was sold … sumptin like dat.
Thing is, in the abstract, if it DID work, it would pressure Schlumberger’s competitors to get on board, as well as allow operators to produce (esp refracs) at minimal financial outlay.
http://oilprice.com/Energy/Crude-Oil/Has-The-Bakken-Peaked.html
“That’s right. Oil production from the Bakken may have reached a peak, at least for the foreseeable future. While the EIA is predicting that U.S. oil production will continue to rise this year and next, it may be missing the story going on in North Dakota.”
“Peak” … Houston Rodger, We have Peak. Stardate 2015 Elon’s Falcon 9 for Frack thrust “pad” .. Close but no cigar, Next touch down, LTO.. Lighter Tighter Orefrac pressure & proppant. http://aviationweek.com/space/video-falcon-9-close-call
Yesterday’s daily activity report:
#28019 – QEP ENERGY COMPANY, MOBERG 4-20-21BH, SWSW 20-149N-95W, MCKENZIE CO., 2590 bopd, 1484 bwpd – BAKKEN
#28020 – QEP ENERGY COMPANY, MOBERG 3-20-21TH, SWSW 20-149N-95W, MCKENZIE CO., 2325 bopd, 1917 bwpd – BAKKEN
#28021 – QEP ENERGY COMPANY, MOBERG 3-20-21BH, SWSW 20-149N-95W, MCKENZIE CO., 2529 bopd, 1425 bwpd – BAKKEN
#28022 – QEP ENERGY COMPANY, MOBERG 2-20-21TH, SWSW 20-149N-95W, MCKENZIE CO., 2566 bopd, 1773 bwpd – BAKKEN
Must be a four well pad, all at the same spot. Look like decent wells to me.
Those were WELLS RELEASED FROM “TIGHT HOLE” STATUS. We have no idea what month they were completed. Could have been December for all we know. There were no PRODUCING WELL COMPLETED and none Thursday. There was one producing well completed Wednesday.
Mr. Patterson, those four wells were completed/tested in November, 2014.
The description of the wells includes “t11/14” denoting Nov. testing/measuring IP.
Thanks Coffeeguyzz, I had not noticed that.
What size per barrel are the water trucks that haul water from wells like these? How much does it cost to haul each load? Using our water truck would result in approximately 132 bobtail truck loads of water hauled and we would charge around $12,000 to haul that days water from those 4 wells, assuming disposal nearby and no waiting. That’s just $1.50 per barrel of oil, assuming 20% royalty. Of course, one would need many trucks, constantly hauling water, but also constantly hauling even more oil. Looks like good wells. Dennis has pointed out QEP is at the top, better than EOG even. Interesting they do not get the hype, I kind of like that.
Assume maybe they use tankers in Bakken, so maybe 41-43 tanker loads of water. Wonder what the going rate is?
Again, any links to Bakken and/or EFS lease operating statements would be interesting to me. In particular wells producing 5+ years.
Trucks!!
What size per barrel are the water trucks that haul water from wells like these? How much does it cost to haul each load? Using our water truck would result in approximately 132 bobtail truck loads of water hauled and we would charge around $12,000 to haul that days water from those 4 wells, assuming disposal nearby and no waiting. That’s just $1.50 per barrel of oil, assuming 20% royalty. Of course, one would need many trucks, constantly hauling water, but also constantly hauling even more oil. Looks like good wells. Dennis has pointed out QEP is at the top, better than EOG even. Interesting they do not get the hype, I kind of like that.
Assume maybe they use tankers in Bakken, so maybe 41-43 tanker loads of water. Wonder what the going rate is?
Again, any links to Bakken and/or EFS lease operating statements would be interesting to me. In particular wells producing 3+ years.
Notice, some posts in the last couple of days were sent to the “pending” file. I have no idea why but I have approved them all. None of them should have been in that file so I have no idea why that happened.
Ron
I have always thought the majority of work a blog owner has to do is frequent purging of advertising posts by robot commenters. Never occurred to me the blog software breaks now and then.
I googled lease operating statement Bakken, and came across a 2014 masters thesis prepared by a Turkish student at Michigan Tech. Skimmed it, very interesting. Will read fully tonight when can.
He came up with well head break even under four scenarios in a range of $66-$75.
A couple of points, however, I caught while skimming:
1. He utilized percentage depletion, and I do not think that is available past the first 1,000 barrels produced per day.
2. He utilized OPEX of a flat $10 per barrel. As I have discussed above, that will not be accurate. I think I can guarantee lifting will not be $10 flat for 5, 10 or 20 years.
3. Interesting to look at his oil price assumptions, which top out over $150 well head in year 20.
If you are into this kind of stuff, I highly recommend reading it. Then plug in your own numbers to his spread sheets.
An article for Watcher:
Top 12 Media Myths On Oil Prices
http://oilprice.com/Energy/Oil-Prices/Top-12-Media-Myths-On-Oil-Prices.html
About that article for Watcher,
He should have explained how the Euro is trade weighted against the dollar in the dollar index and why that matter to the price of oil instead of just saying if you want to trade oil trade Euro’s. Brent oil is still priced in dollars not Euro’s. Dollar index is made up of a basket of currencies which the Euro carries the second most weight next to the dollar itself. So the euro has the ability to move the dollar index more so than other currencies expect for the dollar of coarse. Since the dollar index consist of the USD, EUR, JPY, GBP, AUD, CHF,and CAD. It’s not always going to correlate with oil 100% The weight the EUR has against the dollar creates a good correlation between oil and the Euro (most of the time). A strong Euro tends to push the dollar down and oil up. A weak Euro tends to push the dollar up and oil down. It’s still dollar strength or weakness or Euro strength or weakness moving the dollar that’s moving the oil it’s just easier to follow just the euro or the EUR/USD in particular because there are more factors in the dollar index than just the dollar itself or the Euro.
I Should add if we get a Greek exit here the EUR/USD will drop like a rock but oil will stay steady or even go up. Correlations breakdown under the right circumstances.
We had euro weakness the run up to ECB QE and dollar strength the run up to interest rate hikes at the same time. The biggest reasons oil prices slumped as low as they did.
In a world with the unraveling of measurements unfolding it’s probably wise not to try to do linear measurements of how much this did what and therefore this should define how much something else did.
Meaning, in general, the yardstick of dollars per barrel doesn’t have to move linearly as the dollar changes some measurement we quote from the basket of currencies (because those other currencies are being gutted too by their central banks when measured against shrug hogbellies). Gail had a ZH article yesterday with a graph of wages as a percentage of a barrel. That has to fail too, but it edges towards understanding that we have no measurement constants.
I played with the aileron analogy, but it will fail too. If you are a pilot you understand that applying some small stick movement to the left will start the airplane rolling to the left. It doesn’t go to some degree of roll and stop there. It keeps going. The aileron deflection induces roll rate; it doesn’t define roll amount. Similarly a rising dollar (against . . . something) likely induces a rate of decline in oil. It doesn’t define a price level.
I agree supply and demand should define a price level. But when you get a 3500 point price swing in the EUR/USD. a lot more happens than just what you see on the screen. Thats a whole lot of unwinding an re-positioning going on not just in markets but the actual real economy.
“I Should add if we get a Greek exit here the EUR/USD will drop like a rock”
Or not. Maybe Europe happy that a weak player exited the Euro.
Oh it would drop. We would see dollar parity and below within a week.
Better than most, Jeffrey. Better than damn near all.
We will always take issue with fringe tidbits of things like this because all reporters are subjected to the same day to day crap we all are and it’s hard to throw that stuff off, but this guy gets a lot right.
Water wells drying up in California:
http://www.bloomberg.com/news/articles/2015-04-17/california-plagued-by-dry-wells-as-drought-makes-water-elusive
Antarctica just experienced its warmest day ever
Totalitaria: What If the Enemy is the State?
From population control to gun control, food regulations to clampdowns on natural health, Agenda 21 to climate change, mercury-filled lightbulbs to the Green Police, global treaties signed behind closed doors at the behest of unelected bureaucrats are rapidly locking in changes and a framework for the bureaucracy to effectively take global control.
With all due respect Caelan, that is the biggest crock of bullshit I have read in a very long time.
I personally worry about a lot of things.
The things that worry Caelan the most are not very close to the top of my list – but they are a hell of a long way from the bottom.
All that is necessary for any country to fall victim to the very worst sort of bad guys is a fairly long string of bad luck. Russia had the bad luck to fall to the commies, Germany the bad luck to fall to the nazis.
It could happen to us.
The bad guys would most likely be known by some new name but .. they wouldn’t be very different from the commies or the nazis in any respect that really matters.
Right now I would estimate the odds of the USA or any major western Europan company falling under the control of a totalitarian government as less than one tenth of a percent annually. That is pretty low — but not negligible.
With overshoot being a fact , things are going to get nasty in a lot of countries. Ten or twenty years from now the odds of some formerly reasonably free countries falling into the hands of totalitarians will be many many times higher. High enough that it is in my opinion a sure bet that it will happen in more than a few countries.
Human overshoot is about humans at some point killing each other to hold or gain vanishing resources. We don’t compete with other species anymore – not for the most part. We compete with each other.
If I were a young man with hungry kids I wouldn’t think twice about committing some mayhem in order to feed and shelter them as a near last resort. I would fight or steal before I would beg but I would be particular about WHO I would fight or steal from.
Bankers would be my first choice of victim, lol.
It wouldn’t have been hard to convince me to take up arms for my country if my country was hurting for food and oil and other countries appeared to have plenty.It has never been hard to convince bored hungry restless young men to fight. We were BORN to fight,if circumstances dictate.
PC idiots and biologists who refuse to recognize the evidence to the contrary have their heads up their butts so far they don’t have a prayer of ever seeing daylight.
WHAT WE HAVE BEEN DOING FOR A HUNDRED THOUSAND YEARS, A MILLION YEARS, IS NATURAL BEHAVIOR. Only a pc fool could possibly think otherwise.
AN EMPTY BELLY TRUMPS PRINCIPLES EVERY TIME.
I have no idea who said it first but this quote goes back a VERY long way.
The State enables all extraction and resource rules.
Of course, it is the problem.
(It does constrain the rape and scrape whores, but it is the final say on issues)
Look around.
How are things?
Yes, Ron, given the unread book’s title being suggestive of hypothetics, on second thought, it could be a little along the lines of what Alex Jones or the late Michael Ruppert might have hit on sometimes with regard to some apparent truths. I suppose it’s like anything, perhaps like the EIA/IEA/GDP/Employment/R2D2/etc. reports and figures. Myth and poetry.
Not that the State is not (an element of) the, or an, enemy, mind you.
It’s a battle between Citizens and the State…”
States are no longer relevant and nor are there any citizens!
Today, it’s all about corporate rights vs consumers’ lack of rights…
You want rights? Found a corporation! If you make it, even the nation states will bow down to you and you will have more consumers lining up to buy your products or services than you could possibly ever imagine.
On the other hand you could become a herder of cats >;-)
States are no longer relevant and nor are there any citizens!
Today, it’s all about corporate rights vs consumers’ lack of rights…
Yes, I’d say that is pretty much true. Multinational corporations are not loyal to any particular country.
On the other hand, Baffin Island is at minus 19 Celsius today and it has been minus 22 to minus 27 for several weeks.
How much fossil fuels have we ‘blown up’ since 1800? What kind of an explosion is that in relative geological terms, and will it have any effect? If so, what kind?
There will be no thermal effect of this burning of fossil carbon, if you are worried about that. It is not like it is piled up in one big pile and mixed up with some chemical compound oversaturated with oxygen and then ignited.
And the thermal radiation from all that will simply radiate out in space. It is totally outshined by the incoming radiation from the sun.
What DOES matter is the way all that CO2 traps infrared radiation on its way out. That will warm up this planet. 2014 was the warmest recorded, and 2015 is suspected to break that record. March this year is the warmest global March ever. And so it goes on. It will steadily get warmer.
California can blame California for its water woes.
Republicans Are Saying Environmentalists Caused California’s Drought. Here’s Why They’re Wrong
http://thinkprogress.org/climate/2015/04/09/3643879/the-backwards-way-of-approaching-californias-drought/
Jay Famiglietti, the senior water scientist at the NASA Jet Propulsion Laboratory at the California Institute of Technology, also invoked harsh terms in response to Fiorina’s statements.
“There is zero truth to any argument that attempts to characterize the current California drought as man-made,” he told ThinkProgress via email. “All you need to do is look at up the mountains and realize that there is no snow, look at the reservoirs and see that they are nearly empty, and look at last January to see that it was the driest on record. A lack of infrastructure is not the issue when there is nothing to put in it.”
According to Famiglietti, suggesting that allocating water for environmental flows is a waste shows a lack of appreciation for the many benefits of these flows.
“Stemming environmental flows could do irreparable damage to the ecosystems that sustain us, and would be counterproductive at best,” he said. For instance, if not enough water flows into the California Delta, salt water from San Francisco Bay could intrude further into it, making it more saline and lowering the quality of the water used for drinking and agricultural purposes.
I was just talking to my wife about this and she sarcastically stated, “Yes, but he is from NASA, and that is the government.” Sigh, unfortunately her sarcastic take is all too real. I am sure that many people out there that will dismiss what a scientist at NASA says simply because she/he is from a government agency.
You’re probably right, but only because the government is just so incompetent in almost everything it touches that it is just so easy to be skeptical of any bit of “insight” government agencies come up with. Especially related to things that humans have next to no control over, like the weather. Take NOAA and the Nat’l Hurricane Center…at the beginning of the man made Human caused global warming research, it was widely written that this would cause more and more powerful Hurricanes (and use up all the names around the world). Due to constant changes in executive leadership (the President), this was a great way for the relatively small organization to get money…all you had to do was have more Hurricanes and all the taxpayer funding you wanted would be yours.
So, first things first, they raise the height they measured winds…resulting in higher winds and more Hurricanes, check.
They had picked the end of one of the natural hurricane cycles to do this, so while we were seeing less (normal variation), they were starting to report more..and conflict at the start is not a way to get more money. Plus the Coast Guard that ran the flights was starting to complain about going on all these worthless flights.
So, some very skilled political work (including some contributions to the right people) and congress moved all the planes away from Coast Guard. As storms got fewer and less strong, they went farther and farther afield…amazingly all the way to the Saharan coast of Africa so that they could observe storms that lived for only a day or two, or storms that turned right and never even came anywhere near land or threatened humans.
When congress eventually questioned them about this, they simply said that with all the global warming, they needed to understand these storms better, as soon all these giant storms would be hitting us too.
But something is wrong, the normal cycle has been broken, and instead of the hoped for global warming massive increase in hurricanes…the reality has been fewer and weaker storms.
Today, you will not hear much about all the predictions of the past…but they have managed to grow from a $14 million a year business to now over $400 million a year business…all because so many people jumped on the Man made global warming issue.
They still predict more storms each year hoping that it will be true. And as they are counting storms no one even knew existed 100 years ago, it still looks like it has gotten much worse.
So, in the end would someone lie to get 400 million dollars a year? I think so.
In a world where one get rewarded by the political elites for showing global warming, and money and jobs taken away for not…well how can really expect anyone to tell the truth?
Anyway, is the CO2 higher in the atmosphere?…absolutely, we know roughly what we are dumping into the atmosphere…we have lots of measuring spots around the world, run by lots of people…and the two usually reasonably match.
Does CO2 make the earth warmer?…I think so.
Is high CO2, at the current time, a bad idea?…I believe so, yes.
But we have to realize our globe is also affected by a bunch of different things, not just CO2. It seems, over the last 17 years (discounting data that can be easily proven fake like the latest NOA reports..,also driven by money) we have been getting cooler here in the Northeast. I don’t believe we know why this is happening, or if it will stop…or reverse or go crazy in one direction or the other.
But money and science are very bad bedfellows…and obviously once you start lying, stopping can be impossible.
Additional stuff to consider: We know that the earth was warmer just 3,000 ago…even though CO2 was at an ultra low then. This does not mean that it does not effect humans alive then…it just means it was warmer and people lived through it by having faith in God and adapting. If the bad warming starts up again that is just what we are going to have to do again.
Song: America – A Horse With No Name+Lyrics
http://goo.gl/YyHkeO
After two days in the desert sun
My skin began to turn red
After three days in the desert fun
I was looking at a river bed
And the story it told of a river that flowed
Made me sad to think it was dead
Although maybe the lyrics are kind of about energy? Obviously we will be using horses soon and not all of us with have the time or inclination to name them.
In any case, we could probably get away with it, right Ron?, if it was somehow unobtrusively-camouflaged within the comment, such as with a hypertext link as one of the words, or as a message embedded within a carefully-crafted comment, using the strong html tag…
(‘Non-energy trivia becomes necessary trivia that people have to find.’ ~ Caelan Patterson)
K
http://finance.yahoo.com/news/russia-hasnt-reached-deal-3-145340961.html
MOSCOW/BERLIN (Reuters) – Russia denied on Saturday a German media report suggesting that it could sign a gas pipeline deal with Greece as early as Tuesday which could bring up to five billion euros into Athens’ depleted state coffers.
. . .
“Naturally the question of energy cooperation was raised. Naturally … it was agreed that at the expert level there would be a working-out of all issues connected with cooperation in the energy sphere, but Russia did not promise financial help because no one asked for it,” Peskov was quoted as saying.
During his visit to Moscow, Tsipras had expressed interest in participating in a pipeline that would bring Russian gas to Europe via Turkey and Greece.
Recap for the unwashed:
Russia wants to route nat gas to southern Europe without the constant theft out of the pipeline that traverses Ukraine. There are several billion dollars of transit fees paid to Ukraine for this, but even that is not enough for them to pay their own gas bills. So they just steal the gas.
Russia planned to route a pipeline along the bottom of the Black Sea south of Ukraine, arriving in Bulgaria through which they would build a pipeline west and north to the rest of Europe. The EU, apparently prodded by the US who wants to deliver LNG to Europe — errr, prevent excessive Russian dependence, stepped in with EU regulations saying pipelines in EU countries (Bulgaria is one since 2007) cannot be built/owned by the owner of the pipeline contents. haha. Okay, anyway the hammer was put on Bulgaria by the ECB, threatening to shut off their bank liquidity and that was that. Bulgaria changed their minds and decided they would not like those transit fees after all. Note that US LNG cannot arrive in Europe for less than about 2X the Russian pipelined natgas price.
And so Russia/Gazprom decided that a viable approach is to route through the pipeline network already in place (and to be expanded) in Turkey to its border with Greece. Then a short (transit fee paying) traverse through northeast Greece and into Macedonia or Albania, north to the other Balkans, and then into the EU itself, bypassing Ukraine and shutting off their transit fee. There is non Russian gas in the Turkish pipeline too so it will be difficult for the EU to apply pressure to stop all this.
Ukraine, of course, would be bankrupted into submission, unless the ECB wants to print more Euros to pay their gas bill. (moving up the day when Russia won’t take pieces of paper for things of actual value).
Why any oil exporter would except pieces of paper at this point in the game only makes sense if they need those pieces of paper to service debt denominated in whatever given currency those pieces of paper are. Or in the case of Saudi Arabia they need to continue accepting paper in exchange for US military support.
If i where Russia i’d except food, gold, silver anything other than paper or electronic currency as payment. Only problem i see would be in a world of fiat money where everyone wants and cheaper currency than their trade partners Russia would be on the losing end, Their exports, mainly oil would become less competitive with other oil exporting countries . There are pluses and negatives to the idea of not excepting paper. Russia does have one thing going for them they got the oil and gas Europe and China needs and that supply can’t be totally replaced elsewhere.
I could see Russia excepting chinese yuan as payment but not euro’s or dollars. That would make things interesting.
As peak oil progresses i think the US will be ok for awhile. We got Canada and they have oil and they have the uranium to keep our power plants going for awhile. Europe, Asia and Eurasia is where i expect conflict over oil to breakout first. Japan and Europe will face fuel shortages first. Only question is how they will respond. Will they go to War with their neighbors? Probably so.
Europe will probably splinter and go to war with each other as it would be easier to do than trying to go to war with Russia or China in order to secure fuel supplies.
Could this explain the unexpected decline in McKenzie and Mountrail reported by ND DMR – sharp increase in the number of confidential wells?
No, this doesn’t really mean anything other than give the estimated production from wells that are still listed as confidential. After five months, (from the last month reported, or six months from the time they went on the list), there are no confidential wells. That’s why September has a zero oil from confidential wells. Wells that went on line in September, that were then listed as confidential, have now all been removed from the confidential list.
There was really no increase in confidential wells that can be gleaned from this report. Some come off the confidential list every month until after five months they are all off.
Are the confidential wells included in County totals for Dec to feb?
Yes, the county totals on this page do not include production from confidential wells:
ND Historical Barrels of Oil Produced by County
But page 2 of this document gives the production of each county that does include confidential wells.
OIL AND GAS PRODUCTION REPORT
Of course to get the data for all five months that include confidential wells I have to collect data from previous editions of this document.
Thanks Ron,
My point was that, if most of the estimated production from confidential wells comes from these two counties, then the drop in their January and February output should be smaller.
But my point was all the data I posted included all output from confidential wells. The NDIC totals from here: ND Monthly Oil Production Statistics does include output from confidential wells. Also the county data I posted also includes confidential wells.
The data published by the NDIC is extremely accurate. Of course it is revised every month but the revisions are usually very tiny, usually way less than one half of one percent. So there is just no doubt that the declines in January and February are what the NDIC reported, or very nearly so.
From the above table there’s just over a million wells in ND and the ND production is just over 1 million barrels/day. So the average production per well is then 1 barrel/day. This doesn’t sound right?
You are right. That number should be labeled: “North Dakota Barrels per Day”, not North Dakota Wells.
….. ????? Speechless ….
Texas February and previous months revisions are out. Time for the debate to begin again.
Alex S as Ron points out: NO!
The NDIC reports TOTAL production from ALL producing wells by counties and by month (Ron linked to the report, look at page 2). What this report does not do is include revisions that are beyond the closest month. That is why there is a discrepancy between the table you embedded (which is revised and may be revised again, but do not expect big revisions) and the data from page 2 of the linked report.
Note the revisions works both ways, up for Sep-14, up for Oct-14, down for Nov-14…..and the revisions are normally a few hundred bbl/d.
Data below from page 2 of the NDIC wells detailed report, Ron’s link
Sep-14: 1,186,228 b/d
Oct-14: 1,183,515 b/d
Nov-14: 1,188,258 b/d
Dec-14: 1,227,483 b/d
Jan-15: 1,191,198 b/d
Feb-15: 1,177,094 b/d
The reason is that production from all wells on confidential list are taxed and subject to royalty payments (that is the oil from wells on the confidential list that is sold (listed as runs)!).
What NDIC do not publish is the production data for the individual wells that are on the confidential list. These become public available as wells come off the confidential list.
Through the years I have found NDIC reported volumes to be extremely accurate, the revisions has typically been 0.1 % (+/-). And there are likely several reasons for later revisions, one being oil water separation, which takes time, and metering of the oil separated out.
Chart below shows all production from the 4 biggest counties as per Feb-15
Rune, I think this format is more visible
Hey, thanks. I looked earlier in the day Saturday and it was not there. I never thought they would post it on the weekend. I will definitely have a post out on this later today.
No problem. I know about the TX slow reporting issues, but it looks to be TX is possibly following the same path as ND, more or less flat in the fall, a blip up in December, and down in 1/15 and 2/15.
Seems that would make EIA estimates, especially for January, high.
The numbers you see are for February, a 28 day month. You have to divide the data by 28 to get the barrels per day. And at a quick glance I can tell you the February numbers are above the January numbers but still below the December numbers.
That is correct re 28 day month. It looks like Feb may be down from January, on barrels per day, C + C, to a lesser extent than the drop from December to January., which is similar to ND. But hard to know as all numbers less than 2 years old adjust upward each month. I’ll await your post. Thanks!
I live in Texas and file 65 production reports to the Texas RRC every month in Texas. The TRRC is not slow. It does not adjust its production upwards for 2 years in meaningful volumes that should make any difference to anyone, not even the peak oil community. The EIA does not know what goes on with regards to Texas oil and natural gas production before the TRRC does. I have been through that to no avail, it seems; I promise I won’t get involved in this stupid debate again.
I stand corrected regarding Texas February production; I thought it would have declined at incrementally higher rates that January, regardless of the short month. Mox nix, rig counts are tumbling, good men and women are losing their jobs by the thousands, oil production in Texas is going down, down, down.
Shallow, I have LOE statements for EF shale wells in Texas; they would not be helpful to you, or anyone else, as lease operating expenses and general administrative and overhead allocations are all over the map. Different strokes for different folks; I have seen monthly overhead charges range from 10K per well to 2K per well, from one pasture to another. In Texas I might operate a lease than has 189 BOPD of production from 15 wells. Two of those 15 wells might make 4 times the daily production the other 13 do; total expenses however cover the entire lease and seldom do I break costs down to an incremental per barrel cost per well. In Texas we report lease production, not individual well production and expenses apply to the entire lease. The shale business is the same. Produced water disposal costs are also all over the map. Big shale companies with high well density in a sweet spot will have their own disposal and re-injection systems. Another company down the road 2 miles with the same well count will be trucking their water to a commercial disposal system. My estimates for those produced water costs are between 4-5 dollars a barrel if it has to be trucked and 1.50 for internal disposal and injection systems. What portion is which, I have no idea.
The royalty deductions some people us around here are not correct either. Lots of people get their grubby fingers in the pie with overriding royalty burdens, reversionary WI back-ins, etc. I would say on the whole the WI is burdened by 0.22-0.23 RI these days, everywhere. Even in ND.
It is impossible to make generalizations about costs, or “break even” oil prices within a resource play like the Bakken or Eagle Ford. There are too many variables. Too many extenuating circumstances. It cannot be done with any meaningful degree of accuracy.
Mr. Patterson, please: when folks imply production in ND does not include “confidential wells,” you must please explain that to me. How does a mineral owner in ND know if it is being paid correctly, or how does ND get it’s taxes, if production is not “reported” for confidentiality reasons. That astounds me. It is actually reported in the form of “runs,” isn’t it? Oil cannot be sold if it is not produced. There is not sufficient storage on a well location for the difference in sales and runs to be of any consequence in the overall big picture, IMO. Thank you.
Mike
Mike, I have explained to folks over and over that the NDIC production numbers do include confidential wells.
Of course the RRC does not adjust production numbers up, it reports all the numbers it has. The problem is it, apparently, does not have all the numbers because the monthly data does increase every month. I have no idea why this is, I just assumed it was because the drillers or oil companies do not report the data on time. Perhaps this is not correct. But if the RRC does have the data then why don’t they publish it.
I am not blaming the RRC for this, all I am saying is the data is incomplete. I just don’t know how else to put it.
Nevertheless this problem demands an explanation. I don’t have one. If you do then please explain it to me and I will publish that explanation with every Texas RRC post.
I am very aware that the EIA gets all its information from the Texas RRC and other states data from other states. I have explained that on this blog many times. The EIA data cannot be better than the state data though when they don’t have all the data they do take a wild ass guess as to what the production may be.
Ron, you have explained NDIC confidential well production many times; I don’t understand why the question keeps coming up. You answered my question, thank you.
I have tried to explain how the reporting process works in Texas and that real barrels equal real money. I know that once oil is sold and taken off a lease in Texas the production, (accounting) must be reported. If there are delays in reporting it can’t be more than a few months.
I sound like I am defending the TRRC, I am not. I understand why incomplete data is frustrating to you and others. In the long run it works itself out. The pisser to me was the argument regarding the EIA’s data being better than the TRRC’s, more accurate, and I don’t need to go there anymore. I wish I had an answer for you; I’ll try and get one.
Thank you for answering my question. I always try and answer yours when I can.
Mike
Mike – hope things are going well for you – to quickly display what you and Mr. Patterson are discussing re confidential well output being promptly, publicly available, one can go to ND DMR website, click ‘confidential well list’, scroll down to desired target well (I chose Newfield’s Sand Creek Federal as this well name incorporated the field name also. If the field name is unknown, one needs to scroll through 250 pages or so of data as that report is categorized alphabetically by field name). This particular well is on page #175.
Glancing at the runs column and the gas sold column gives a precise amount of the month’s production of this confidential well.
(Just below Newfield’s are a bunch of nearby Whiting confidential wells).
Thanks, Coffee; they are, by about 10 dollars. And I hope well with you.
Thanks for the info.
Mike
Hi Ron,
For total North Dakota data confidential wells are included, but for the monthly totals by county, confidential wells are not included, it is right on the report.
https://www.dmr.nd.gov/oilgas/stats/countymot.pdf
Is that the report you used for your monthly chart?
EDIT, no it is not.
Ron uses a different monthly report that includes confidential wells, as he said up the thread.
There were a lot of wells down for maintenance in McKenzie in Feb, only 4 more wells were producing than the previous month even though 38 new wells were added. In Mountrail there were also only 4 more wells producing in Feb than Jan. although 25 new wells were added in Feb for Mountrail county.