A Guest Post by George Kaplan
EIA reserve estimates for USA for 2016 have been issued (a couple of months later than usual). The numbers they provide are ‘proven’ reserves of crude, condensate and natural gas.
The data is provided directly by the E&Ps with some adjustments made by EIA for missing numbers. The data show reserves for the end of a given year, plus the reasons for change over the year: basically discoveries, production, revisions and sales. Until 2015 EIA had different categories for discovery (essentially a new reservoir, although there may be new pockets in existing freservoir) and extension (an increase in the area of an existing field). Recently most of this category has been extensions to LTO fields (i.e. an increase in the expected economic drainage area of a play). This year the reporting has changed so all discoveries and extensions are reported as a single figure and I’ve shown only this sum for previous years too. I have summed revision gains and losses plus adjustments to give a net number, and similarly for sales and acquisitions.
This year the data include non-producing reserves. I don’t know for sure if this is new but I haven’t noticed it before and can’t find any history for previous years. ‘Non-producing’ may mean reserves behind wells that are offline (e.g. are uncompleted, for maintenance or because of lack of processing or transport capacity); or that have real development plans for their production (typically starting within the next five years according to SEC rules, although for large, long cycle conventional projects the time can be extended). The undeveloped values for 2016 are shown on each chart.
‘Probable’ reserves are not included but I think this contribution might now be a relatively small proportion overall. The conventional oil reserves are in mature fields and these tend to have decreasing proportion of probable as they age – see below for the GoM, where BOEM 2P numbers are actually lower than EIA 1P estimates. For LTO there are few new fields each year and production growth comes from incremental development of known fields. In theory the expected recovery should be fairly well known but there are some really large revisions both up and down each year, which might indicate the E&Ps don’t have much idea, so setting reserves as proven versus probable maybe isn’t very meaningful.
The discussion here covers mostly crude for the USA, the GoM and the main tight oil plays, plus some look at natural gas overall and in the GoM. For some of the shale plays I have made some high level guesses about future well numbers, which I’ve based on figures from Enno Peter’s excellent shaleprofile blog.
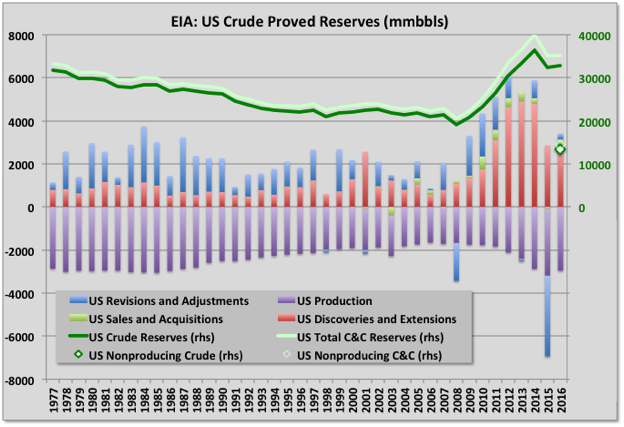
USA Total Oil
Total proven oil reserves for US in 2016 rose slightly: production was about equal to discoveries and extensions plus small net increases from acquisitions and revisions (see chart above). Although the overall net revision was small both the total increases and decreases exceeded 5 Gb, which is high relative to total reserves, for decreases this is the second highest number after last year and is likely to be a reflection of the uncertainties associated with tight oil plays as there is no history for any being run through a full life cycle. In fact the two revision numbers were almost equal and the change came from ‘adjustments’, which is a catch-all category used to make the numbers balance and might well just be a rounding error. The average price of oil fell in 2016 compared to 2015, which likely had an impact on some marginal areas.
Discoveries and extensions were about equal to 2015 and well down on 2013, which looks like the peak of a bell curve for tight oil growth that started in 2005. If so then it should drop down now through 2021, although possibly extended a year or so because the price crash in 2015 looks to have had a significant effect.
I have shown condensate for total reserves, though not the yearly adjustments, which for some reason EIA don’t give in the same format, by region, as they do for crude (neither do they do it for natural gas or NGL). Condensate reserves have been growing significantly because of shale gas but fell slightly this year.
Global conventional oil discoveries dropped to a new record low in 2015 and again in 2016. Combined with the USA tight oil numbers the drop is even more pronounced. Conventional oil saw another small drop in 2017 and that looks the most likely course for tight oil too, given the recent trend.
Non-producing reserves are shown as the green diamond and are just over a third of the total, and this a common proportion across different plays and for oil or gas. For conventional plays these would usually represent non-developed fields, but for tight oil are mostly non-drilled areas or non-completed wells in known and partially developed fields.
Crude production fell in 2016 but picked up again in 2017, which will be reflected in this years release that is due again in November.
Read More