A Guest Post by George Kaplan
Part I Discoveries and Reserves
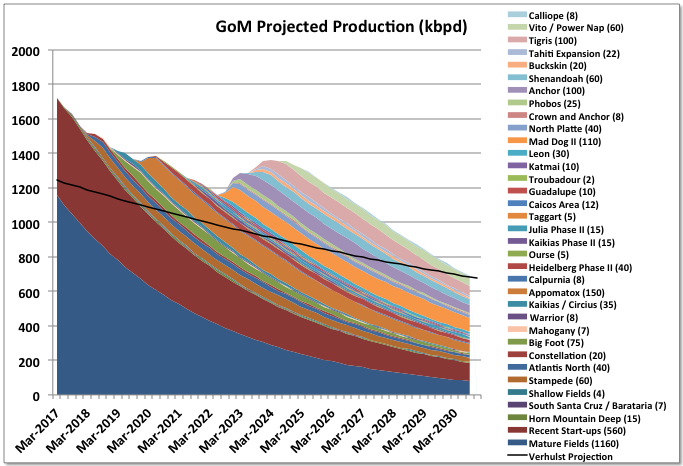
The following are a few charts and observations concerning the US Gulf of Mexico production, with data mostly taken from BOEM for the OCS and a bit from EIA. The BOEM data site has been updated and makes it easy to get the raw data, but not in a very easily discerned way. This post is intended to make it a bit easier to follow and come to your own conclusions concerning the likely future of GoM production.
I’m sure I’ve made a few mistakes in getting and downloading the data, but the relative trends are probably more informative than absolute values so there will need to be follow up revisions as new data is available and hopefully any issues will get smoothed out. Reserve data is available for 2015. New data for 2016 is likely not available until the end of the year, but when it is it will be interesting to see what changes there are. The main focus here is on oil but gas data is also presented. Production data is issued twice monthly but some, such as for BP, is up to six months late so I’ve just assumed daily flow stays constant to fill in any gaps. Read More