What is Reserve Growth?
BP: In general, a portion of a field’s probable and possible reserves tend to get converted into proved reserves over time as operating history reduces the uncertainty around remaining recoverable reserves: an aspect of the phenomenon referred to as ‘reserves growth’.
Wiki: Experience shows that initial estimates of the size of newly discovered oil fields are usually too low. As years pass, successive estimates of the ultimate recovery of fields tend to increase. The term reserve growth refers to the typical increases in estimated ultimate recovery that occur as oil fields are developed and produced.
Basically the U.S. Security and Exchange Commission have stringent reserve booking requirements for oil companies. As a result early booked reserves of any given field is very conservative. Also, any company would much rather have reserves too low and increase them later than have them too high and have to decrease them later.
But would this not mean that fields of national oil companies, and especially fields that were discovered and developed in the Former Soviet Union have different reserve growth rates than fields developed by publically traded oil firms. The answer is yes and the USGS admits that is exactly the case.
In this publication, Reserve Growth in Oil Fields of West Siberian Basin, Russia, the USGS tells us all we need to know about Reserve growth in West Siberia.
ABSTRACT
Although reserve (or field) growth has proven to be an important factor contributing to new reserves in mature petroleum basins, it is still a poorly understood phenomenon. Although several papers have been published on the reserve growth in the U.S. fields, only limited studies are available on other petroleum provinces. This study explores the reserve growth in the 42 largest West Siberian oil fields that contain about 55 percent of the basin’s total oil reserves.
The West Siberian oil fields show a 13-fold reserve growth 20 years after the discovery year and only about a 2-fold growth after the first production year. This difference in growth is attributed to extensive exploration and field delineation activities between discovery and the first production year. Because of uncertainty in the length of evaluation time and in reported reserves during this initial period, reserve growth based on the first production year is more reliable for model development. However, reserve growth models based both on discovery year and first production year show rapid growth in the first few years and slower growth in the following years. In contrast, the reserve growth patterns for the conterminous United States and offshore Gulf of Mexico show a steady reserve increase throughout the productive lives of the fields. The different reserve booking requirements and the lack of capital investment for improved reservoir management and production technologies in West Siberian fields relative to U.S. fields are the probable causes for the difference in the growth patterns.
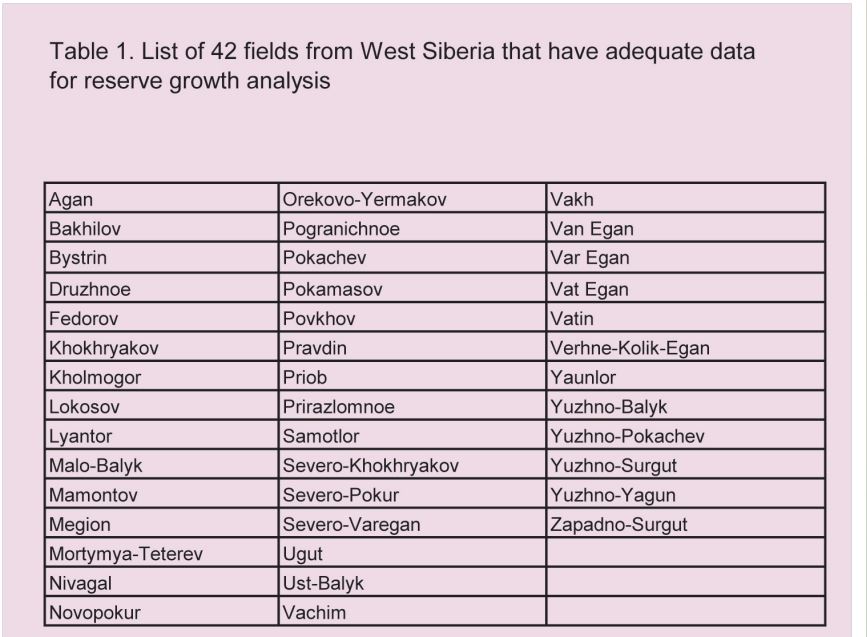
Four of the five largest fields in Russia are located here in West Siberia, Samotlor, Priob, Lyantor and Fedorov. 61% of Russian production currently comes from Western Siberia. Russia’s second largest field, Romashkino, discovered in 1948, is located in the Volga-Ural Basin and is also in serious decline.
Read More