Bakken Data plus The EIA versus The EIA

The NDIC has just published the latest oil production data from the Bakken.
Monthly Oil Production Bakken Only
Monthly Oil Production All North Dakota

Bakken & ND Prod

Bakken production dropped by 34,619 barrels per day while all North Dakota oil production fell by 36,927 barrels per day.

Bakken & ND BPD per Well

Bakken barrels per day per well fell by 5 to 125 while all North Dakota barrels per day per well fell by 3 to 101.

Bakken Wells Producing increased by 107 to 9,052 while all North Dakota Wells Producing increased by only 49 to 11,796.

Read More

The Oil Shock Model with Dispersive Discovery- Simplified


This is a guest post by Dennis Coyne

Originally posted at peak oil climate and sustainability

Some changes have been made to this post see after the Excel File link.  Below figure 10.

The Oil Shock Model was first developed by Webhubbletelescope and is explained in detail in The Oil Conundrum. (Note that this free book takes a while to download as it is over 700 pages long.) The Oil Shock Model with Dispersive Discovery is covered in the first half of the book. I have made a few simplifications to the original model in an attempt to make it easier to understand.

shockmodfig/

Figure 1

In a previous post I explained convolution and its use in modelling oil output in the Bakken/Three Forks and Eagle Ford LTO (light tight oil) fields. Briefly, an average hyperbolic well profile (monthly oil output) is combined with the number of new wells completed each month by means of convolution to find a model of LTO output.

Read More

World Rig Counts Declining

The weekly Baker Hughes Rig Count for North America and the International monthly rig count is out. In the charts below the monthly data is through February 2015 and the weekly data is as of March 6th.

World Rig Count

World Rig Count, counting oil, gas and miscellaneous rigs are down 684 rigs over the last three months. The annual spikes you here are caused by Canada.

World Rig Count Less Canada

Removing the seasonal Canadian spikes gives you a better picture of what is happening to the world rig count.

Read More

US Rig Count by Location

Baker Hughes publishes a weekly oil and gas rig count by producing basin. I have created charts of all the most productive basins in order that we can see where oil and gas rigs are increasing or decreasing. Their historic rig count, by basin, goes back 4 years.

It needs to be noted that Baker Hugs does not count rigs that are not actively drilling. Rigs that are “Moving In, Rigging Up” are not counted in the Baker Hughes count though they are counted by some others including the North Dakota Industrial Commission.

All rig counts are of Friday, February 27, 2015.

Rig Count Total USBut first, total US weekly rig count. The oil rig count stands at 986, down 623 from a high of 1,609 in October. The gas rig count stands at 280, down 656 rigs from the high of 935 in October of 2011. However this data base goes back only 4 years. The all time high for gas rigs was 1,606 in September of 2008. The 1,609 oil rig count in October 2014 was an all time high for oil rigs. That record is valid only back to the days when Baker Hughes began separate stats for oil and gas rigs however.

Rig Count Eagle Ford

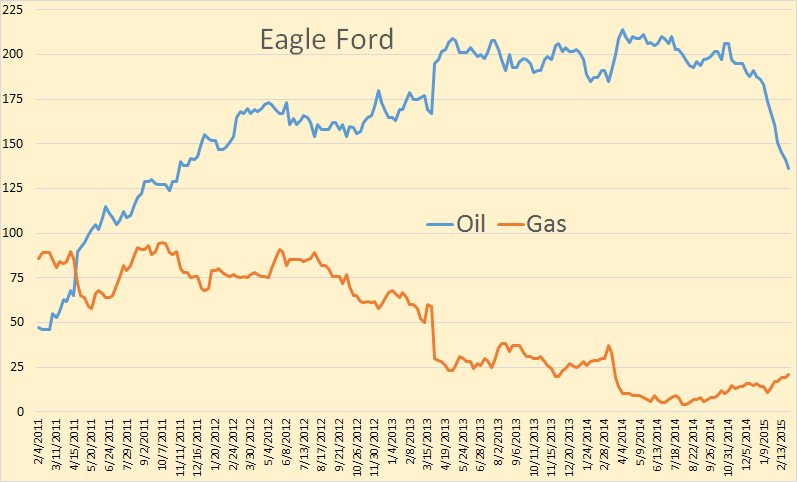
Eagle Ford oil rigs currently stand at 136, down from a high 214 in April 2014. Gas rig count is 21, down from 95 in October 2011.

Read More