Bakken and North Dakota Production Report

The North Dakota Industrial Commission just published their Bakken Monthly Oil Production Statistics and also their ND Monthly Oil Production Statistics.

Bakken Barrels Per Day 2

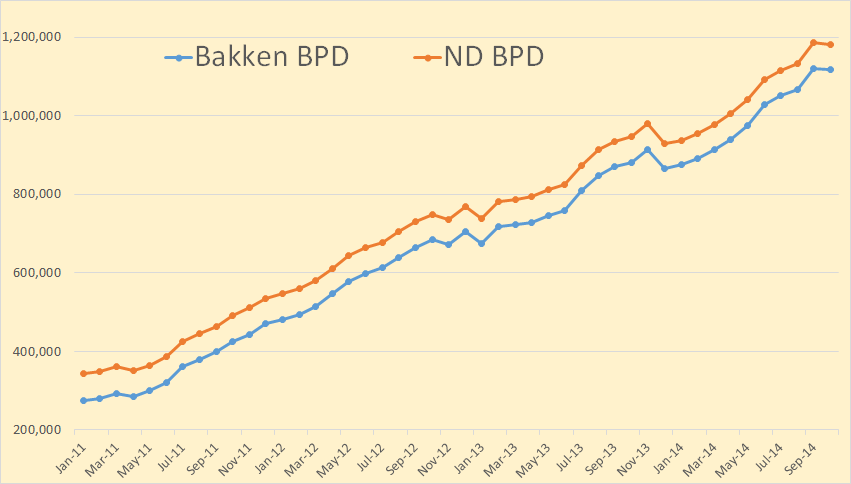
Bakken production was down 1,598 barrels per day to 1,118,010 bpd. All North Dakota production was down 4,054 bpd to 1,182,174 bpd.

From the Director’s Cut, bold mine:

The drilling rig count dropped 2 from September to October, an additional 3 from October to November, and has since fallen 5 more from November to today. The number of well completions decreased from 193(final) in September to 134(preliminary) in October. Three significant forces are driving the slow-down: oil price, flaring reduction, and oil conditioning. Several operators have reported postponing completion work to achieve the NDIC gas capture goals. There were no major precipitation events, but there were 9 days with wind speeds in excess of 35 mph (too high for completion work).

The drillers outpaced completion crews in October. At the end of October there were about 650 wells waiting on completion services, an increase of 40.

Crude oil take away capacity is expected to remain adequate as long as rail deliveries to coastal refineries keep growing.

Rig count in the Williston Basin is set to fall rapidly during the first quarter of 2015. Utilization rate for rigs capable of 20,000+ feet is currently about 90%, and for shallow well rigs (7,000 feet or less) about 60%.

Sep rig count 193
Oct rig count 191
Nov rig count 188
Today’s rig count is 183

Sep Sweet Crude Price = $74.85/barrel
Oct Sweet Crude Price = $68.94/barrel
Nov Sweet Crude Price = $60.61/barrel
Today Sweet Crude Price = $41.75/barrel (lowest since March 2009)

I just checked Rig Count. It now stands at 181 but one of them is drilling a salt water disposal well. So they have 180 rigs drilling for oil right now.

Bakken Wells Producing

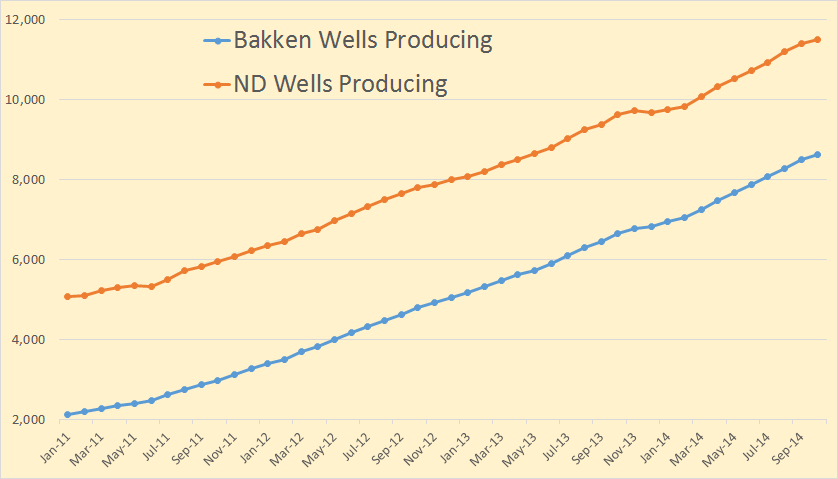
Bakken wells producing increased by 118 to 8,602 while North Dakota wells producing increased by 92 to 11,507. Since Bakken wells are included in the North Dakota count this means at least 26 wells outside the Bakken had to be shut down.
Read More

OPEC November Crude Production Numbers

OPEC just published its December Monthly Oil Market Report with their crude only production numbers for November.

OPEC Change

Total OPEC crude only production was down 390,000 barrels per day but that was after October production was revised up by 190,000 bpd. After revisions only Iraq and Nigeria showed any increase in November.

The data for all charts below is in thousand barrels per day and is through November 2014.

OPEC 12

OPEC crude only production stands at 30,053,000 barrels per day.

Read More

The EIA’s World Oil Production Numbers

The EIA has recently published their International Energy Statistics. Their stats include all liquids such as NGLs, biofuels and even refinery process gain. But I only track actual oil. The EIA does not track “Crude Only” so we are forced to track what they do track which is Crude + Condensate.

The EIA is about four months behind with their world petroleum data. All data in this report has data through August, 2014 and is in thousand barrels per day.

World

World C+C production was down 124,000 barrels per day in August. But according to the IEA it will be up considerably more in September.

Non-OPEC

Non OPEC production shot up in November, 2013 but has made no progress since. Though US production has continued to climb, declines in the rest of the world have kept it from increasing.
Read More

World Proved Oil Reserves, Fact or Fiction

The EIA publishes Annually a list of World Proved Reserves of Crude Oil. Though all charts in this post use the EIA data, BP, the IEA and virtually every other reporting agency in the world uses basically the same data. It is my contention that this data is misleading and totally meaningless. This is especially true of OPEC Middle East Reserves. However because this data is taken as gospel by the media and perhaps 90% of energy analysts in the world, this misinformation becomes a serious problem.

But first let’s look at the data. It dates to 2014 in most cases but some data only goes to 2013. All data is billion barrels of reserves.

EIA World Proved Reserves The EIA said we had 1,646 billion barrels of proved reserves in 2013. Other agencies put that figure a bit higher but we will go with this. And just where are these reserves located?

World Oil Reserves by Reigon

Almost half of the world’s proved reserves are supposed to be located in the Middle East. Actually it would be well over 60% if it were not for the recent additions to world reserves by the Venezuela Bitumen and the Canadian Tar sands.

Read More