This is a guest post by Rune Likvern. His web site is:
Growth in Global Total Debt sustained a High Oil Price and delayed the Bakken “Red Queen”
The saying is that hindsight (always) provides 20/20 vision.
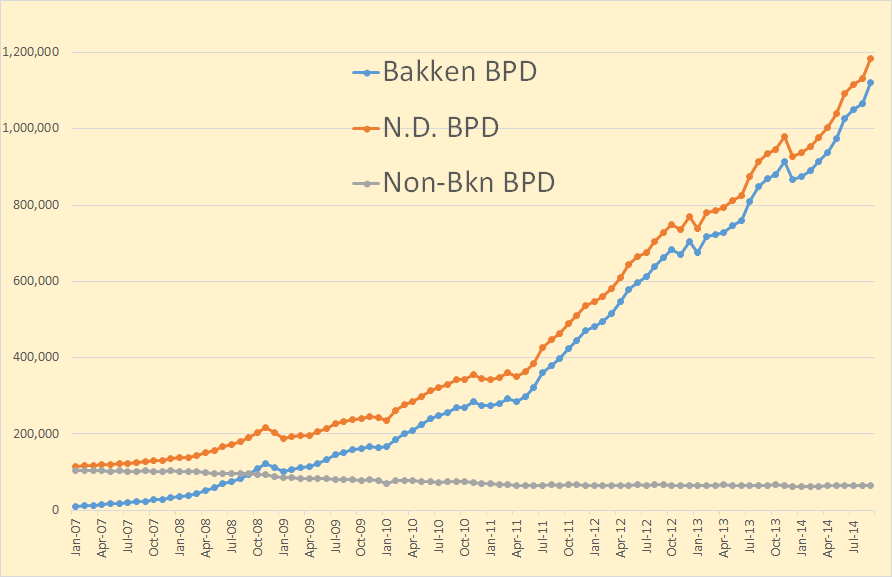
In this post I present a retrospective look at my prediction from 2012 published on The Oil Drum (The “Red Queen” series) where I predicted that Light Tight Oil (LTO) extraction from Bakken in North Dakota would not move much above 0.7 Mb/d.
- Profitable drilling in Bakken for LTO extraction has been, is and will continue to be dependent on an oil price above a certain threshold, now about $68/Bbl at the wellhead (or around $80/Bbl [WTI]) on a point forward basis.
(The profitability threshold depends on the individual well’s productivity and companies’ return requirements.)
- Complete analysis of developments to LTO extraction should encompass the resilience of the oil companies’ balance sheets and their return requirements.
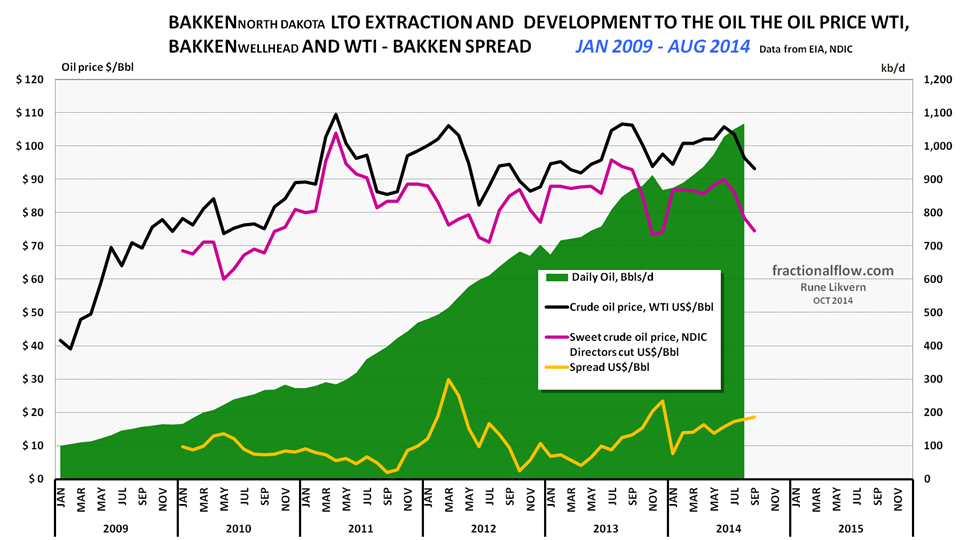
Figure 01: The chart above shows development in Light Tight Oil (LTO) extraction from January 2009 and as of August 2014 in Bakken North Dakota [green area, right hand scale]. The top black line is the price of Western Texas Intermediate (WTI), red middle line the Bakken LTO price (sweet) as published by the Director for NDIC and bottom orange line the spread between WTI and Bakken LTO wellhead all left hand scale. The spread between WTI and Bakken wellhead has widened in the recent months.
What makes extraction from source rock in Bakken attractive (as in profitable) is/was the high oil price and cheap debt (low interest rates). The Bakken formation has been known for decades and fracking is not a new technology, though it has seen and is likely to see lots of improvements.
LTO extraction in Bakken (and in other plays like Eagle Ford) happened due to a higher oil price as it involves the deployment of expensive technologies which again is at the mercy of:
- Consumers affordability, that is their ability to continue to pay for more expensive oil
- Changes in global total debt levels (credit expansion), like the recent years rapid credit expansion in emerging economies, primarily China.
- Central banks’ policies, like the recent years’ expansions of their balance sheets and low interest rate policies
- Credit/debt is a vehicle for consumers to pay (create demand) for a product/service
- Credit/debt is also used by companies to generate supplies to meet changes to demand
- What companies in reality do is to use expectations of future cash flows (from consumers’ abilities to take on more debt) as collateral to themselves go deeper into debt.
- Credit/debt, thus works both sides of the supply/demand equation
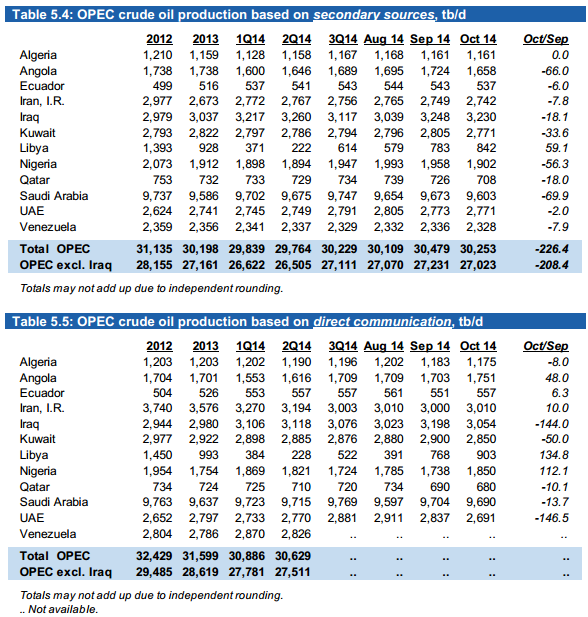
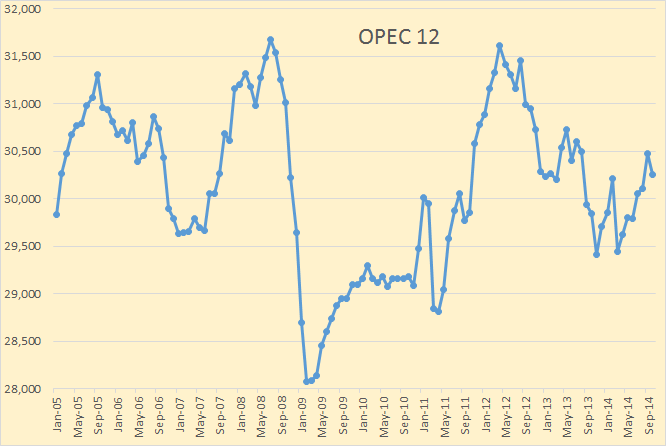
- How OPEC shapes their policies as responses to declines in the oil price
Will OPEC establish and defend a price floor for the oil price?
I have recently and repeatedly pointed out;
- Any forecasts of oil (and gas) demand/supplies and oil price trajectories are NOT very helpful if they do not incorporate forecasts for changes to total global credit/debt, interest rates and developments to consumers’/societies’ affordability.
Oil is a global commodity which price is determined in the global marketplace.
Added liquidity and low interest rates provided by the world’s dominant central bank, the Fed, has also played some role in the developments in LTO extraction from the Bakken formation in North America.
As numerous people repeatedly have said; “Never bet against the Fed!” to which I will add “…and China’s determination to expand credit”.
Let me be clear, I do not believe that the Fed’s policies have been aimed at supporting developments in Bakken (or other petroleum developments) this is in my opinion unintended consequences.
In Bakken two factors helped grow and sustain a high number of well additions (well manufacturing);
- A high(er) oil price
- Growing use of cheap external funding (primarily debt)
In the summer of 2012 I found it hard to comprehend what would sustain the oil price above $80/Bbl (WTI).
The mechanisms that supported the high oil price was well understood, what lacked was documentation from authoritative sources about the scale of the continued accommodative policies from major central banks’ (balance sheet expansions [QE] and low interest rate policies) and as important; global total credit expansion, which in recent years was driven by China and other emerging economies.
I have described more about this in my post World Crude Oil Production and the Oil Price.
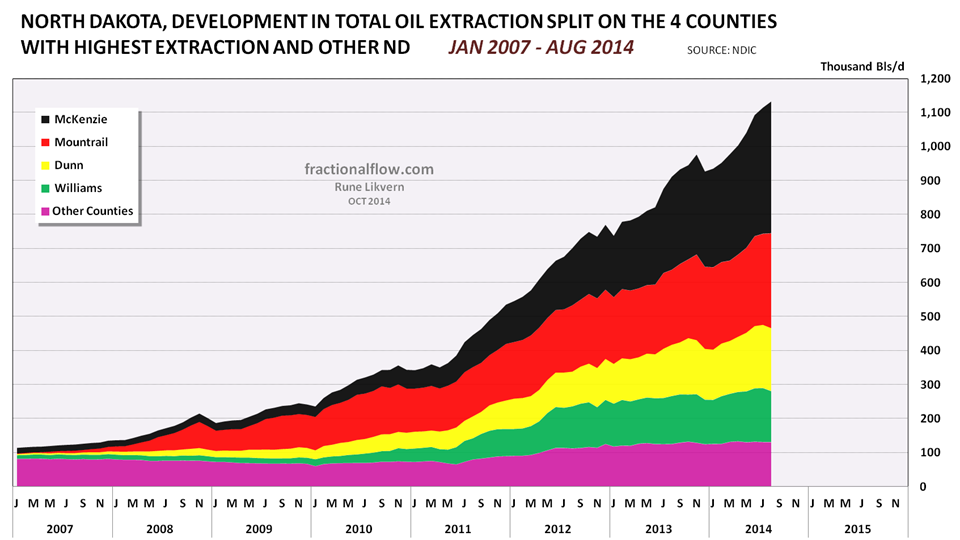
Figure 02: The chart above with the stacked areas shows developments in all oil extraction in North Dakota as of January 2007 and of August 2014 split on the 4 counties with the highest extraction and the rest of North Dakota. Growth in oil extraction in North Dakota is now primarily from McKenzie and Mountrail counties.
Read More