Enno Peters’ post + EIA DPR Report

The first half of this post is a guest post by Enno Peters. The second half is taken from the latest EIA Drilling Productivity Report.

GEOGRAPHICAL ANALYSIS OF WELL QUALITY IN NORTH DAKOTA

by Enno Peters

SUMMARY

I was interested in doing a geographical analysis of the oil production in North Dakota. Detailed information made freely available by the NDIC allowed me to analyze how, geographically, wellperformance has been changing over time, in the area of North Dakota where most oil is produced.

RESULTS

In the following animated gif, you will see part of North Dakota. It contains the North West corner that borders Montana and Canada. The scale is in miles, with a rather arbitrary origin. Projected on this map is a contour map. The numbers of these contours are the cumulative 1 year returns for wells drilled within that area, and the unit is 1000 barrels of oil (no gas). For example, contours with the value 50 mark the area in which wells produced at least 50 k barrels of oil in their first year.

animated (1)

I could calculate the surface areas of several levels of first year well returns, in order to determine the trend of these areas. In the following chart you can see for each year the (estimated) surface volumes for 3 levels of first year well returns, 50k, 80k, and 110 k barrels of oil.

Enno's Chart

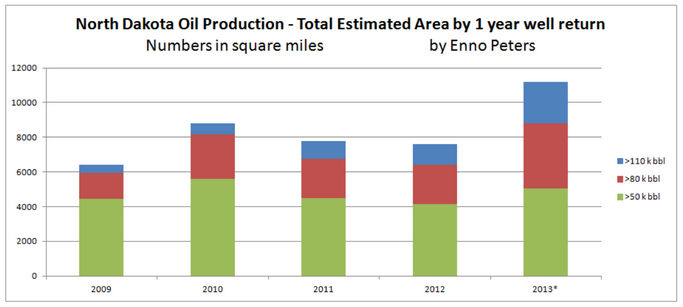
The sudden increase in 2013 of estimated productive surface area, in which wells could produce at least 50 k barrels of oil in their first year, may be explained by

1) the fact that I could only use data until June 2013 (as the 2014 May data is currently the latest one available), and therefore the number of data points are 1/3 of what I have for 2012. The method to determine the contours may not be suitable with this number of data points.

2) changing well practices

3) entering of new formations

So far I suspect that it is mostly 1), but that 2) and 3) could also be part of the answer, and therefore recommend to mostly ignore the 2013 results for now.

As a guide to interpret these results, I estimate (based on a discounted cash flow analysis) that a well that returns 50 k barrels of oil needs a minimum WTI price of about $120; about $82 WTI is needed for 80 k wells or better, and a well that returns 110 k barrels of oil in its first year is about even with $64 WTI. These are rough indications; I have seen a good analysis that estimates 10% higher required WTI prices for these levels of well performance. With current prices that would mean that 50 k wells are not profitable, while 80+ k wells clearly are.

I further estimate that the estimated total oil return (EUR) of a well is just over 4 times its first year return.
Read More

OPEC Annual Statistical Bulletin + MOMR

The August OPEC Monthly Oil Market Report is out with the OPEC production numbers for July 2014. There were no big surprises and only small revisions in the June data.

OPEC 12

The OPEC 12 was up  166,000 barrels per day. The increase was due to some Libyan oil coming back on line.

Libya

Libyan crude only was up 206 kbd to 438 kbd. Libya was up and down all the month of July and is now down again. From the Wall Street Journal: Risks Remain to Libya’s Oil Supply Despite Reopening of Ports, Fields Behind a pay wall but accessible via Google.

Following an end to protests by a local ethnic group at the country’s largest oil field, called Sharara, Libya’s oil production surged to a five-month high in mid-July to about 600,000 barrels a day—one third of which came from Sharara…

A week after the fighting broke out Libya’s state-owned National Oil Co. acknowledged the country’s output had fallen back by around 100,000 barrels a day.
Read More

The Imminent Peak in US Oil Production

This is a guest post by David Archibald

The Imminent Peak in US Oil Production

The seven years of production of tight oil in the US has produced enough data to
enable estimation of the amount of oil that will be recovered from these systems and
the timing of peak production. Based on data to May 2014, the four main tight oil
basins will produce a total of 7.7 billion barrels with a peak production rate of 3.9
million barrels per day in mid-2015. Following that peak, production is predicted to
decline as rapidly as it rose. That in turn is expected to cause a re-assessment of the
ability to produce sufficient transport fuels based on current policies.

The Bakken in North Dakota

Jean Laherrere has plotted monthly oil production from the Bakken Fm in North
Dakota using Hubbert linearization:

Laherrere 2014

FIG. 1

Also called a logistic decline plot, Hubbert linearization plots annual production divided by cumulative production to that date on the y axis against cumulative production on the x axis. This is the method that M. King Hubbert famously used in 1956 to predict the peak of US oil production in 1970. He was also largely correct in predicting the rate of decline from that peak. This methodology is based on the theory of the rate of extraction from a finite resource originally developed by the early nineteenth-century Belgian mathematician Pierre Francois Verhulst (1804–1849). The fact that Bakken production from 2012 has plotted as a straight line on this graph reflects depletion of a resource close to 2,500 million barrels.

Nearly 90% of Bakken production in North Dakota comes from four counties:Williams, Dunn, Mountrail and McKenzie. Figure 2 shows the monthly production history of these counties from 2005:

Big Four Data

FIG. 2
Read More

Global Financial System: On Life Support

Yesterday I watched a short web video that blew me away: Global Financial System: On Life Support. Then I watched it again, and again… It is only 12 minutes long. The crux of the presentation was not only that the global financial system is on life support but also that the financial system is dependent on energy flows into the economy and energy flows are dependent on a healthy financial system. That is they are co-dependent upon each other.

About two centuries ago, a new financial system was required:

To concentrate and direct the vast amounts of capital needed to exploit fossil fuel resources. 

To fund the exponential growth that these energy resources facilitated.

Life Support 6


The crux is a vast amount of capital is needed to fund the fossil fuel industry and…

Vast amounts of fossil fuels are needed to feed economic growth of the economy.

Price vs. Production

Economic growth is driven by cheap fossil fuel, primarily cheap crude oil. If the price gets too high the economy suffers. Less oil is consumed at this price so the price collapses. When the price collapses a production decline inevitably follows. And when the price rises again, a production increase will follow… if there is more oil to produce at that price.
Read More

EIA Petroleum Supply Monthly

The EIA has released its Petroleum Supply Monthly with C+C production numbers through May 2014. Of all the EIA data releases this seems to be the most accurate. However in some cases it is only as good as a few EIA employees guesses. And the more state data they have to work with, the better their guess.

The data in this report goes back to 1920 for total US production and to 1981 for individual states and offshore production. However I have chosen to shorten the time frame for my charts in order to better show what has happened recently.

USA

US production was down 36,000 bp/d in May to 8,357,000 barrels per day. US production took off in mid 2011 when Shale production took off and has risen some 3,300,000 since. Of course there was shale production prior to this but it was only keeping US production on a relatively flat plateau.

ND and Montana

Everyone is interested in the Bakken so I have combined the two Bakken states. Of course there is production in these two states outside the Bakken but this is the best I could do. Note that when the Bakken has one bad month as they had in December, it takes several months to get back to their prior production level.

Read More