EIA’s Drilling Productivity Report

Note: Just as I was finishing this post North Dakota published their production numbers for May 2014. North Dakota production was up over 36,000 barrels per day on 227 new well completions according to The Director’s Cut. I will have a post on all that tomorrow.

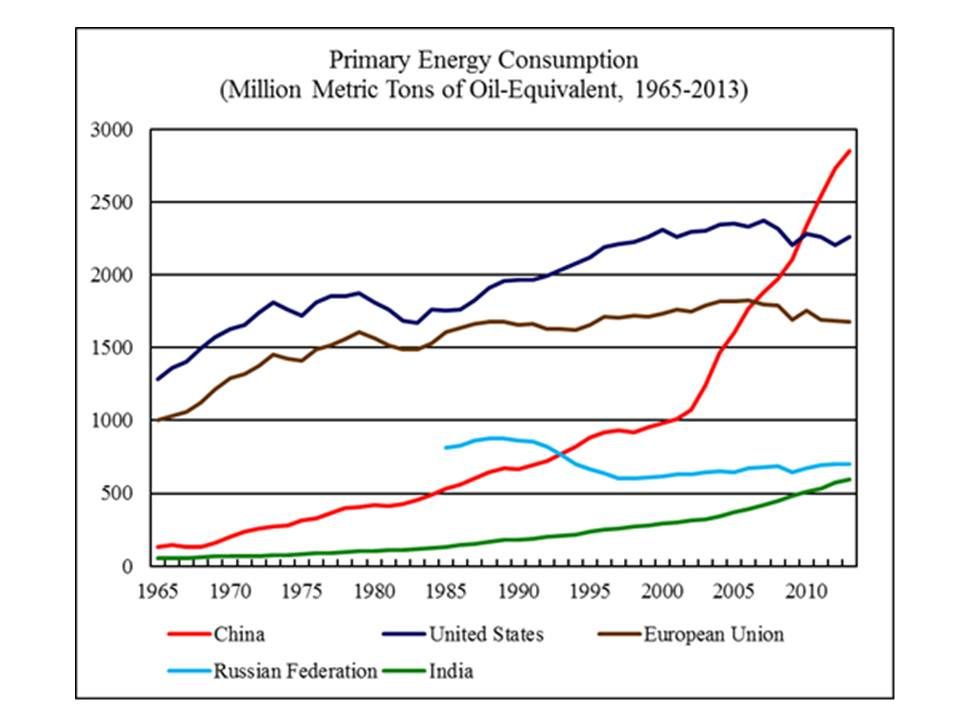
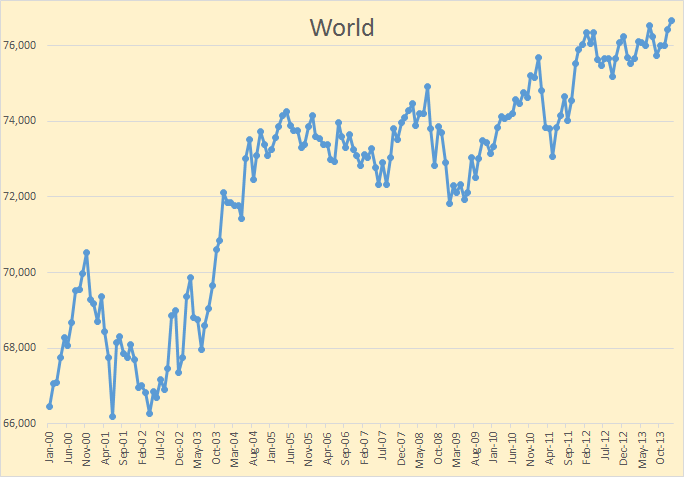
The EIA’s Drilling Productivity Report has just came out. Below are a few charts gleaned from that report. The World’s seven largest publicly owned oil companies have peaked. Their combined production has declined 12.4% since 2009.

The Drilling Productivity Report shows, or tries to show, the true decline rate of shale oil and gas. I usually only track the oil however.

Bakken Legacy Decline

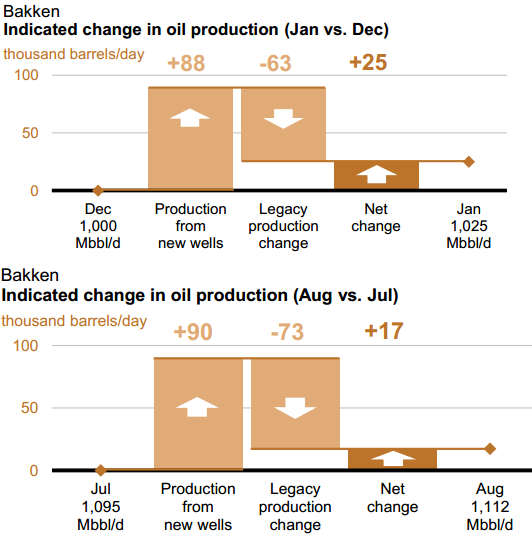
In January the EIA estimated that Bakken production from new wells would equal 88 kb/d. They estimated that the declines of all older wells would equal 63 kb/d leaving net production at 25 kb/d.

In August they estimate that Bakken production from new wells will equal 90 kb/d or 2 kb/d above January new well production. They estimate that the decline from older wells will equal 73 kb/d, an increase of 10 kb/d from January, leaving a net increase in production of 17 kb/d.

Eagle Ford Legacy Decline

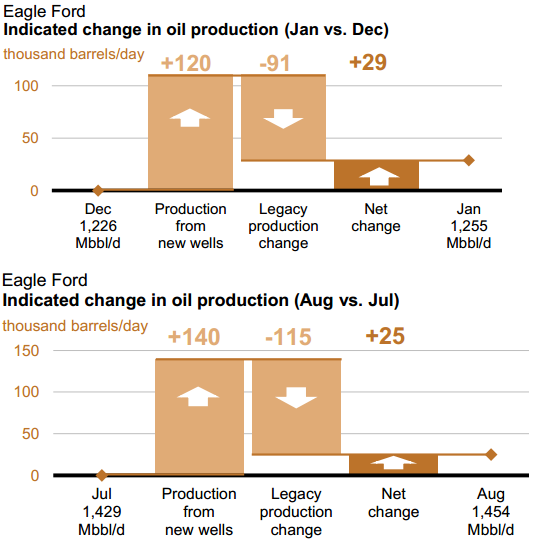
Eagle Ford fared a bit different. In January they thought new well production would increase by 120 kb/d while older wells would decline by 91 kb/d leaving net production 29 kb/d. In August they expect production from new wells will equal 140 kb/d, a whopping 20 kb/d over January numbers. However decline from older wells will have increased to 115 kb/d, 24 kb/d more than it was in January, leaving net production up 25 kb/d. So in spite of the 20 kb/d increase over January new well production, net production will still be 2 kb/d lower than January.
Read More

OPEC Update also Moscow Confirms Russian Oil Production in Decline

OPEC has just published their latest Monthly Oil Market Report with the June production numbers. All data is in thousand barrels per day and is Crude Only.OPEC 12

All revisions in the May data were minor. The June OPEC Crude Only production was down 80,000 bp/d from May.

Iraq

The big story in June was the invasion or Iraq. It has has only minor effect on production. Iraqi production was down 169,000 bp/d in June.

Saudi Arabia

OPEC’s largest produce and the World’s largest exporter, Saudi Arabia, increased Crude production by 48,000 bp/d in June. There has been very little change in Saudi production in the last nine months.

All other OPEC producers had very little change from May to June. Charts of all 12 OPEC nations can be found on the OPEC Charts page.

Read More

EIA Update, March Production Numbers

The EIA updated their International Energy Statistics with the February production numbers about one day after they updated the January numbers. Then on Monday, July 7th, they posted the March numbers. So after preparing a complete post using the February data, I just trashed it and created a new one.

World

World C+C production reached a new high in February, up 531 kb/d to 77,257 kb/d. It was down 525 kb/d in March to 76,732 kb/d.

Non-OPEC

Non-OPEC C+C production reached a new high in December at 44,910 kb/d in December. Since then it has been down 362 kb/d in January, up 270 kb/d in February and up 19 kb/d in March.
Read More

World Energy 2014-2050 (Part 3)

This is a guest post by Political Economist

Solar Correction

As I reviewed my spreadsheet, I identified a copy and paste error resulting in a mis-calculation of the solar projection.  This affects the projection of annual installation of Solar PV capacity (see Part 2).

The correct projections of annual installation of Solar PV capacity are shown below:

 photo SolarCorrection070414_zps407c310d.png

Under the current projection, solar PV annual installation is projected to rise from 38 gigawatts in 2013 to 106 gigawatts by 2020.  Beyond 2020, the growth will slow down.  After 2030, it will plateau and approach 145 gigawatts (not 108 gigawatts as previously stated).

Again, please note this does not imply that solar electricity generation will peak.  Instead, it assumes that the GROWTH of solar electricity generation will peak and plateau.  In other words, it assumes that at some point in the future, solar electricity generation growth will become linear rather than exponential.  (I had an interesting discussion with Dennis on this after the post of Part 2)

I made corrections of the projected primary energy consumption and world GDP in accordance with the solar PV correction.  These are shown below.

Total Primary Energy Consumption

According to BP Statistical Review of World Energy 2014, world primary energy consumption reached 12,730 million metric tons of oil-equivalent, 2.3 percent higher than world primary energy consumption in 2012.  Figure 24 shows the primary energy consumption by the world’s five largest energy consumers from 1965 to 2013.

 photo PrimaryEnergy062114-1_zpsf37768e7.jpg
Read More

EIA World Crude + Condensate Production Update

EDIT: The EIA updated their International Energy Statistics Monday with their January update. I spent several hours on that update, updating all my spreadsheets, updating the Non-OPEC Charts page, the World Crude Oil Production by Geographical Area page, and creating the post below. Then after I had finished all that they, the EIA, published another International Energy Statistics with the February production data. Sorry but I am exasperated, I will deal with the February update sometime next week. Below is what I prepared before that update. Anyway the emphasis is far more on the yearly numbers than the monthly numbers.
+++++++++++++++++++++++++++++++++++++++++++++++
The EIA finally published an update to their International Energy Statistics. They were over a month late. Last time they were a month late they published two months data. This time no such luck, the data is through January 2014. There was only large revision in the historical data, Canadian December Production was revised up by 298 kb/d. There were several much smaller revisions but World December production was revised up by 273 kb/d to 75,431,000 bp/d in December.

World World C+C was up to 76,662,000 barrels per day, an increase of 231 kb/d over December. Average world C+C production was up only 132,000 bp/d in 2013 over 2012.

OPEC C+C

The Gain was all OPEC however. January OPEC Crude + Condensate production was up by 482,000 bp/d to 32,118,000 bp/d. This is considerably different from what the OPEC Monthly Oil Market Report reported. They had OPEC crude only production up by 147,000 bp/d in January to 29,855,000 bp/d. Understand this is crude only, not C+C. OPEC crude only seems to be holding relatively steady and stood ate 29,765,000 bp/d in May.
Read More