The EIA’s Drilling Productivity Report, Is Productivity Really Improving?

The EIA just published their latest Drilling Productivity Report. They kept their very linear increase for all LTO plays except for the Bakken. Strangely they updated their Bakken data right up through January according to the data they apparently received from North Dakota.

DPR Bakken

The last data point is February for the North Dakota data and May for the DPR data.

But the EIA posted some strange Legacy Decline numbers for the Bakken;

Bakken Decline Chart

Now this just doesn’t make any sense. The legacy decline is supposed to be the number of barrels per day all the wells in the combined declined. That number should increase, but gradually as new production comes on line. That is the more production the greater the decline. They have the decline rate at 60,553 bp/d in November, jumping to 123,248 in December, then falling back to 63,459 in January. That is impossible! The decline, in barrels per day, increases as production increases. But if production decreases then the number of barrels per day that declines must decrease, not increase.

Read More

Bakken Update February Production Numbers

The latest Update on Bakken and North Dakota LTO production is out.
ND Monthly Bakken Oil Production Statistics (Bakken Only)
ND Monthly Oil Production Statistics (All North Dakota)

Bakken Barrels Per Day

Bakken production in February was 888,398 barrels per day and all North Dakota February production was 951,350 barrels per day. Some revisions were made in the past production numbers. Only the last three months were significant however. Listed below are the actual production changes, per month, for the last three months:

Month         Bakken       North Dakota
Dec 13      -45,528        -40,284
Jan 14         6,542           -2,218
Feb 14       16,643          16,224

The Director’s Cut for this has not been published yet. I will update this post when it has been.  There were 119 additional wells in the Bakken and 79 in all North Dakota. That means a lot of North Dakota Wells were shut down.

A Bismark engineering firm has calculated the probable Bakken Peak.
Competition from Texas, winter expected to limit ND oil production

MINOT, N.D. – North Dakota oil production, which is poised to break the 1 million barrels per day benchmark, will peak at 1.2 million to 1.5 million barrels per day over the next five years, limited by winter weather and competition from Texas, a Bismarck engineering firm said this week.

I have charted that prediction below. The figures are the average yearly production.

Bakken Engineering Firm

Read More

OPEC Update, March Crude Production Data

The new Opec Monthly Oil Market Report is out with the March OPEC crude only production data. OPEC crude only fell by 626 kb/d and that was after February production was revised up by 121 kb/d. Big changes were Iraq, down 288 kb/d after February was revised up by 84 kb/d. Angola was down 154 kb/d.

OPEC 12

Iraq is back to the same levels it reached in September of 2012. But Iraq is scheduled to increase production. West Qurna-2 is starting to ramp up. It is supposed to be producing 400 kb/d by the end of the year. I really doubt that it will get to those levels by then but it will definitely add to Iraqi production.

Iraq

Read More

Just How Good Are The EIA’s Predictions?

Folks here know that I like to post charts created from oil production data. But there has been a dearth of data lately. But not to worry, the data should start coming fast and furious later this week.  However in the meantime I decided post a little about what the EIA expects in the future. They published the below comments and chart April 7, 2014. Bold mine.
Petroleum & Other Liquids

In the Annual Energy Outlook 2014 (AEO2014) Reference case, crude oil* production rises from 6.5 million barrels per day (MMbbl/d) in 2012 to 9.6 MMbbl/d before 2020, a production level not seen since 1970. Tight oil production growth accounts for 81% of this increase, and sees its share of national crude oil production grow from 35% in 2012 to 50% in 2019. In the High Oil and Gas case, U.S. crude oil production reaches 11.3 MMbbl/d in 2019 and reaches 13.3 MMbbl/d in the mid-2030s.

Under the Reference case, the import share of U.S. petroleum and other liquid fuels falls to about 25% during the last half of the current decade before rising again to 32% by 2040. In comparison, the High Oil and Gas Resource case projects that net U.S. oil imports will continue to decline through the mid-2030s and remain at or near zero between 2035 and 2040.

EIA 2014 Projection

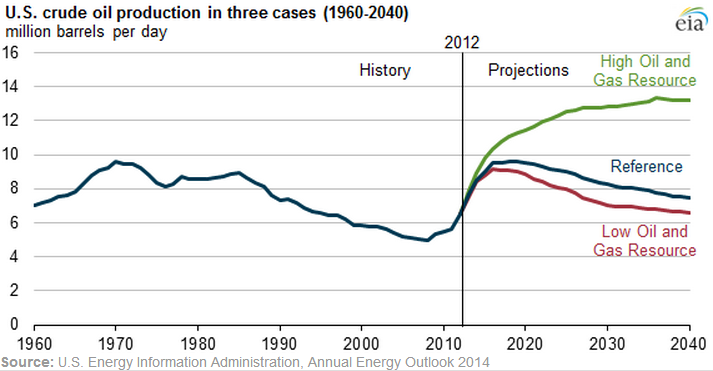
 In the High Oil and Gas Resource case, tight oil plays an even more prominent role in driving national production growth, accounting for nearly two-thirds of total U.S. production by 2035, versus less than half of total U.S. production in the Reference case. Tight oil development is still at an early stage, and the outlook is highly uncertain. In EIA’s view, there is more upside potential for greater gains in production than downside potential for lower production levels. The High Oil and Gas Resource case assumes improvements in tight oil production technology beyond those in the Reference case, as well as higher well productivity rates.

Other assumptions reflected in the High Resource case include:

  • Identification of additional tight oil resources
  • 50% higher Estimated Ultimate Recovery (EUR) for tight/shale oil and natural gas wells
  • 50% lower well spacing per acre for tight/shale oil and natural gas wells, with diminishing EUR for closely-spaced wells
  • A 1% annual increase in the EURs for tight/shale oil and natural gas wells reflecting both abundant resources and technology advances
  • Additional resources in Alaska and Lower 48 offshore fields

Read More