The EIA’s Latest Drilling Productivity Report

The EIA’s latest Drilling Productivity Report is out. Not a lot of changes since we now know that the EIA just guesses at the production for the last five months, August through December, then plugs in their estimate for the next two months, January and February. In the case of the Bakken they say December production was 1,003,578 bp/d and January and February will be 1,025,634 and 1,050,521 bp/d respectively. For Eagle Ford December production, they say, was 1,221,576 bp/d and they expect January and February production to be 1,251,617 and 1,285,224 bp/d respectively.

The below chart shows the Bakken production change from month to month. I have shortened the time displayed in order to better show the month to month change.Bakken Change

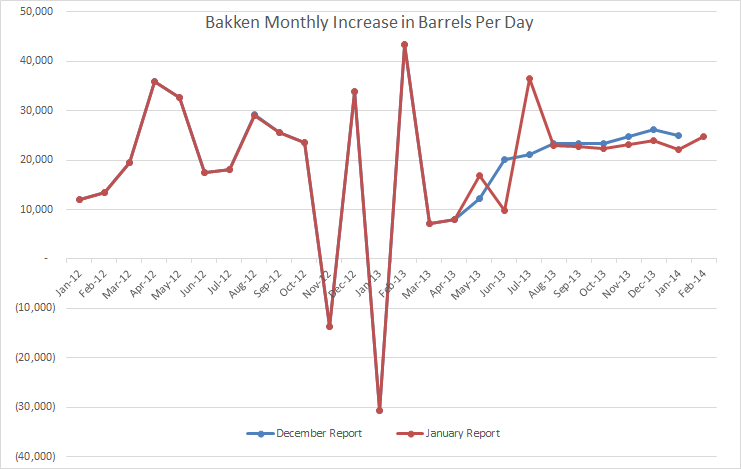
Notice the dramatic change in the January report for May, June and July. Obviously they looked at the real data and saw how different it was from what they had previously just plugged in, and made the necessary changes. They are saying that the Bakken had a really good December, slightly better than January, then things turn up again in February.

Here is the same chart for Eagle Ford.

Eagle Ford Increase

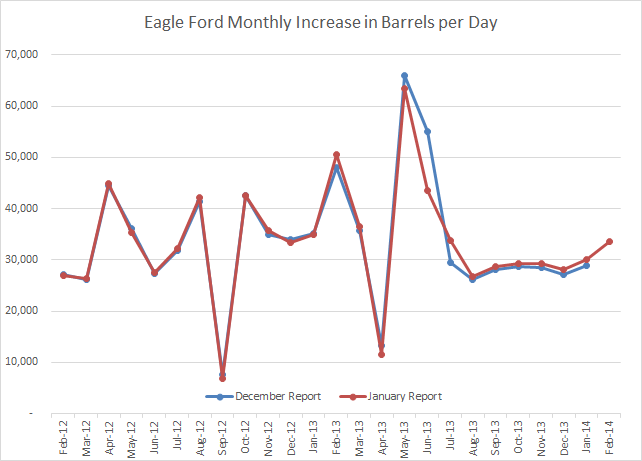
Not such dramatic changes in the Eagle Ford production data. But notice they are expecting an upturn in January and December. We shall see.

Read More

EIA International Energy Statistics for August and September

The EIA has finally published its International Energy Statistics. The last one had July data. This one is has two months updates, August and September. All the data I publish comes is Crude+Condensate from January 2000 through September 2013.

Again, all data is C+C in thousand barrels per day with the last data point September 2013.

World

As you can see from the chart World C+C production has leveled out in the last year and one half. September 2013 is slightly lower than February 2012.

There were a couple of major revisions in the July data. Canada was revised down by 269 kb/d while Non-OPEC was revised down by 228 kb/d. There were other small revisions upward. OPEC C+C had no revisions so that left World C+C for July revised down by 228 kb/d.

Both the USA and Canada are on a real tear, owing of course to Light Tight Oil and the Oil Sands. Their combined production is up about 1.9 mb/d since in one year, since last September.

USA + Canada


Read More

GOM Production and Other News

Not much happening on the Peak Oil front these days. I checked out the BSEE Gulf of Mexico production. Data is in kb/d with the last data point September 2013.GOM Production

Average production from the GOM has been relatively flat for the last two and one half years at about 1.260 million barrels per day. The arrow marks April 2010, the month of the Deepwater Horizon disaster.

The big deepwater plays continue to decline. I guess they are bringing on other wells in order to keep production flat.

Atl+TH+Tahiti+BF

The above chart is combined liquids production of Atlantis, Thunder Horse, Tahiti and Blind Faith. The last data point is September 2013.

Read More

IN BAKKEN (ND) IT IS NOW MOSTLY ABOUT MCKENZIE COUNTY

This post was originally posted at my blog “Fractional Flow”.

In this post I present an update to my previous posts over at The Oil Drum (The Red Queen series) on developments in tight oil production from the Bakken formation in North Dakota with some additional estimates, mainly presented in charts. The expansion is much about the differences between wells capable of producing, actual producing wells and idle wells (here defined as the difference between the number of wells capable of producing and the number of actual producing wells).


Figure 01: The chart above shows monthly net additions of producing wells (green columns plotted against the rh scale) and development in oil production from Bakken (ND) (thick dark blue line, lh scale) as of January 2000 and as of October 2013. The 12 Month Moving Average (12 MMA) is also plotted (thick dotted dark red line, lh scale).

There is still noticeable growth in tight oil production from an accelerated additions of producing wells.

  • For October 2013 North Dakota Industrial Commission (NDIC) reported a production of 877 kb/d from Bakken/Three Forks.
  • In October 2013YTD production from Bakken/Three Forks (ND) was 775 kb/d.
    (It is now expected that average daily production for all 2013 from Bakken (ND) will become around 800 kb/d.
  • The cash flow analysis now suggests less use of debt for manufacturing wells for 2013.
    Major funding for new wells now appears to come mainly from from net cash flows.

kb; kilo barrels = 1,000 barrels

Read More

Problems and Politics Keeping Crude Oil Production Well Below Expectations

OPEC December Crude Output Falls to 2-Year Low: Survey

Venezuelan Policies

Venezuelan production dropped 235,000 barrels a day to 2.45 million this month, the survey showed. The South American country pumped the least crude since October 2011. Resources have been diverted from energy sector into social welfare programs, sending production lower.

Petroleos de Venezuela SA, the state oil company, was purged after a two-month oil strike intended to oust President Hugo Chavez from power in 2003. Nicolas Maduro, who became president in March when Chavez died, has continued his predecessor’s policies.

“It’s hard to see how the situation in Venezuela gets any better,” said Bill O’Grady, chief market strategist at Confluence Investment Management in St. Louis, which oversees $1.4 billion. “Funds have been used to prop up the government instead of maintaining the oil industry since the PDVSA strike in 2003. It’s clear the country is on an unsustainable path.”

Venezuela

Data for the above graph is from the latest OPEC MOMR published last month and includes data through November 2012. It has Venezuela crude only production at 2,364,000 bp/d in November so it differs considerably from the Bloomberg report above. That report may be using production reported by Venezuela themselves which they reported as 2,854,000 bp/d for November or 490,000 kb/d above what the OPEC MOMR’s “secondary sources” said they produced.

Read More